

Introduction
Materials and Methods
1. Plant materials and growing conditions
2. Light environment scenarios
3. Chlorophyll fluorescence measurements
4. Time-course regression of qPd
Results and Discussion
1. Temporal dynamics of quantum yields and age-dependent regulation of NPQ under four dynamic light scenarios
2. Dynamics of the photoinhibition parameter qPd under four dynamic light scenarios
3. Scenario-wise comparison of qPd, yields, NPQ, and ETR across plant age
4. Interpreting photoinhibition through multiple fluorescence parameters
5. Contrasting photoinhibition and photosynthetic efficiency across light scenarios
Introduction
In natural environments, plants are exposed to fluctuating light conditions rather than the constant illumination typically provided by LEDs in controlled cultivation systems (Kromdijk et al., 2016). Even in greenhouse environments, light intensity at the crop canopy can rise from near zero in the early morning to over 1,000µmol·m-2·s-1 at midday, resulting in marked diurnal changes in photosynthetic activity (Nomura et al., 2022). In contrast, artificial light based cultivation systems such as vertical farms typically deliver the daily light integral at a constant intensity. In recent controlled environment agriculture (CEA), a major issue has emerged of minimizing energy consumption while maintaining crop yield to ensure sustainability (Beacham et al., 2019; Kozai, 2013). In CEA, various strategies for improving energy efficiency have been discussed, and optimizing photosynthetic responses through dynamic light control can be considered one promising approach to maximize cumulative photosynthate production, a key determinant of crop yield (Cai et al., 2025).
One of the key regulatory mechanisms in plant photosynthesis is non-photochemical quenching (NPQ). In particular, under dynamically changing light environments, the speed and efficiency of NPQ regulation have a major impact on photosynthetic performance (Kaiser et al., 2019). NPQ dissipates excess light energy as heat to protect the photosystems, but when light intensity shifts from high to low, a delayed relaxation of NPQ can transiently reduce CO2 fixation efficiency and thereby cause productivity losses (Werner et al., 2001). Kromdijk et al. (2016) demonstrated that genetically accelerating the relaxation of NPQ in tobacco enhanced photosynthetic efficiency during shade transitions and ultimately increased biomass production by approximately 15-20%. In that study, changes were also evident in the photoprotection index, a parameter that relates measured PSII efficiency to the efficiency expected from NPQ alone, thereby serving as an indicator of how effectively NPQ prevents photoinhibition of photosystem II (PSII) (Ruban and Murchie, 2012).
NPQ stands at the boundary between photoprotection and photoinhibition, making it a key aspect of photosynthetic regulation (Horton et al., 1996; Ruban, 2016). It is composed of several components that act over different timescales, which makes it particularly intriguing (Malnoë, 2018). The rapidly reversible energy-dependent quenching (qE) is the major component, activated within seconds by ΔpH across the thylakoid membrane. Zeaxanthin-dependent quenching (qZ) and state-transition quenching (qT) act on somewhat slower timescales, while photoinhibitory quenching (qI) and the sustained component (qH) can persist from hours to even days. These diverse components are interconnected, together mediating both photoprotective dissipation of excess energy and the longer-term processes associated with photoinhibition.
Due to the intertwined nature of NPQ mechanisms and other photosynthetic constraints across different time scales, photosynthetic performance exhibits diverse characteristics under fluctuating light environments. To identify light regimes that can enhance photosynthetic efficiency, it is therefore essential to examine how NPQ dynamics and photoinhibition respond to such fluctuations. In this study, we aimed to investigate photosynthetic parameters together with NPQ behavior under a range of dynamic light scenarios within a limited light integral.
Materials and Methods
1. Plant materials and growing conditions
Lettuce (Lactuca sativa L. cv. Top Green) was grown in a deep-flow technique hydroponic system. Seedlings were transplanted two weeks after sowing and cultivated in a controlled environment under warm-white light emitting diodes at a photosynthetic photon flux density (PPFD) of 200μmol·m-2·s-1 with a photoperiod of 16 hours. The plants were grown under an air temperature of 20-24°C, relative humidity of 50-70%, and supplied with a nutrient solution having an electrical conductivity of 1.8dS·m-1. Experiments for each light scenario (Scenarios A-D; see Light environment scenarios for detailed PPFD trajectories) were conducted for three times on different days after transplanting (DAT) as follows: Scenario A on DAT 12, 20, 28 (A1, A2, A3, respectively); Scenario B on DAT 13, 21, 29 (B1, B2, B3, respectively); Scenario C on DAT 14, 22, 30 (C1, C2, C3, respectively); and Scenario D on DAT 15, 23, 31 (D1, D2, D3, respectively).
2. Light environment scenarios
To investigate the continuous fluorescence responses of leaves under different daylight conditions, four distinct 10-hour light regimes (Scenarios A-D) were applied (Fig. 1). These regimes were designed to represent different patterns of light fluctuation, including high-frequency alternation of light and darkness as well as gradual transitions simulating natural daylight variation.
-Scenario A (Alternating lights): Consisted of five alternating cycles of 1 hour at a high light (PPFD 1200μmol·m-2·s-1) and 1 hour of darkness. The total light was 21.6mol·m-2·day-1.
-Scenario B (Light to dark): Contained single, continuous 5-hour period of high light (PPFD 1200μmol·m-2·s-1) followed by 5 hours of darkness. The total light was 21.6mol·m-2·day-1.
-Scenario C (Gradual light transition): Simulated a sinusoidal light pattern where PPFD was increased stepwise every hour for the first 5 hours (257, 378, 563, 738, and 1035μmol·m-2·s-1) and subsequently decreased in the same manner for the following 5 hours. The total light was 21.4 mol·m-2·day-1.
-Scenario D (Fine-grained light transition): Represented a dense version of Scenario C. PPFD was increased over 5 hours through 12-step sequence (22, 40, 58, 81, 112, 171, 256, 378, 562, 738, 1035, and 1350μmol·m-2·s-1) in 25-minute intervals, after which the sequence was applied in reverse. The total light was 14.4mol·m-2· day-1, which is lower than the other scenarios due to the limited resolution of light intensity control.
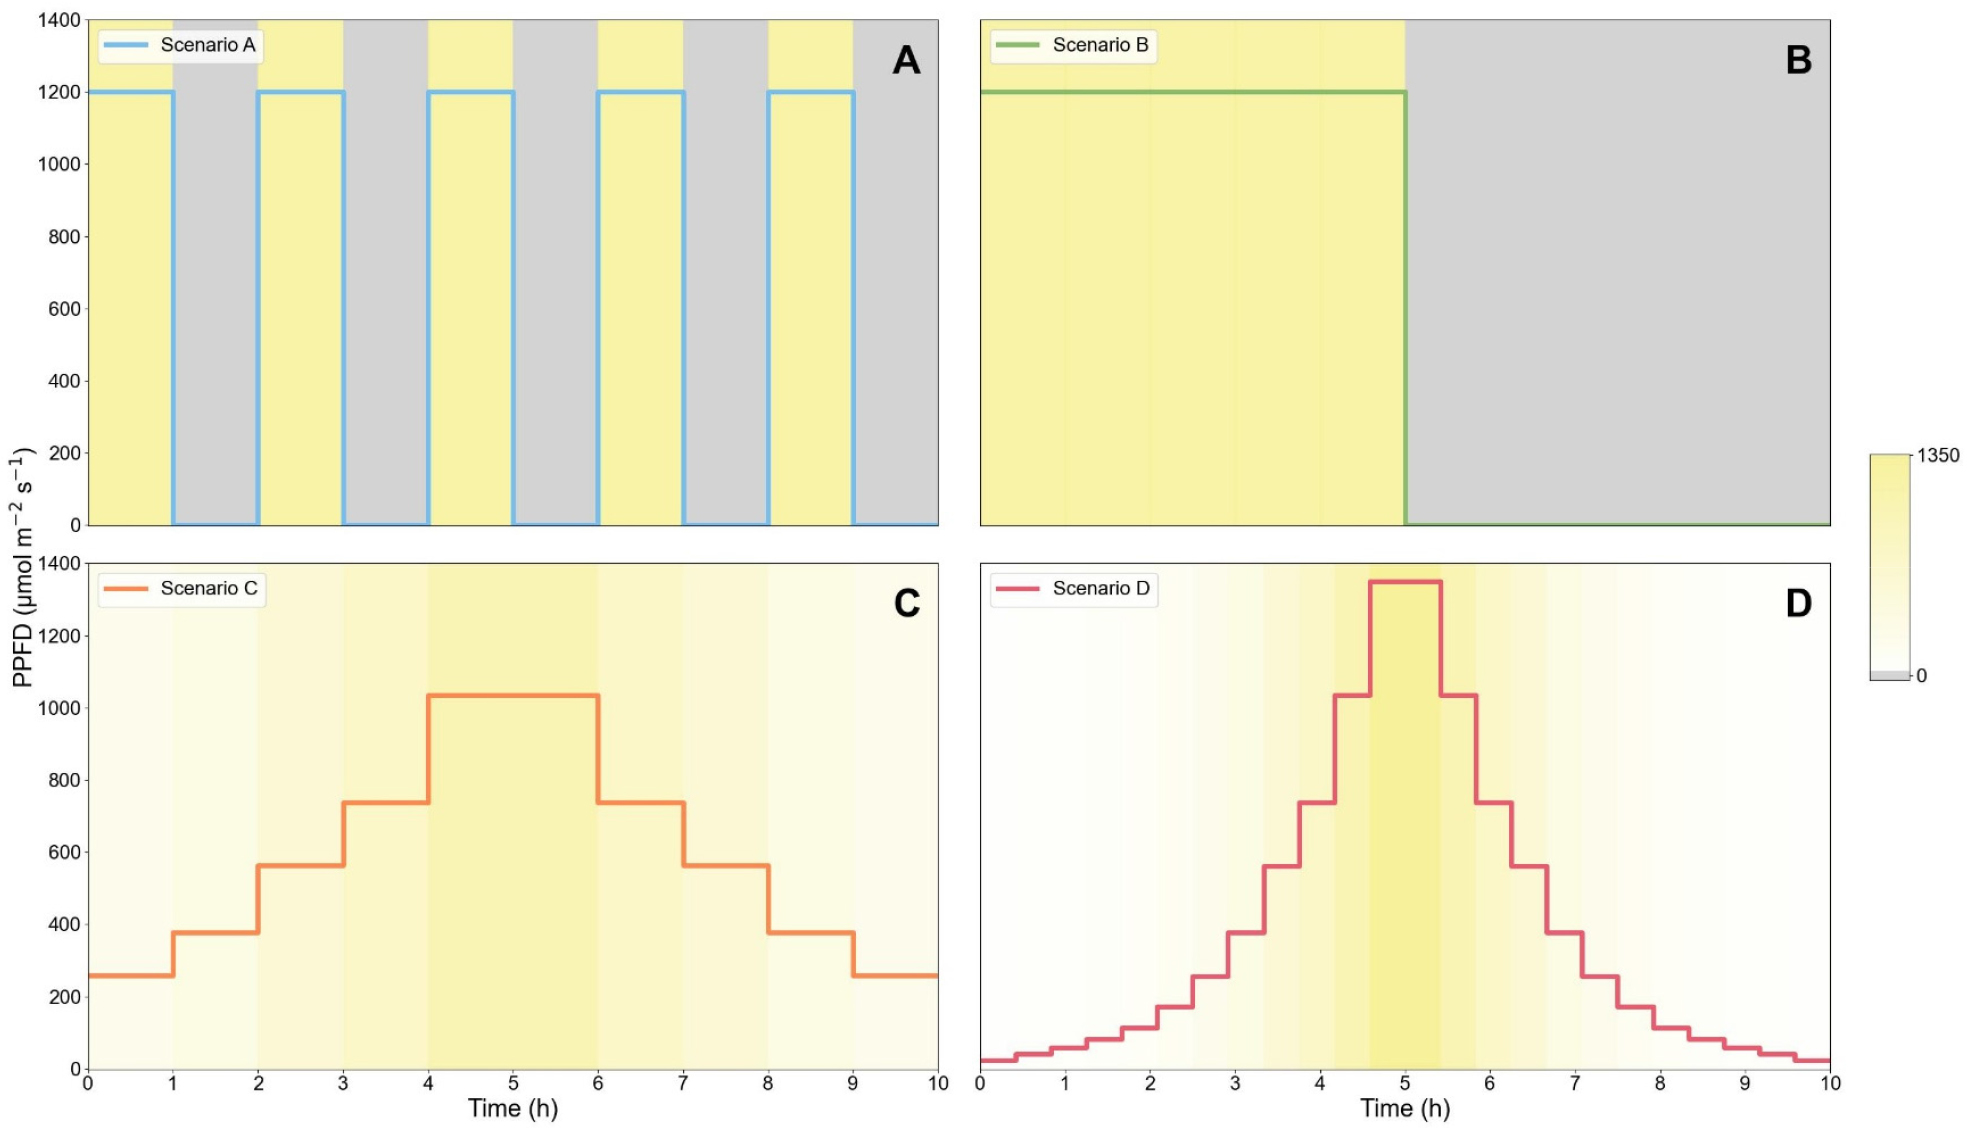
Fig. 1.
Light environment scenarios with photosynthetic photon flux density (PPFD, µmol·m-2·s-1) trajectories of the four dynamic light regimes applied for 10 hours. (A) Scenario A (Alternating lights, DLI = 21.6mol·m-2·day-1), (B) Scenario B (Light to dark, DLI = 21.6mol·m-2·day-1), (C) Scenario C (Gradual light transition, DLI = 21.4mol·m-2·day-1), and (D) Scenario D (Fine-grained light transition, DLI = 14.4mol·m-2·day-1). The background shading and the color chart on the right indicate incident PPFD, with grey indicating darkness (0μmol·m-2·s-1) and progressively deeper yellow indicating increasing irradiance levels.
3. Chlorophyll fluorescence measurements
Chlorophyll fluorescence was recorded using a MICRO- PAM fluorometer (Heinz Walz GmbH, Effeltrich, Germany) on the third or fourth fully expanded leaf. For measurement, the targeted leaf was isolated from the cultivation light; actinic illumination and saturating pulses were provided by the fluorometer light head and pre-programmed to follow each scenario.
Before each trial, leaves were dark-adapted for 30 minutes. The minimal fluorescence (Fo) was determined with a low intensity measuring beam, and the maximal fluorescence (Fm) was measured by applying a 0.8-second saturating pulse. During the scenario, saturating pulses were applied at fixed intervals to obtain light-adapted maximal fluorescence (Fm′): every 15 minutes for Scenarios A-C and every 5 minutes for Scenario D. Immediately after each Fm′ determination, actinic light was briefly interrupted and a 10-second far-red illumination period was applied to estimate the light-adapted minimal fluorescence (Fo′) under fully oxidized QA conditions. At the end of each 10-hour scenario, leaves were dark-adapted for 30 minutes and final Fo and Fm were obtained.
From these measurements, fluorescence parameters (e.g., NPQ, Y(II), ETR) were computed from the standard relationships. Additionally, the photoinhibition metric qPd was calculated following Ruban and Murchie (2012) using Fo′ and Fm′ obtained at each time point.
The qPd is calculated as follows:
where Fo′act is measured value obtained immediately after far-red illumination and Fo′calc is calculated value using the formula of Oxborough and Baker (1997).
4. Time-course regression of qPd
Time-resolved qPd values were modeled as functions of time by ordinary least-squares polynomial regression using the NumPy package (version 1.25.0) in Python (version 3.11.4; Python Software Foundation, Wilmington, DE, USA). Because qPd is interpretable only under actinic illumination, observations from dark periods were excluded: for Scenarios A and B, regression was fitted only in the light period. For Scenarios C and D, which comprise rising and falling PPFD phases, separate regressions were performed for the increasing and decreasing halves. Scenario A was fit with a linear model, and Scenarios B-D were fit with a quadratic model.
Results and Discussion
1. Temporal dynamics of quantum yields and age-dependent regulation of NPQ under four dynamic light scenarios
During each light treatment, the quantum yields of photochemistry of PSII (Y(II)), regulated non-photochemical quenching (Y(NPQ)), and non-regulated heat dissipation and fluorescence emission (Y(NO)) exhibited temporal dynamics that were further influenced by plant age (Fig. 2).
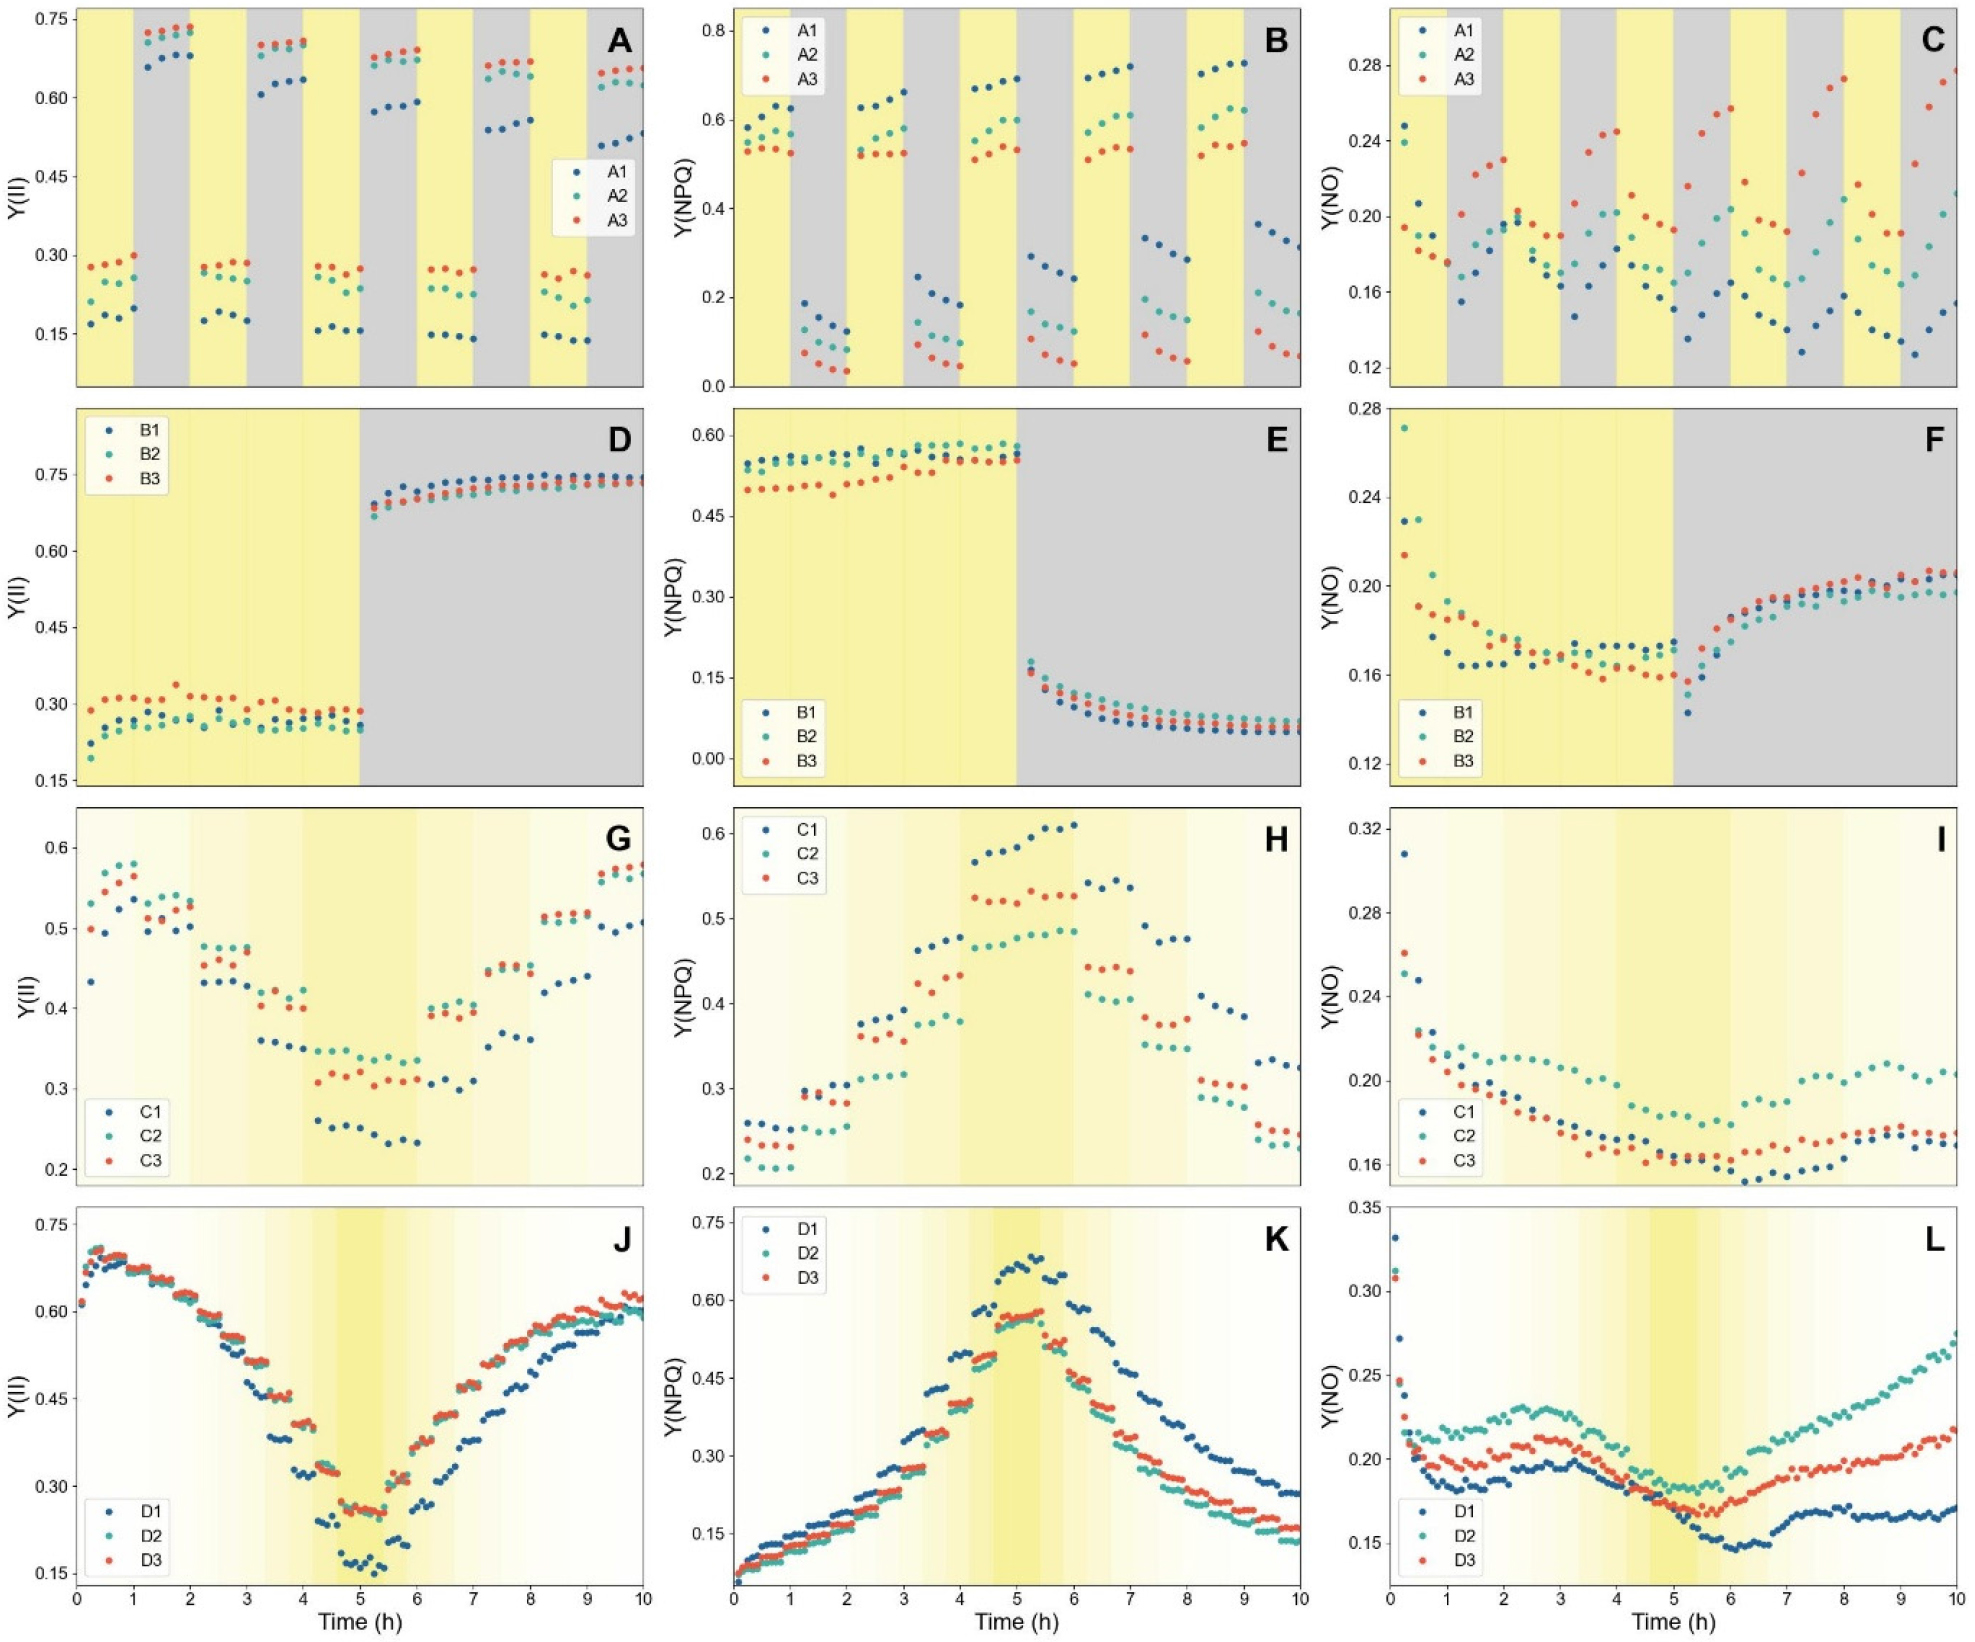
Fig. 2.
Temporal dynamics of chlorophyll fluorescence parameters under four dynamic light scenarios: Scenario A (A-C), Scenario B (D-F), Scenario C (G-I), and Scenario D (J-L). Panels A, D, G, and J show Y(II) (quantum yield of PSII photochemistry); panels B, E, H, and K show Y(NPQ) (yield of regulated non-photochemical energy dissipation); and panels C, F, I, and L show Y(NO) (yield of non-regulated energy dissipation). The background shading indicates incident PPFD, with grey indicating darkness (0μmol·m-2·s-1) and progressively deeper yellow indicating increasing irradiance levels. Leaves of three ages are shown (1-3 denote younger to older); measurements were performed on separate days for each scenario.
In Scenario A, Y(II) showed low values during each high light period but recovered during subsequent dark periods (Fig. 2A). However, with repeated light and dark periods, the extent of recovery progressively diminished, resulting in a gradual decline in Y(II) and an accompanying increase in Y(NPQ) (Figs. 2A and B). This trend was particularly pronounced in younger leaves, in which overall quantum yield efficiency was markedly lower. In Scenario B, Y(II) also showed low yields under high light and recovered once the light was turned off, while Y(NPQ) displayed the opposite response (Figs. 2D and E). Unlike Scenario A, plant age did not exert a significant influence on the dynamics in this regime. In contrast, Y(NO) varied only within a relatively narrow range and, unlike the other two parameters that exhibited pronounced shifts upon light on and off, Y(NO) remained comparatively stable (Fig. 2F). In Scenario C, both Y(II) and Y(NPQ) responded to the gradual stepwise changes in light intensity (Figs. 2G and H). Interestingly, despite the symmetrical increments and decrements in PPFD, the fluorescence yields did not follow perfectly symmetrical trajectories. The youngest plants showed the largest discrepancy between the increasing and decreasing phases, whereas the difference was less exhibited in older plants. Scenario D exhibited a similar pattern to Scenario C, but the asymmetry between the rising and declining phases was more evident (Figs. 2J-K). In all scenarios, Y(II) displayed an initial increase during the first hour of illumination (Figs. 2A, 2D, 2G, and 2J). This transient rise may reflect a lag in photosynthetic induction, as metabolic activity requires time to be fully activated following the dark phase (Kaiser et al., 2016).
During the dark periods of Scenarios A and B, Y(NPQ) declined gradually. This persistence can be attributed to qI, the slowly relaxing component of NPQ. Because the fast-relaxing NPQ components (e.g. qE, qZ) typically decay in short timescale of seconds to minutes, they should have already been released before the first dark-phase fluorescence measurement (Zuo, 2025). The remaining NPQ that relaxed gradually over hours is therefore attributable to qI, which is associated with photoinhibition of photosystems (Muller et al., 2001). Similarly, in Scenarios C and D, the observed asymmetry of Y(NPQ) despite symmetrical light intensity indicates a lag in NPQ relaxation and further demonstrates the presence of a photoinhibitory component. Such delayed relaxation of Y(NPQ) under high irradiance suggests the occurrence of photodamage (Han et al., 2023).
Overall, higher levels of Y(NPQ) were observed in younger plants, indicating a greater engagement of NPQ which leads to a lower yield of PSII. A similar tendency was reported by Jiang et al. (2005), who found that emerging leaves exhibited elevated NPQ accompanied by reduced Y(II). This observation is further supported by Carvalho et al. (2015), where NPQ in Arabidopsis thaliana declined progressively as the plants advanced through vegetative stage. The estimated amount of photoprotective NPQ (pNPQ) decreased with increasing plant age, whereas both the efficiency of pNPQ and the irradiance threshold that could be tolerated without incurring photodamage increased. The observed decrease in NPQ is likely associated with an age-dependent increase in the abundance of RuBisCO, which alleviates the limitation on linear electron flow (Bielczynski et al., 2017). Furthermore, in younger leaves, restricted sink capacity for photosynthates, immature stomatal regulation, or imbalances in redox homeostasis may collectively constrain electron transport.
2. Dynamics of the photoinhibition parameter qPd under four dynamic light scenarios
The photoinhibition parameter qPd, as proposed by Ruban and Murchie (2012), was monitored throughout each time sequence (Fig. 3). In Scenario A, qPd, which was considered only during the light period, progressively declined with repeated light and dark periods, deviating from unity and thereby reflecting a greater extent of photoinhibition (Fig. 3A). In Scenario B, qPd initially increased but subsequently decreased during the prolonged 5-hour high irradiance (Fig. 3B). In both scenarios, qPd values displayed a clear age-dependent decline, with younger leaves showing higher qPd and thus experiencing less photoinhibition (Figs. 3A and B). In Scenario C, qPd decreased as the light intensity increased except during the initial phase of illumination and recovered as irradiance declined (Fig. 3C). In Scenario D, qPd dropped more sharply than Scenario C during the peak of highest light period and then increased again as the irradiance decreased, eventually reaching a plateau during the low-irradiance period of the final 2 hours (Fig. 3D). This distinct trajectory reflects the exponential rather than linear setting of PPFD sequence applied to Scenario D. Moreover, asymmetry between increasing and decreasing period was pronounced.
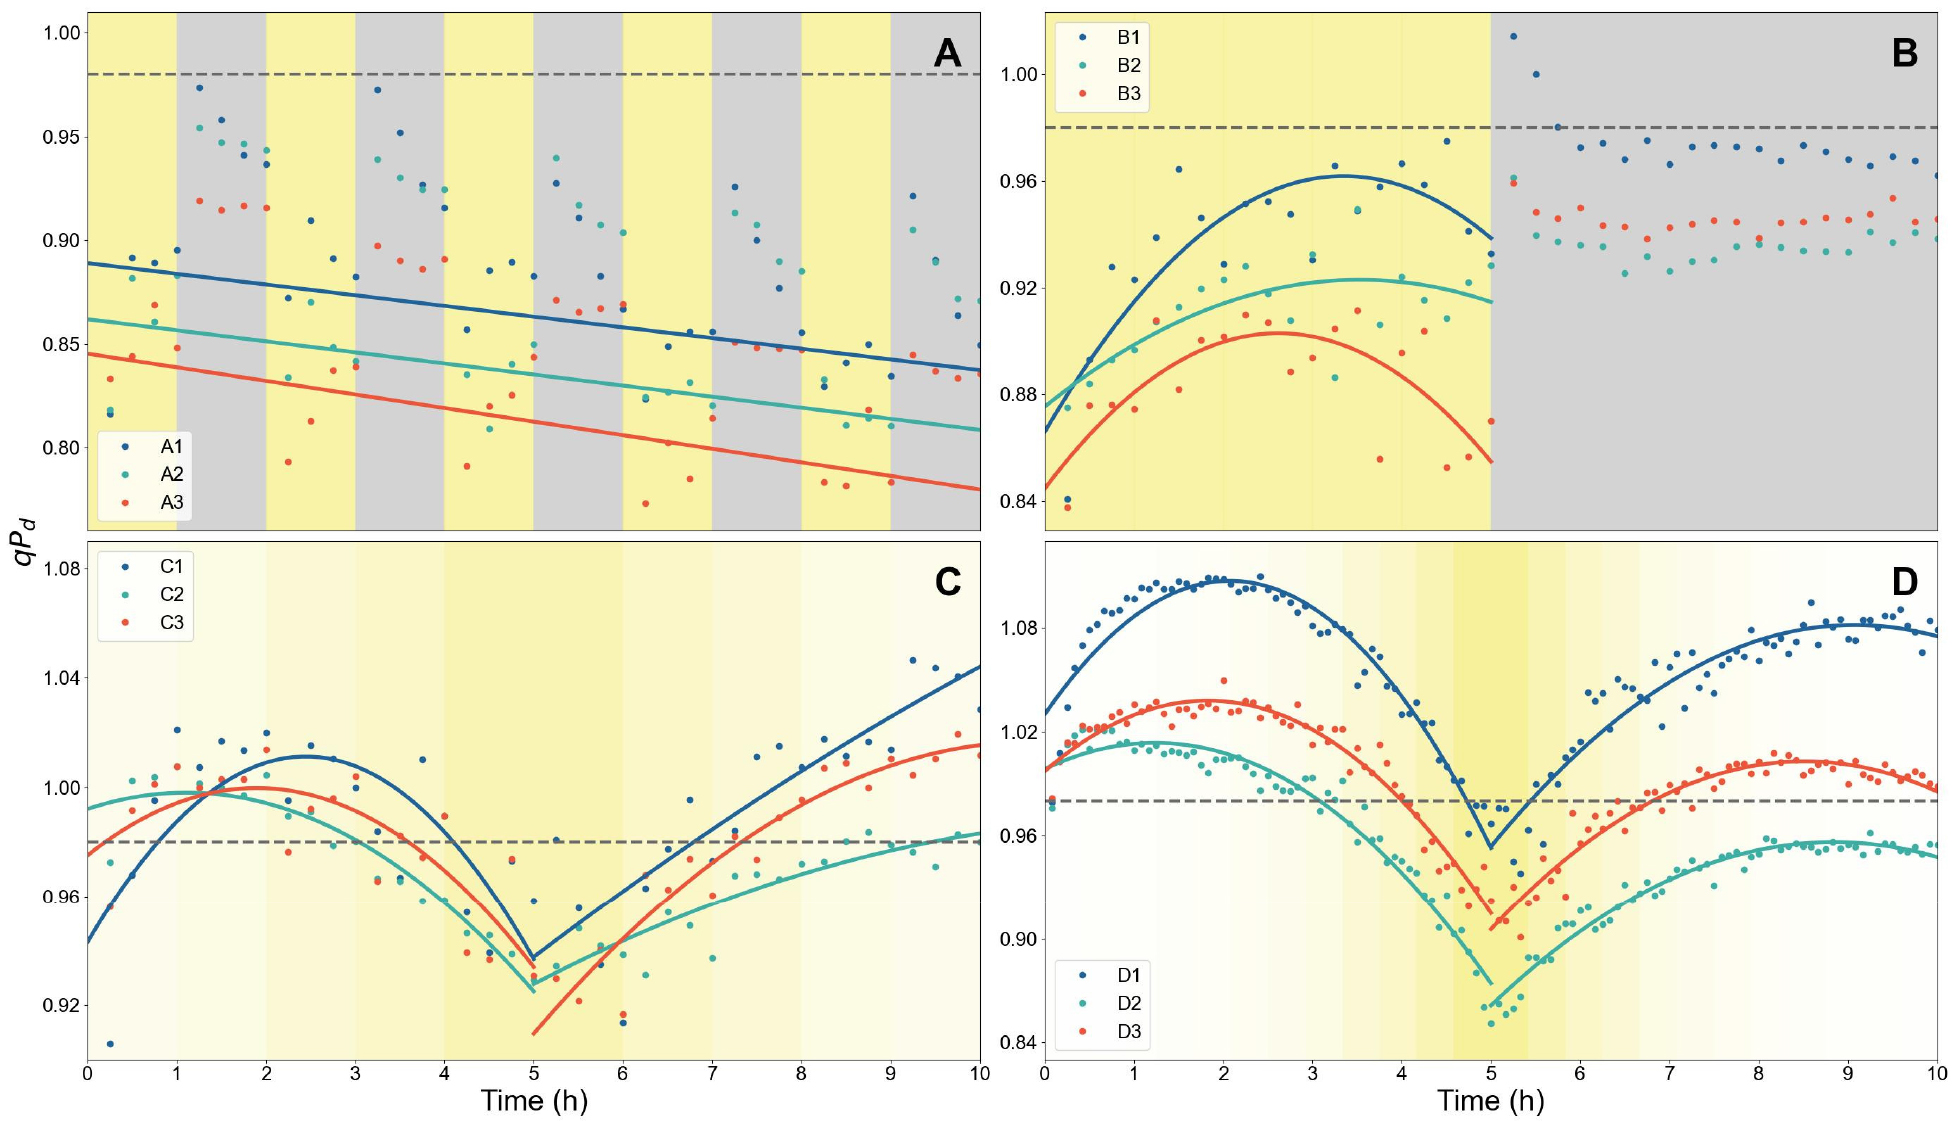
Fig. 3.
Dynamics of the photoinhibition parameter qPd under four dynamic light scenarios: Scenario A (A), Scenario B (B), Scenario C (C), and Scenario D (D). Points show qPd at each measurement time; solid lines denote least-squares regressions by leaf age (1-3, younger to older), with ages distinguished by the colors of both points and lines. In (A), regressions were fitted to light-period qPd values only. In (C) and (D), separate regressions were fitted before and after the 5-hour midpoint to capture the rising and declining phases. A horizontal reference line at qPd = 0.98 denotes the photoinhibition threshold (criterion for the onset of photoinhibition). The background shading indicates incident PPFD, with grey denoting darkness (0μmol·m-2·s-1) and progressively deeper yellow indicating higher irradiance.
In all scenarios, qPd showed a slight increase during the first hour of light period (Fig. 3). This transient rise may be attributed to the blue measuring light of the fluorometer illuminated to the leaves, which can initially enhance the excitation pressure by inducing a stronger imbalance between photosystems (Wilson and Ruban, 2020). Blue light is also known to damage the oxygen-evolving complex, thereby increasing the accumulation of P680+ which in turn oxidizes D1 protein, and promoting the formation of reactive oxygen species (ROS) from molecular oxygen (Nishiyama et al., 2006). This interpretation is consistent with the repeated rises in qPd at the onset of each light phase in Scenario A.
3. Scenario-wise comparison of qPd, yields, NPQ, and ETR across plant age
The mean values of qPd, quantum yields, NPQ, and ETR for each plant age across the scenarios are presented in Fig. 4. Among the youngest plants, Scenario A showed the lowest qPd, Y(II), and ETR, and the highest Y(NPQ) and NPQ, indicating the poorest efficiency in photon energy capturing. Scenario B showed the highest Y(II) and lowest Y(NPQ), although its ETR was not the highest. This discrepancy can be attributed to the scenario design, which included a 5-hour dark recovery period that was reflected in the quantum yields but not accounted for in the ETR calculation. Scenario C displayed the second-lowest Y(II), yet achieved the highest ETR among all scenarios, suggesting the greatest energy input into photosynthesis. Scenario D exhibited the highest qPd and the second-highest Y(II), indicating reduced photoinhibition during the light phase, but its ETR was lower due to the reduced total light intensity relative to the other scenarios. When normalized by the ratio of total light integrals between Scenarios C and D for the youngest plants, the mean ETR and NPQ values were 74.04 and 3.18, respectively. Although Scenario D showed higher normalized NPQ than all other scenarios, its normalized ETR remained lower than that of Scenario C (86.16), indicating that Scenario C maintained higher light reaction efficiency with lower reliance on photoprotective energy dissipation. Because all plants were grown under identical conditions prior to the 10-hour light treatments, this short-term normalization may provide a reasonable approximation of immediate photosynthetic capacity under equivalent light inputs, as longer-term acclimation effects were not yet manifested. Nonetheless, this normalization approach is rather simplistic and does not fully capture the complex, non-linear nature of plant responses to fluctuating light intensities.
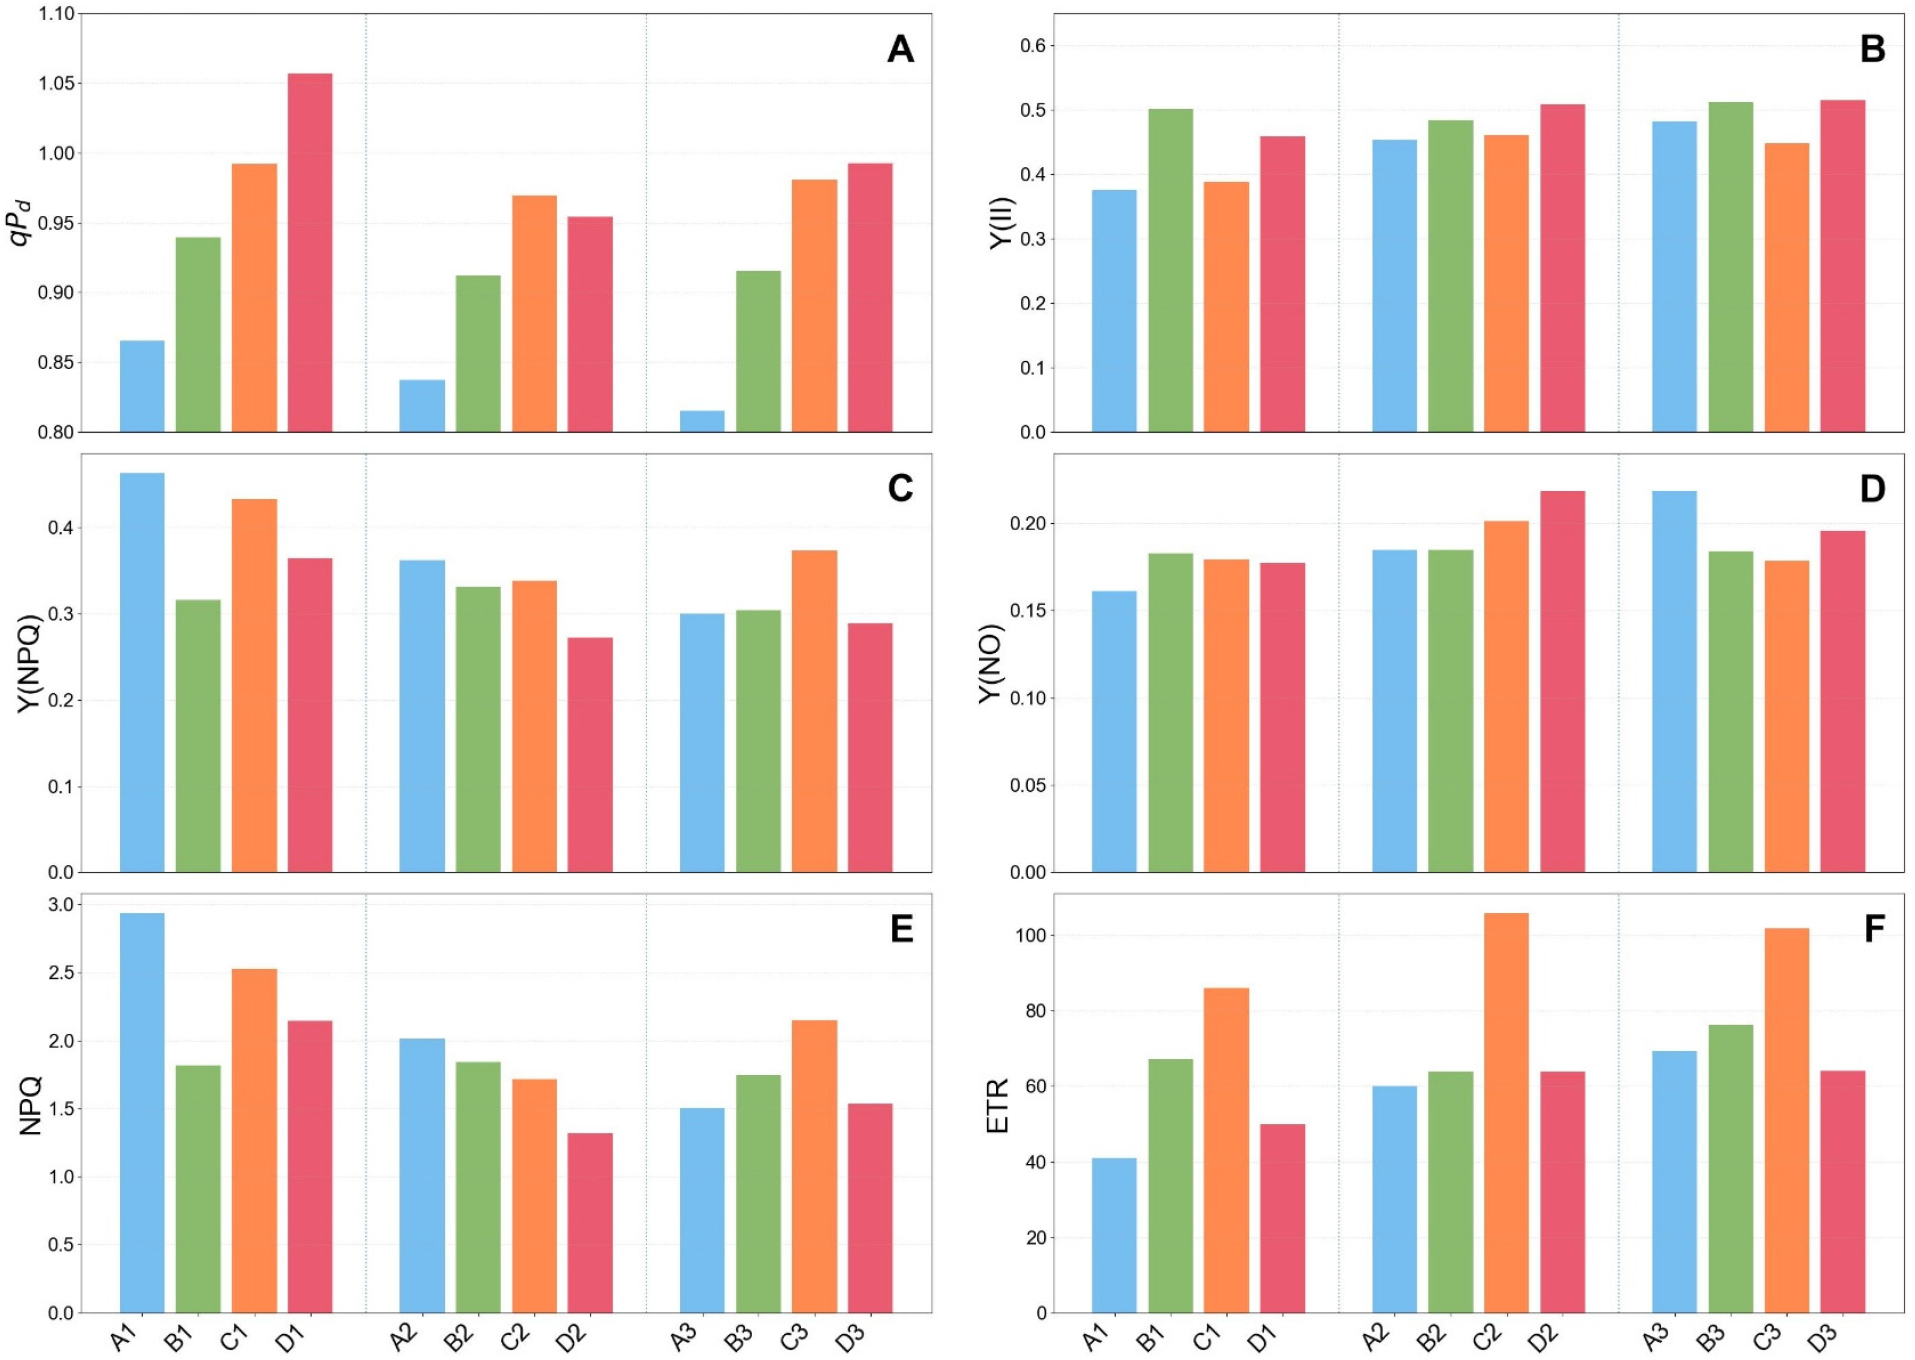
Fig. 4.
Mean values of chlorophyll fluorescence parameters over the 10-h measurement period under the four dynamic light scenarios. Bars represent averages for three leaf ages (1-3, younger to older) in each scenario (A-D). Panels show (A) qPd (photoinhibition parameter), (B) Y(II) (quantum yield of PSII photochemistry), (C) Y(NPQ) (quantum yield of regulated non-photochemical energy dissipation), (D) Y(NO) (quantum yield of non-regulated energy dissipation), (E) NPQ (non-photochemical quenching), and (F) ETR (electron transport rate).
In the intermediate-aged plants, the overall trends remained similar. For Y(II), Scenario B (with the recovery phase) and Scenario D (with lower total irradiance) maintained relatively higher values, but the differences among the scenarios became smaller. This convergence led to the superior performance of Scenario C in terms of photosynthetic energy utilization, which resulted from reduced energy dissipation compared with earlier stages, while Y(NPQ) remained consistent among the plant age in Scenario B. In the oldest plants, Y(NPQ) of Scenario C was higher than the other scenarios; however, this did not offset its consistently superior ETR. While chlorophyll fluorescence- based ETR primarily reflects light reactions rather than CO₂ fixation directly, ETR has been shown to be strongly correlated with the net photosynthetic rate across various C₃ species (Perera-Castro and Flexas, 2023). Based on this correlation, the enhanced ETR observed in Scenario C suggests that this light regime may be more favorable for the light reactions of photosynthesis and, potentially, for overall photosynthetic performance. However, whether these improvements in light reactions translate into enhanced CO2 assimilation and biomass accumulation under dynamic light conditions remains to be validated through gas-exchange measurements in future studies.
4. Interpreting photoinhibition through multiple fluorescence parameters
Fv/Fm was measured before and after the 10-hour light treatment (Fig. 5). In Scenario A, younger plants exhibited a pronounced decline in Fv/Fm (Fig. 5A). In Scenario B, plant age did not appear to exert a strong influence on the extent of Fv/Fm reduction (Fig. 5B). In Scenario C and D, the youngest plants showed greater decreases compared with older plants (Figs. 5C and 5D). Overall, younger plants experienced larger declines in Fv/Fm, consistent with previous findings that developing leaves are more susceptible to photoinhibition (Bertamini and Nedunchezhian, 2003). When comparing across scenarios, the decrease in Fv/Fm was most pronounced in Scenario A, indicating the strongest photoinhibitory effect under repeated high light and dark cycles.
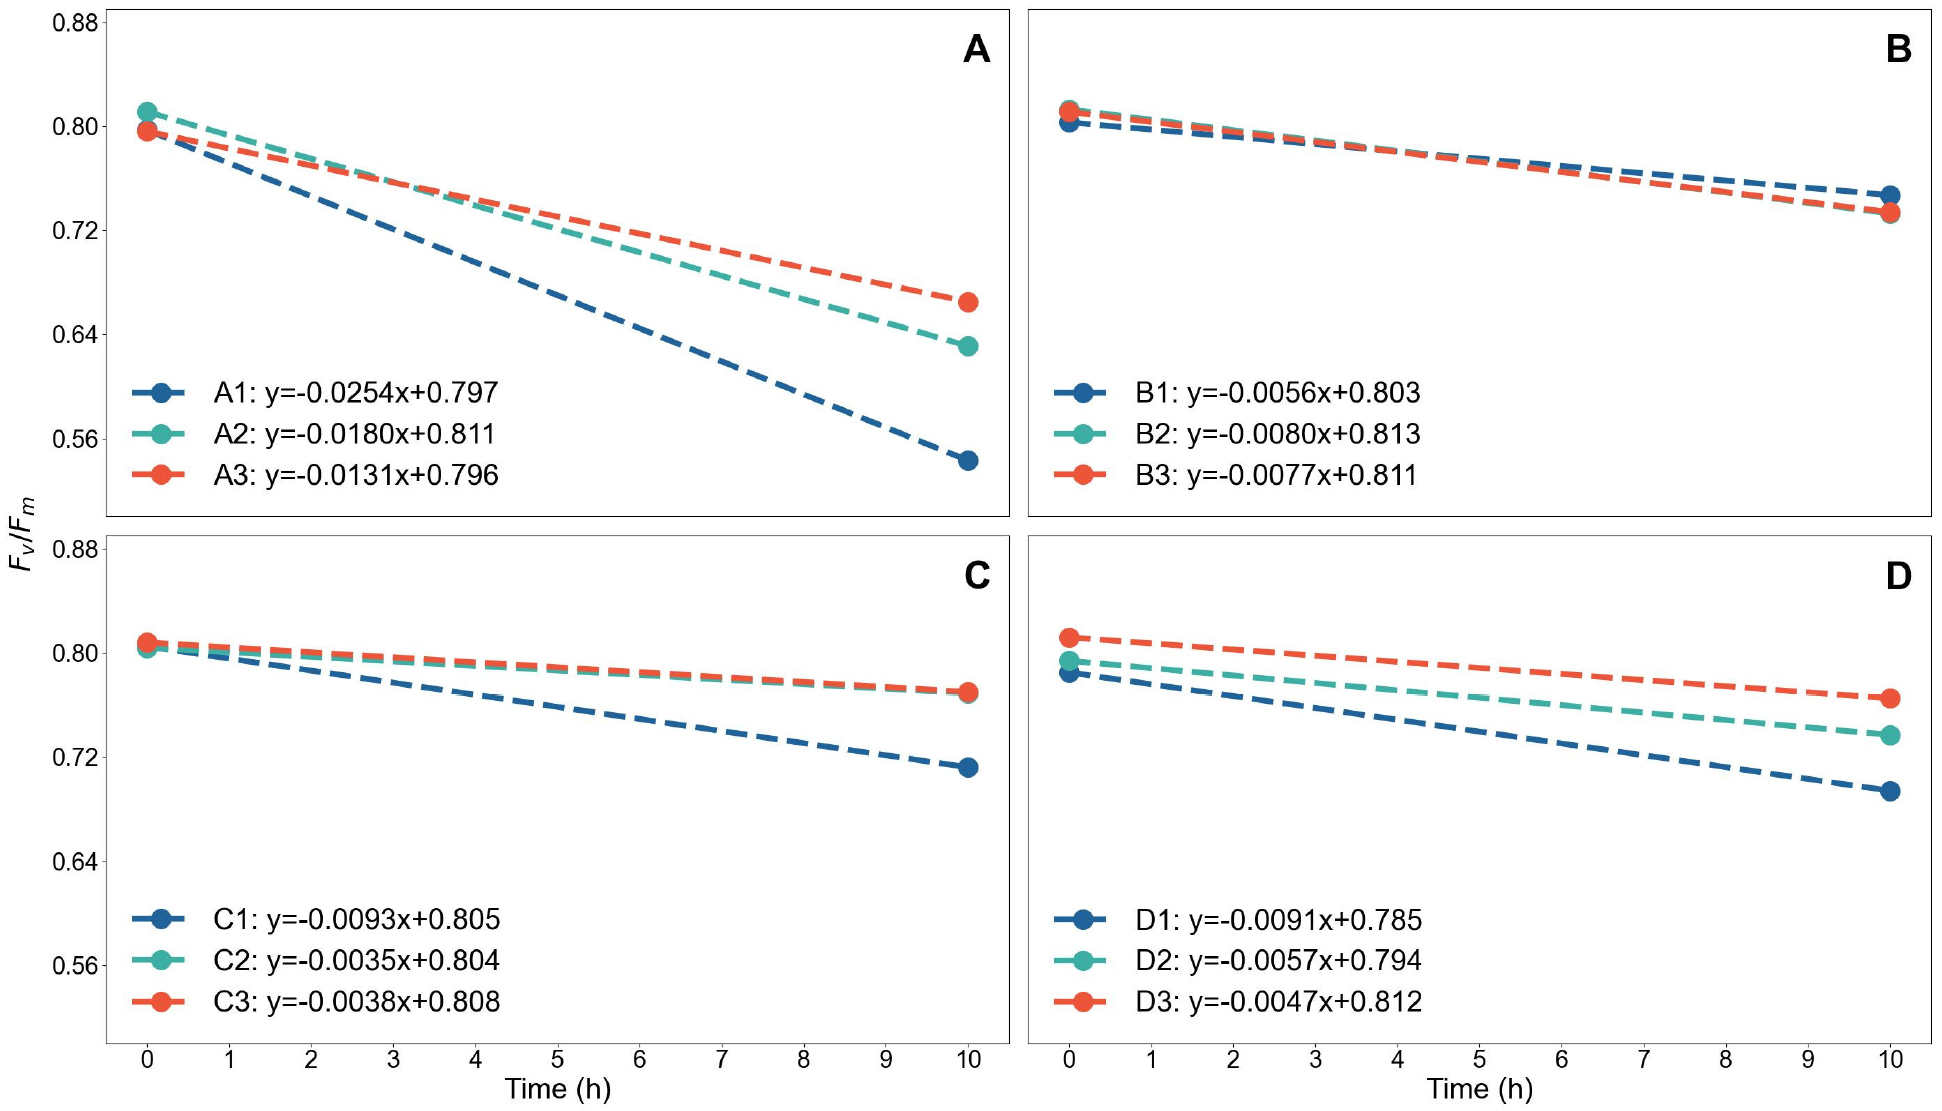
Fig. 5.
Temporal changes in maximum quantum efficiency of PSII (Fv/Fm) under the four dynamic light scenarios: Scenario A (A), Scenario B (B), Scenario C (C), and Scenario D (D). Points at 0 h and 10 h indicate measured values at the beginning and end of the 10-hour period. Dashed lines represent least-squares linear regressions for three leaf ages (1-3, younger to older), with colors denoting leaf age. Regression equations are shown for each leaf age within panels.
The increase-decrease pattern of qPd among scenarios followed expected trends; however, when comparing across plant ages within the same scenario, the relative rank of qPd did not align consistently with Fv/Fm results (Figs. 3 and 5). In younger leaves, Fv/Fm was generally lower, whereas qPd tended to be higher. Rather, the amount of NPQ seemed to correspond more closely to qPd rankings to some extent (Figs. 2 and 3). Because qPd reflects the instantaneous state of PSII-such as the level of over-excitation or the openness of reaction centers during illumination-it can increase under conditions of enhanced activation of photoprotective NPQ (e.g. qE, qZ) or cyclic electron flow. This interpretation is consistent with the higher photoprotective capacity of younger plants reported in previous studies (Jiang et al., 2005; Rankenberg et al., 2021). By contrast, Fv/Fm represents cumulative photoinhibition remaining after treatment. Although qPd and Fv/Fm are both used to assess photoinhibition and are generally positively correlated (Giovagnetti and Ruban, 2015), their biological interpretation would provide slightly different criteria for ‘photoinhibition’. Therefore, these parameters should be applied with caution, and the study about correlations among Fv/Fm, NPQ, and qPd should be further pursued.
5. Contrasting photoinhibition and photosynthetic efficiency across light scenarios
Scenario A appeared to exhibit the lowest efficiency of light utilization and the greatest degree of photoinhibition. Despite the longer period of high light in Scenario B, the recovery trajectory of yields during the first dark period of Scenario A (following a 1-hour light period) was similar to that observed in Scenario B after its 5-hour light exposure (Figs. 2A-F). This pattern supports previous findings that photoinhibition reaches saturation within approximately 1 hour of high light treatment (Hurry et al., 1992; Saccon et al., 2022). However, after the first dark period of Scenario A, the yields get less efficient as the light and dark cycles were repeated, ultimately leading to the highest accumulation of photoinhibition (Figs. 2A-C and 5A). This cumulative effect can be explained by metabolic lags such as the delayed activation of Calvin cycle at the onset of each light phase. Under these conditions, excess high light energy that cannot be efficiently processed by electron transport chain may instead promote the formation of ROS. ROS are known to inhibit the repair of D1 protein, a core component of PSII, thereby limiting recovery from photoinhibition (Takahashi and Murata, 2005, 2006). Furthermore, D1 and PSII repair processes require a substantial amount of adenosine triphosphate (ATP) (Murata et al., 2007; Murata and Nishiyama, 2018). During the dark period, ATP synthesis in chloroplasts is largely suppressed due to the absence of illumination, reducing the energy available to repair. Consequently, in Scenario A, the 1-hour dark intervals were insufficient to support effective photoinhibition recovery, leading to its accumulation across the repeated cycles.
Taken together, the results indicate that the stepwise diurnal light treatment (Scenario C) represents the most advantageous strategy. This finding is consistent with previous studies that diurnal light schedules with parabolic or sinusoidal trajectories promote more efficient photosynthetic response (Schiphorst et al., 2023; Stamford et al., 2024). When comparing constant, square type light scenarios with parabolic light scenarios, both light use efficiency and total carbon assimilation were substantially higher under parabolic light, largely due to more efficient usage of low irradiance periods and reduced inhibition of photosynthetic induction. Moreover, the distribution of lower PPFD across a longer photoperiod in Scenario C, relative to Scenarios A and B, likely facilitated greater electron transport (Elkins and van Iersel, 2020). In contrast, exposure to higher irradiance enhances both photoprotective mechanisms and photoinhibition, ultimately reducing the overall efficiency of photosynthesis. These measurements were conducted on a single leaf and therefore may not fully represent canopy- level photosynthesis. Unlike upper leaves that receive full illumination, shaded lower leaves can exhibit different overall photosynthetic efficiencies. Hence, future studies are needed to investigate canopy-level dynamic light responses, including both upper and lower leaves, to better understand the integrated photosynthetic behavior under varying light conditions.
This study demonstrates that photosynthetic responses in lettuce vary across different dynamic light scenarios and plant ages. Alternating light cycles imposed the highest photoinhibitory burden, while prolonged high light with recovery provided intermediate protection. Sinusoidal transitions offered the most effective balance between photoprotection and productivity, consistent with their superior electron transport rates. Fine-grained transitions alleviated photoinhibition but were limited by reduced daily light supply. Importantly, photosynthetic and photoprotective capacities were strongly age-dependent: younger leaves engaged higher NPQ and maintained higher qPd during illumination, yet experienced larger declines in Fv/Fm after treatment. Moreover, qPd and Fv/Fm provided distinct but complementary perspectives, with qPd reflecting real-time photoprotective capacity and Fv/Fm capturing residual cumulative damage. Together, these results highlight the importance of considering both light scenario and plant age when evaluating temporal photosynthetic responses. Such insights can be applied to the design of dynamic lighting strategies that enhance light-use efficiency by aligning energy dissipation and recovery processes with photosynthetic demand, thereby contributing to a pathway toward more energy-efficient and sustainable vertical farming systems.
