

Introduction
Materials and Methods
1. Plant materials and research site
2. Weather and growth data collection
3. Growth and yield investigation
4. Simple model
5. Model performance evaluation and comparative analysis
Results and Discussion
1. Analysis of pepper growth according to cultivation environment
2. Comparative performance evaluation
Conclusion
Introduction
In South Korea, chili peppers have grown from an ordinary vegetable crop to a culturally and economically significant agricultural product (Lim et al. 2024). Domestic chili pepper production presented 68,074 tons in 2024, representing a 10.4% increase compared to the previous year’s output of 61,665 tons (KOSIS 2024). Despite a 2.6% reduction in cultivation area (26,430 ha), production rose due to improved yield, which increased by 13.3% to 258 kg/10a. This was attributed to suitable weather during the flowering and fruiting period, including reduced rainfall (467 mm, a reduction of 42.1%) and increased solar radiation duration (388 hours, an increase of 12.9%), which led to lower pest and disease incidence a damage rate of 22.0% was recorded, indicating a reduction from the previous rate of 36.6% (KOSIS 2024).
Climate change poses a direct and serious threat to chili pepper production (Lee et al. 2018; Khaitov et al. 2019; Fahad et al. 2017). According to a study by Lee et al. (2018) and Han et al. (2023) under the climate change scenario representative concentration pathway (RCP) 8.5, temperature increase of 6°C, CO2 concentration of 940 ppm, and a 20.4% increase in precipitation, the yield of marketable chili peppers is projected to decrease by 89% (Park et al. 2015). This is primarily due to increased flower drop and reduced fruit quality caused by high temperatures, with a significant decrease in fruit set and fruit size observed when the average temperature exceeds 22-26°C (Pagamas and Nawata 2008; Mares-Quinones and Valiente-Banuet 2019). Recent changes in weather patterns clearly demonstrate that the impacts of climate change are already becoming a reality (Luck et al. 2011; Jung et al. 2024). South Korea is predominantly influenced by the East Asian monsoon regime, resulting in a distinct seasonal precipitation pattern in which 60-70% of the annual rainfall occurs during the summer months (Woo et al. 2025). This concentration renders the country particularly vulnerable to extreme precipitation events and their associated impacts (Kim et al. 2025). Moreover, the increasing frequency and intensity of such extreme weather events have reached a level where traditional cultivation practices and empirical decision- making are becoming increasingly inadequate (Dai 2025).
In the era of climate change, the use of crop growth prediction models is recognized as a key tool for establishing adaptation strategies in the agricultural sector. In chili peppers, which are highly sensitive to weather conditions, accurate growth prediction enables the scientific establishment of adaptation measures such as adjusting planting times, selecting varieties, and relocating cultivation areas. In particular, prediction models based on growing degree days have demonstrated practical results, such as predicting chili pepper yields at 1,387 kg/10a by 112 days after planting.
Process-based crop models have evolved into tools that predict crop responses to environmental changes by mathematically modeling physiological processes such as photosynthesis, respiration, and biomass distribution (Mäkelä et al. 2000; Challinor et al. 2004; Fatichi et al. 2016). Subsequently, modules for photosynthetic efficiency and CO2 effects were added, enabling its application in climate change research (White et al. 2012; Kareya et al. 2020). Since the introduction of DSSAT in the 1990s, process-based crop models have increasingly incorporated interactions among crop physiology, soil properties, and atmospheric conditions, enabling more comprehensive assessments of climate change impacts on agricultural systems (Jones et al. 2003; Abayechaw 2021).
The SIMPLE model was developed as a universal crop model applicable to various crops using only 13 parameters (Zhao et al. 2019). This model simplifies complex physiological processes to enable rapid predictions and has the advantage of requiring only generally available meteorological data (daily maximum/minimum temperatures, precipitation, solar radiation), crop management information, and soil moisture content parameters as input data. The model structure consists of a growth stage module based on growth degree temperature, a growth module based on the concept of radiative use efficiency, and a yield estimation module using the harvest index. In particular, the effects of temperature, high-temperature stress, drought stress, and CO2 concentration changes on biomass accumulation are expressed as independent functions, enabling effective simulation of crop responses under climate change scenarios. However, the simple generic crop model (SIMPLE) has several limitations due to its simplification. It does not consider the developmental responses to vernalization or photoperiod, and the absence of nutrient dynamics limits its application in low-input agricultural systems. Additionally, the assumption of a fixed harvest index may show limitations under late drought conditions, and frost and pest damage are not considered. This study was conducted to evaluate the applicability of the SIMPLE model to chili pepper cultivation systems and to analyze growth characteristics under varying environmental conditions. The research focused on directly comparing growth prediction performance across different varieties and cultivation sites, and quantitatively evaluating the model’s parameter sensitivity and uncertainty to propose appropriate utilization strategies. The research results are expected to serve as core foundational data for the development of climate change adaptation agricultural technologies and the sustainable development of the chili pepper industry, and further contribute significantly to the development of Korean-type crop models and the construction of agricultural decision-support systems.
Materials and Methods
This study investigated the growth characteristics and yield of five chili pepper farms (two in Andong and three in Yeongyang) located in the main chili pepper-producing areas of Andong City and Yeongyang County, Gyeongbuk Province, in 2024, as well as one research institution (Yeongyang Chili Pepper Research Institute of the Agricultural Technology Institute). The purpose was to examine the growth characteristics and yield of both existing and new varieties and to compare the results with predictions from the SIMPLE crop model. Adaptive cultivars were defined as those exhibiting stable yield performance under moderate stress conditions through efficient resource use, while resilience cultivars were defined as those capable of rapid recovery and maintaining productivity following acute stress events.
1. Plant materials and research site
This study was conducted at six chili pepper production sites in the areas of Andong City and Yeongyang County, Gyeongsangbuk-do (Table 1). The Andong region (Sites A and B) included two farm plots in the Junggaguri area of Waryong-myeon, with coordinates of 36.36°N, 128.47°E, an elevation of 270 m, and sandy loam soil conditions. The Yeongyang region (Sites C to F) consisted of four sites: Jukgok-ri, Ilwol-myeon (36.43°N, 129.50°E, 290 m), Dogok-ri, Ilwol-myeon (36.44°N, 129.50°E, 310 m), Yeongyang-eup (36.38°N, 129.11°E, 310 m), and the Yeongyang Pepper Research Institute of the Agricultural Technology Institute (36.38°N, 129.80°E, 232 m). A total of seven varieties were tested, including two existing varieties, Tanjeo Baksa (TB) and Tanjeo N (TN), and five new varieties, Kaltan Baksa (KB), Baikalla (BK), Sanglok (SL), Kalatan (KT), and Kaltan Yeolpoong (KY). At each experimental site, one adaptive cultivar and one resilient cultivar were selected in pairs, considering performance under climate stress conditions and regional cultivation practices, for comparative analysis. The experiment was designed using a randomized complete block design with three replications, with five plants per replication, totaling 15 plants. In farm plots, each farmer followed their conventional cultivation methods, while in the experimental plots at the Agricultural Research Institute’s Pepper Research Center, irrigation, fertilization, and pest management were conducted according to the National Institute of Agricultural Sciences' standard pepper cultivation guidelines.
Table 1
Distribution of experimental sites and cultivars used in Yeongyang and Andong
| No | Region | Site | Location information | Adaptive cultivar | Resilience cultivar |
| 1 | Andong | A | 36.61°N, 128.79°E, 280m | TB (Tanjeo Baksa) | KB (Kaltan Baksa) |
| 2 | B | 36.60°N, 128.78°E, 260m | TB (Tanjeo Baksa) | KB (Kaltan Baksa) | |
| 3 | Yeongyang | C | 36.43°N, 129.05°E, 300m | TB (Tanjeo Baksa) | KT (Kalatan) |
| 4 | D | 36.44°N, 129.05°E, 310m | TB (Tanjeo Baksa) | BK (Baikalla) | |
| 5 | E | 36.38°N, 129.11°E, 310m | TB (Tanjeo Baksa) | SL (Sanglok) | |
| 6 | Fz | 36.65°N, 128.15°E, 260m | TN (Tanjeo N) | KY (Kaltan Yeolpoong) |
Cultivar grouping into adaptive and resilience categories was established prior to the experiment based on breeder- provided performance data and existing trial records. Adaptive cultivars were defined as those exhibiting stable yield performance under moderate stress conditions through efficient resource use, while resilience cultivars were defined as those capable of rapid recovery and maintaining productivity following acute stress events. This classification was used as an a priori framework for comparative analysis and was not derived from the experimental results presented in this study.
2. Weather and growth data collection
Daily weather data for the five-year period from 2019 to 2023 were collected from automatic weather stations (AWS) operated by the Korea Meteorological Administration near each test site. The collected data include daily average temperature (°C), daily maximum and minimum temperatures (°C), daily temperature range (°C), daily precipitation (mm), daily solar radiation (MJ m-2), relative humidity (%), and wind speed (m s-1). To quantify the cumulative effect of temperature on chili pepper growth, Growing Degree Days (GDD) were used as the primary indicator. The calculation formula is as follows:
Here, Tbase is the reference temperature (15°C) for chili peppers (Zhu et al. 2024).
3. Growth and yield investigation
During the 2024 chili pepper growing season, five representative plants were selected from each experimental plot and surveyed in three replicates, totaling 15 plants. The measured growth parameters included plant height (cm), branch number (number per plant), leaf number (number per plant), leaf area index (LAI), dry biomass (g per plant), and yield (kg per 10a). Dry biomass was separated into leaves, stems, edible fruits (marketable fruits), and non-edible fruits (non-marketable fruits), then dried at 70°C for 72 hours before measurement. Yield was calculated by converting the total harvested quantity to a 10a basis. The survey was conducted four times in total after transplanting.
4. Simple model
The SIMPLE (System of Integrated Models for Production and Land use Evaluation; Zhao et al. 2019) crop model was implemented to simulate chili pepper growth and biomass accumulation. This process-based model utilizes 13 core parameters to simulate crop development, growth, and yield using daily meteorological inputs. The model was calibrated for Korean chili pepper varieties and climate conditions based on experimental data from the Andong and Yeongyang field sites. Species-specific parameters were established through a systematic calibration procedure accounting for regional differences in climate and cultivar performance, which revealed substantial parameter variation between the two sites, reflecting distinct genotype-by-environment interactions. Management inputs included site-specific transplanting and harvest dates, with irrigation scheduling reflecting typical farmer practices in each region. Initial conditions were set with zero biomass and cumulative temperature at transplanting.
The model was implemented and executed in Python (version 3.x) with daily time steps. The implementation was based on the open-source code developed by Moon (SNU GHPF Lab), following the model structure described by Zhao et al. (2019). Cultivar-specific parameters (T_sum, HI, I_50A, I_50B, T_opt, RUE) were calibrated against observed aboveground dry biomass using a two-stage random search algorithm: (1) a broad random sampling stage (n = 400 iterations) across the allowable parameter space, followed by (2) a local refinement stage (n = 200 iterations) within a narrowed neighborhood of the best candidate solution. The parameter set yielding the lowest RMSE across four measurement time points (DAT 87, 101, 116, and 132) was selected as the final calibrated parameter set. Calibration was performed separately for each site to account for location-specific genotype-by-environment interactions.
The original SIMPLE model (Zhao et al. 2019) does not include a mechanism for late-season biomass decline; net aboveground biomass accumulates monotonically until harvest, driven solely by radiation interception and stress multipliers. However, field observations consistently showed stagnation and decline of aboveground biomass beyond approximately 100 days after transplanting (DAT), attributed to leaf senescence and assimilate redistribution toward maturing fruits. The original SIMPLE model does not account for this late-season decline, resulting in systematic overestimation of biomass in the latter growth phase. To address this, a first-order decay term proportional to cumulative biomass was introduced into the daily biomass update equation:
where B_t is aboveground dry biomass at day t (g plant-1), ΔB_growth,t is the daily biomass increment calculated from the original SIMPLE growth function (radiation, temperature, CO2, and water stress multipliers), and K_decay is the daily fractional decay rate (day-1). The DAT = 100 threshold was determined empirically based on observed biomass trends across all experimental plots. K_decay was treated as an additional calibration parameter with an allowable range of 0.04-0.14 day-1.
In this study, the water stress function was not activated due to the absence of site-specific evapotranspiration and soil water balance data required to calculate the ARID index (ARID = 0 for all days). Consequently, the water stress multiplier f_Water was fixed at 1.0 throughout the simulation, and parameters related to drought stress (S_water, I_50 maxW) did not functionally contribute to model predictions. This limitation is acknowledged and discussed in Section 4.
5. Model performance evaluation and comparative analysis
Experimental data are presented as means ± standard deviations. One-way analysis of variance (ANOVA) followed by LSD (Least Significant Difference) test was used to identify significant differences among treatments (p < 0.05). Model predictive performance was assessed using the coefficient of determination (R2), root mean square error (RMSE), and mean absolute error (MAE). Performance was evaluated at three scales: (1) individual cultivar within each site, (2) cultivar group (adaptive vs. resilience), and (3) region (Andong vs. Yeongyang). Model robustness was assessed by examining prediction stability across varying environmental conditions and cultivar characteristics. Simulated outputs were compared with observed data for total, leaf, stem, and fruit biomass to evaluate component-level accuracy, and temporal dynamics of biomass accumulation were analyzed to assess the model's capacity to capture seasonal growth patterns and stress responses.
A one-at-a-time (OAT) sensitivity analysis was conducted for five key parameters (RUE, HI, T_sum, T_opt, I_50A) by perturbing each parameter by ±10% and ±20% from its calibrated value while holding all others constant (Fig. 6). The sensitivity index (SI), defined as the ratio of relative output change to relative parameter change, was calculated for final aboveground biomass and yield. RUE showed a proportional response (SI = 1.00) in both regions, confirming its direct linear influence on biomass accumulation. T_sum and I_50A exhibited markedly higher sensitivity in Andong (SI = 2.79 and 2.35, respectively) than in Yeongyang (SI = 0.03 and 0.06), indicating that Andong simulations operated in a parameter-sensitive regime where cumulative thermal time had not reached saturation by season end. HI had no effect on biomass (SI = 0) but showed a proportional effect on yield (SI = 1.00) in both regions, consistent with its role as a post-hoc partitioning coefficient.
Results and Discussion
1. Analysis of pepper growth according to cultivation environment
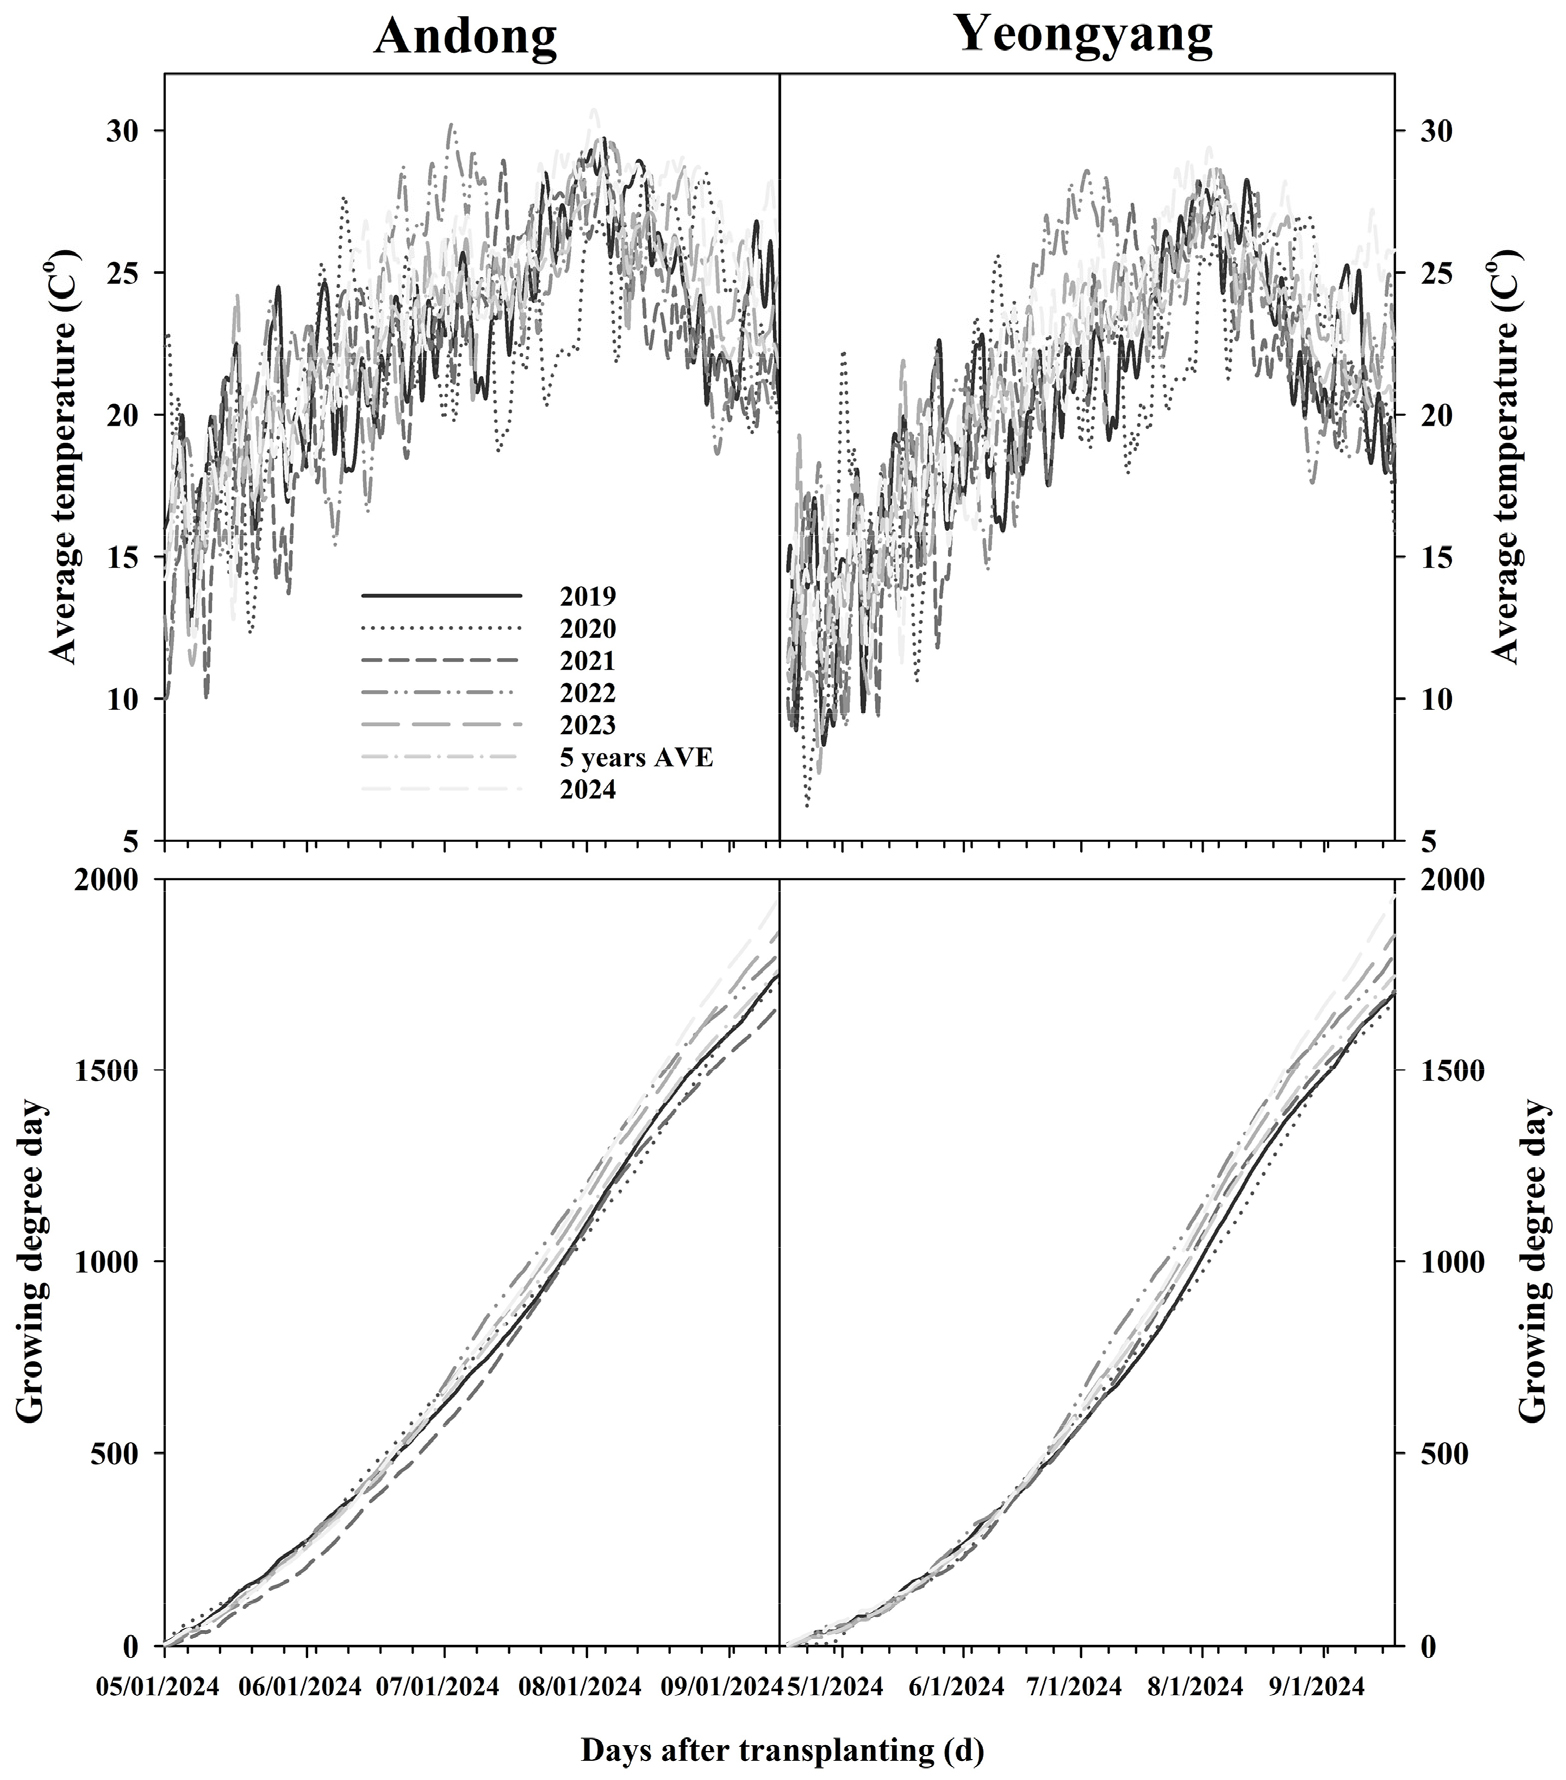
Temperature analysis from 2019-2023 revealed minimal climatic differences between cultivation sites (Fig. 1). Andong exhibited slightly higher average temperatures than Yeongyang, with both locations reaching approximately 1,800°C·day GDD by season end. Five-year averages indicated similar overall climatic conditions, suggesting that performance differences stem from micro-environmental factors rather than broad climatic disparities (Chen et al. 2021).
The adaptive cultivar group (TB, TN) exhibited compact canopy architecture with dense foliage and short internodes, whereas the resilience cultivar group (KB, KT, BK, SL, KY) displayed an open canopy structure with elongated internodes (Fig. 2). These morphological divergences reflect contrasting adaptation strategies, with adaptive cultivars allocating resources toward stress tolerance and resilience cultivars prioritizing rapid growth and recovery capacity (Singh 2013; Benitez-Alfonso et al. 2023).
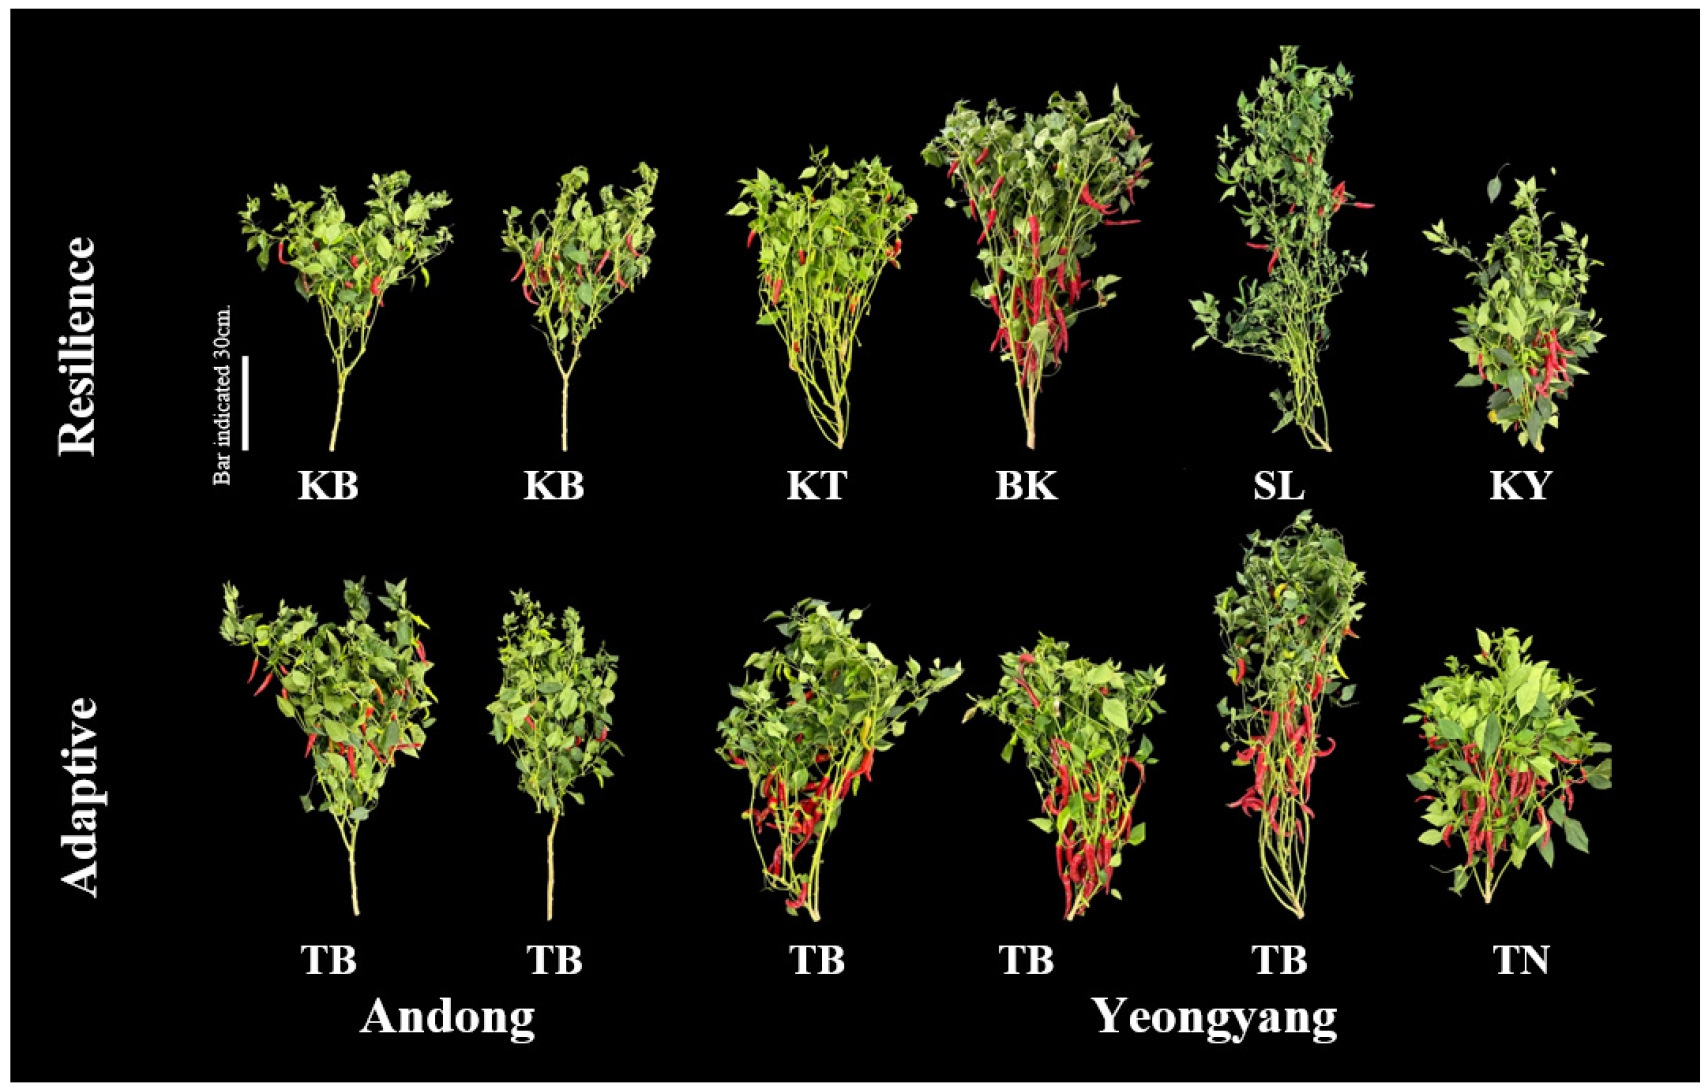
Fig. 2
Visual comparison of adaptive and resilience hot pepper cultivars grown in Andong and Yeongyang. Photographs of representative plants from adaptive and resilience cultivar groups cultivated in Andong (left) and Yeongyang (right). Cultivar codes: TB (Tanjeo Baksa), KB (Kaltan Baksa), KT (Kaltan), BK (Baikalla), SL (Sanglok), KY (Kaltan Yeolpoong), and TN (Tanjeo N). A 30 cm scale bar is shown for size reference
Comparative analysis of growth and yield characteristics between cultivar groups in Andong and Yeongyang revealed distinct regional differences (Tables 2 and 3). In both regions, adaptive cultivars exhibited significantly greater plant height than resilience types; however, leaf area index (LAI) was higher in adaptive types in Andong but higher in resilience types in Yeongyang, indicating divergent light interception strategies. Branch number showed no significant difference in Andong but was significantly higher in adaptive types in Yeongyang. Dry weight analysis demonstrated region-dependent differences in vegetative biomass: in Andong, resilience cultivars showed greater leaf and stem dry weight, whereas in Yeongyang, adaptive cultivars tended to maintain higher vegetative biomass; marked regional differences also emerged during the reproductive phase. In Andong, adaptive types showed greater immature fruit dry weight, yet no differences were observed in mature fruit dry weight or final yield. Conversely, in Yeongyang, both mature fruit dry weight and final yield were significantly higher in adaptive types. These findings indicate that the capacity of adaptive cultivars to convert vegetative advantages into reproductive output varies regionally, with resilience types achieving comparable productivity in Andong but lower conversion efficiency in Yeongyang (Pagamas and Nawata 2008; Chen et al. 2021; Zakir et al. 2024).
Table 2
Comparison of growth and yield data by cultivar in the pepper production region (Andong)
| Cultivar | Plant height (cm) | No. of branching | No. of leaves | Leaf area index | Yield (kg/10a) | Dry weight (g) | |||
| Leaf | Stem | Immature | Mature | ||||||
| Resiliencez | 98.3 | 121.5 | 432.3 | 3.0 | 99.6 | 24.4 | 35.6 | 26.2 | 17.3 |
| Adaptive | 107.5 | 121.9 | 378.2 | 3.6 | 114.6 | 30.1 | 60.5 | 45.0 | 18.9 |
| Significancey | *** | NS | * | *** | NS | *** | *** | *** | NS |
Table 3
Comparison of growth and yield data by cultivar in the pepper production region (Yeongyang)
| Cultivar |
Plant height (cm) |
No. of branching |
No. of leaves |
Leaf area index |
Yield (kg/10a) | Dry weight (g) | |||
| Leaf | Stem | Immature | Mature | ||||||
| Resiliencez | 99.6 | 168.3 | 533.6 | 5.5 | 327.6 | 42.0 | 57.5 | 59.2 | 55.8 |
| Adaptive | 106.5 | 180.3 | 540.7 | 4.9 | 421.3 | 41.8 | 68.6 | 55.8 | 67.8 |
| Significancey | *** | *** | NS | *** | *** | NS | *** | NS | *** |
Growth dynamics across GDD accumulation stages (Figs. 3 and 4) were consistent with these patterns. In Andong, resilience cultivars showed greater leaf (LSD0.05 = 4.78) and stem dry weight (LSD0.05 = 8.66), indicating higher vegetative biomass accumulation. Green fruit dry weight (LSD0.05 = 20.29) peaked at intermediate GDD (1,200-1,400°C·day) in resilience cultivars and at higher GDD in adaptive cultivars, reflecting differential fruit development timing. In Yeongyang, resilience cultivars maintained greater leaf dry weight at high GDD (LSD0.05 = 12.01), while stem dry weight (LSD0.05 = 10.07) was more stable in resilience cultivars but more variable in adaptive types. Green fruit dry weight (LSD0.05 = 10.80) peaked earlier and declined rapidly in adaptive cultivars, whereas resilience cultivars maintained more stable productivity. Mature fruit dry weight (LSD0.05 = 14.15) exhibited complex temporal fluctuations in both groups, likely reflecting microenvironmental influences.
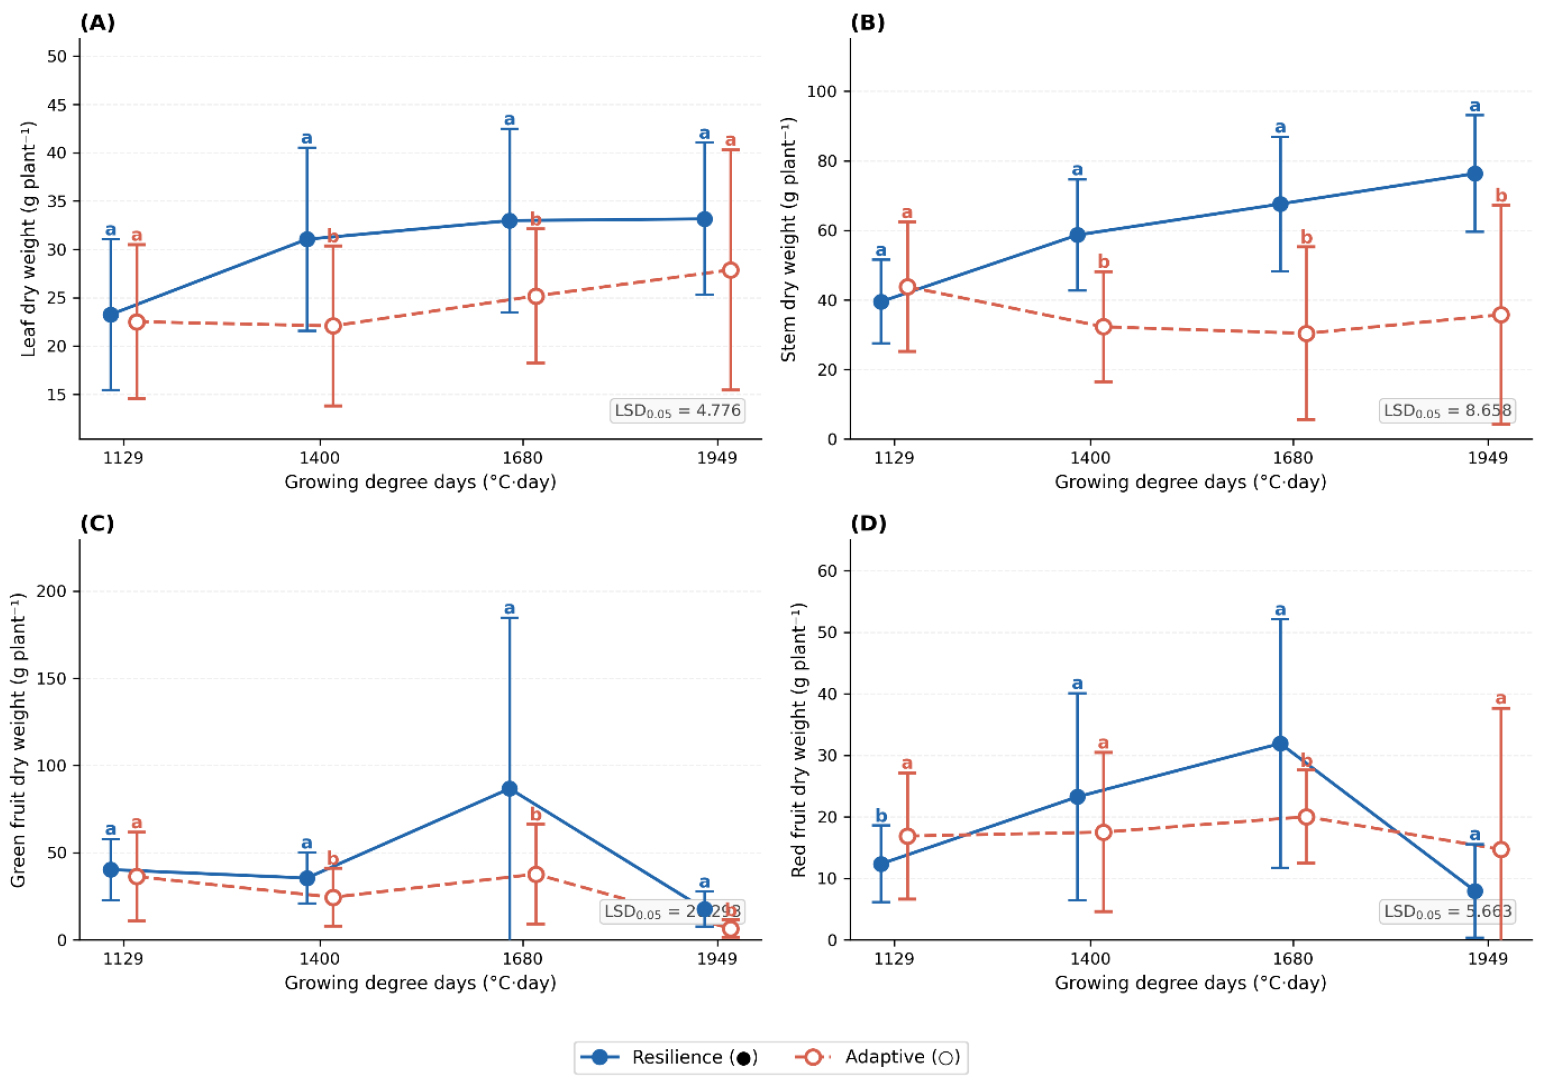
Fig. 3
Growth parameter responses of adaptive and resilience hot pepper cultivars grown in Andong across growing degree days. (A) Leaf dry weight, (B) stem dry weight, (C) green fruit dry weight, and (D) red fruit dry weight measured at different growing degree days for resilience (●) and adaptive (○) cultivar groups cultivated in Andong. Statistical significance was determined using LSD test (P < 0.05). Different letters indicate significant differences between treatments
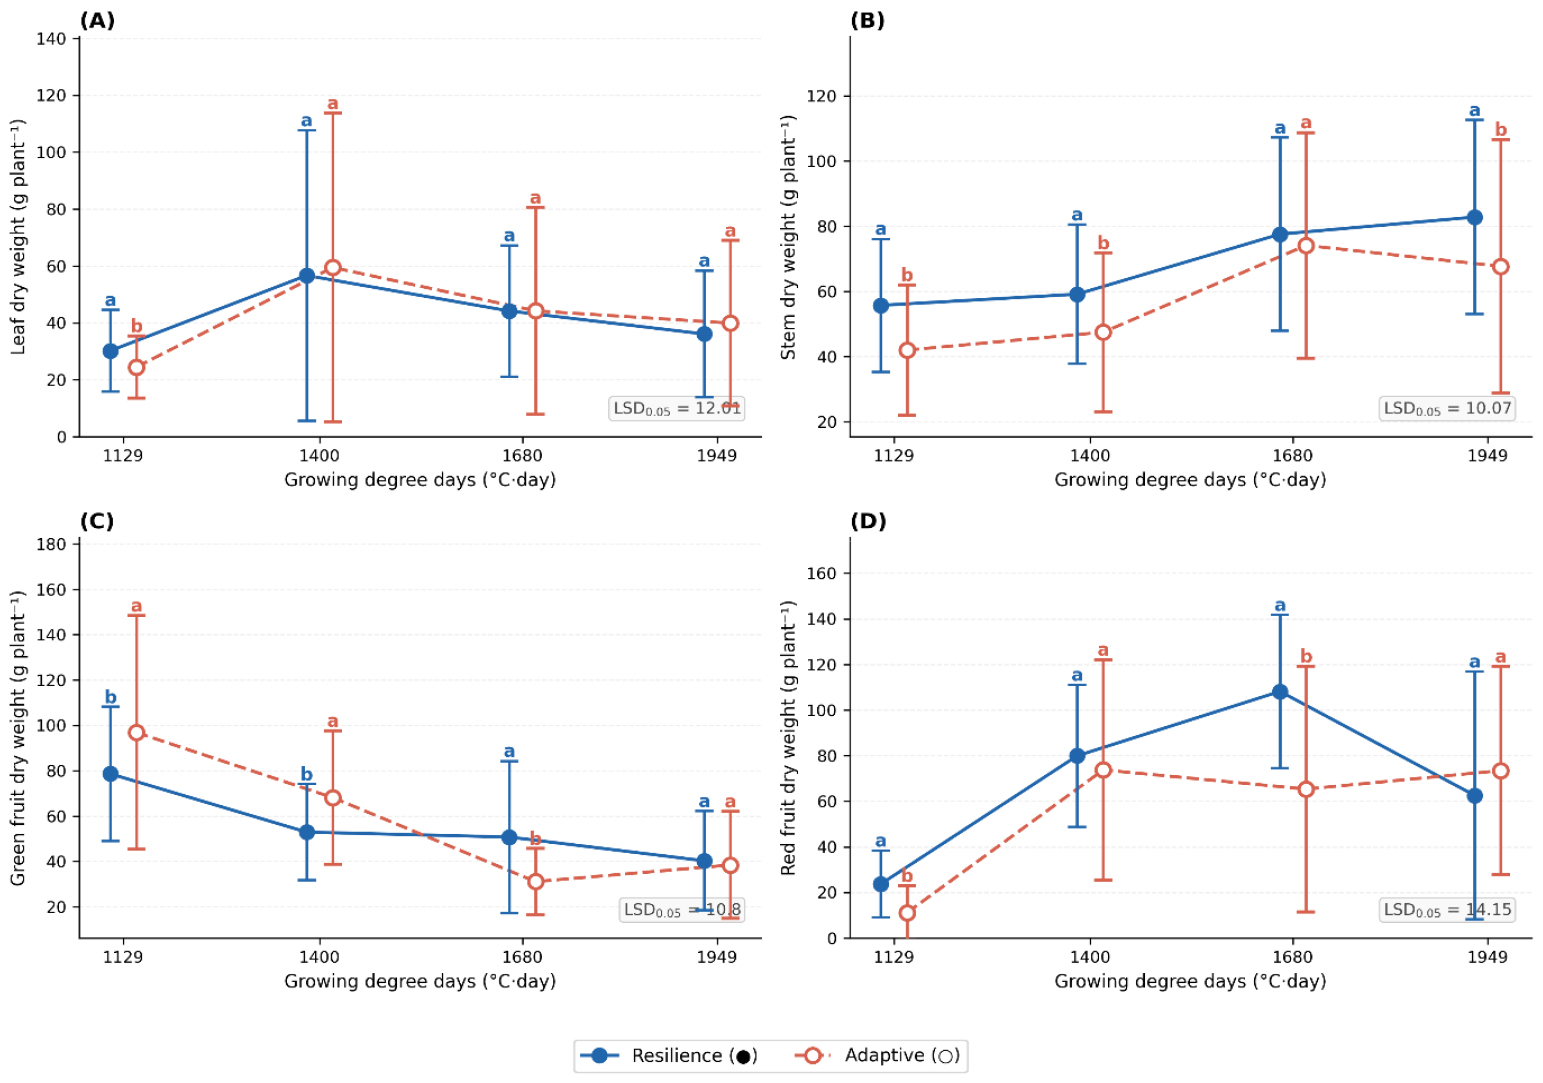
Fig. 4
Growth parameter responses of adaptive and resilience hot pepper cultivars grown in Yeongyang across growing degree days. (A) Leaf dry weight, (B) stem dry weight, (C) green fruit dry weight, and (D) red fruit dry weight measured at different growing degree days for resilience (●) and adaptive (○) cultivar groups cultivated in Yeongyang. Statistical significance was determined using LSD test (P < 0.05). Different letters indicate significant differences between treatments.
Correlation patterns differed between locations (Fig. 5). In Andong, resilience cultivars showed stronger correlations between vegetative and reproductive traits, while adaptive cultivars displayed more independent trait expression. In Yeongyang, adaptive cultivars demonstrated stronger trait integration compared to Andong, suggesting greater sensitivity to environmental variation (Rejeb et al. 2014). Collectively, these findings indicate distinct adaptation strategies: resilience cultivars maintained consistent performance across environments with stable growth patterns and trait correlations, implying robust buffering mechanisms, whereas adaptive cultivars exhibited greater variability and higher phenotypic plasticity, which may be advantageous under specific environmental conditions (Choudhury et al. 2017).
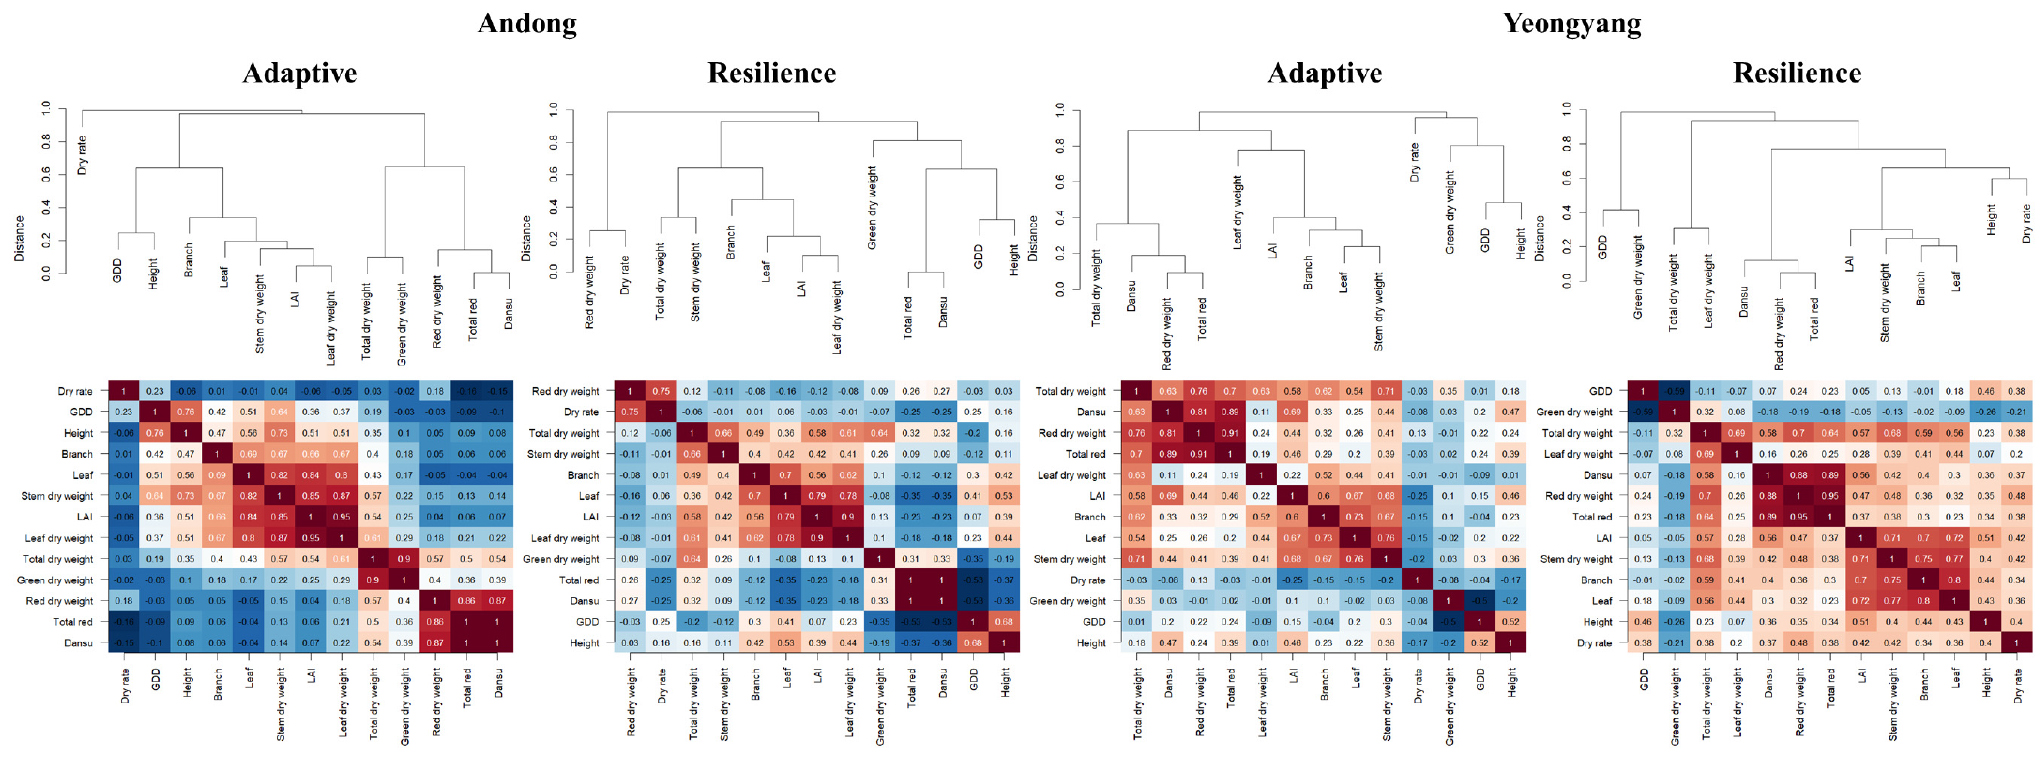
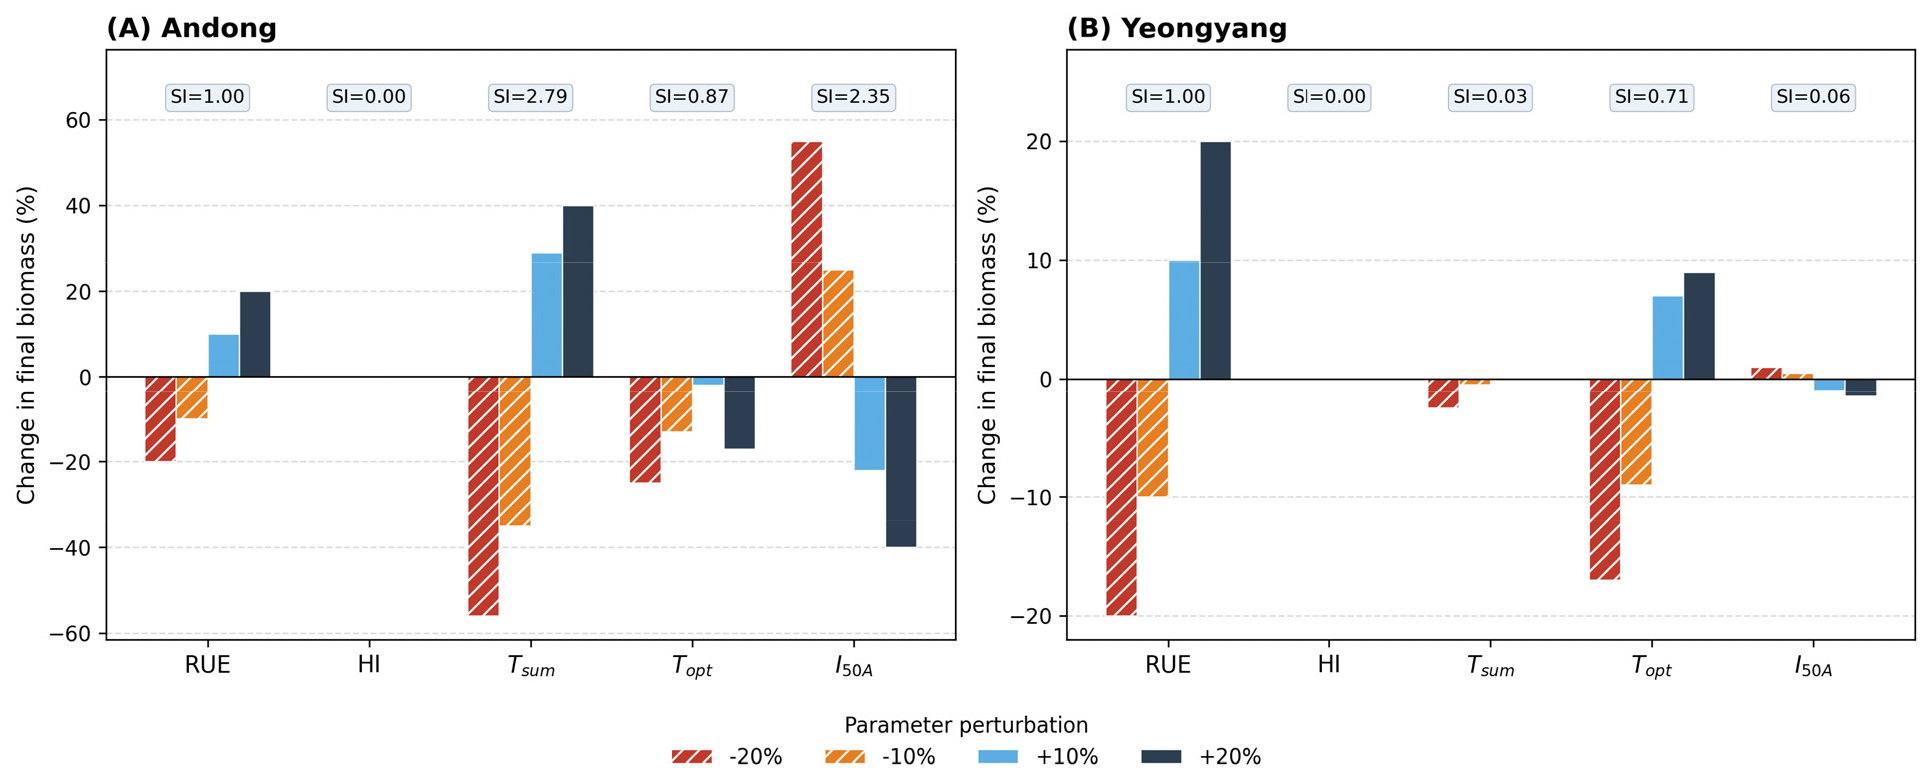
Fig. 6
One-at-a-time sensitivity analysis of the SIMPLE crop model for five key parameters (RUE, HI, T_sum, T_opt, I_50A) at Andong (A) and Yeongyang (B). Bars represent the percentage change in final aboveground dry biomass relative to the baseline simulation when each parameter was perturbed by ±10% and ±20%. Numbers above each parameter group indicate the mean sensitivity index (SI = |ΔBiomass%| / |ΔParam%| averaged over four perturbation levels)
2. Comparative performance evaluation
The SIMPLE crop growth model (Zhao et al. 2019) was implemented in Python with minimal modifications to reflect the growth patterns of hot pepper (Capsicum annuum L.) under open-field conditions in Korea. Field observations repeatedly confirmed intervals of biomass stagnation and decline around 100 days after transplanting (DAT), attributed to leaf senescence, fruit maturation, and assimilate redistribution. The original model failed to capture this late-season phenomenon, systematically overestimating biomass in the latter growth phase. To address this, a first-order decay term proportional to cumulative biomass was incorporated into the daily growth equation, whereby decay is subtracted from net growth beyond DAT = 100. This modification substantially improved agreement between simulated and observed biomass trajectories within the present dataset while maintaining numerical stability. Whether this improvement generalizes across seasons, sites, or cultivars remains to be assessed through multi-year cross-validation.
Calibration using field data from Andong and Yeongyang yielded distinct parameter sets for the two regions (Table 4). Several calibrated values fell outside the allowable ranges defined in Table 4 — notably T_sum (Andong: 1,489 vs. lower bound 1,600°C·day), HI (0.54-0.62 vs. upper bound 0.35), T_ext (Andong: 34.18 vs. lower bound 44°C), and T_max (31.33-31.79°C vs. lower bound 32°C). These deviations arose during optimization and reflect the tendency of parsimonious models to compensate for structural deficiencies through parameter adjustment. In particular, the elevated HI values likely compensate for the model’s inability to simulate assimilate partitioning dynamics explicitly, while the anomalously low T_ext for Andong may reflect compensatory absorption of unmodeled heat-stress effects. These parameter estimates should therefore be regarded as site-specific empirical fitting coefficients rather than biologically meaningful cultivar constants, and caution is warranted when extrapolating them to other environments or seasons. Furthermore, since the water stress function was not activated (ARID = 0 throughout), drought-related parameters (S_water, I50maxW) listed in Table 4 did not functionally contribute to model predictions and should not be interpreted as calibrated physiological estimates.
Table 4
SIMPLE model parameters for chili pepper: literature ranges, allowable calibration bounds, and regional (Andong/Yeongyang) estimates
| Symbol | Parameter | Unit | Literature values / range |
Allowable range for c alibration | Andong | Yeongyang |
| Tsum | Cumulative temperature requirement from sowing to maturity | °C·day |
1,600-6,600 (crop-dependent; e.g., tomato 2,300-2,800; wheat 2,150-2,200; banana 6,600) |
Crop-specific prior ±20% | 1489.945z | 2498.792 |
| HI | Potential harvest index | - |
0.19-0.90 (crop-dependent; e.g., tomato 0.50-0.68; potato 0.45-0.90) |
0.15-0.35 for chili-like fruit crops (adjust if justified) | 0.54z | 0.62z |
| I50A | Cumulative temperature requirement for leaf area development to intercept 50% of radiation | °C·day |
280-850 (e.g., wheat 280-480; rice 850; tomato 520-550) | 100-900 | 484.08 | 427.02 |
| I50B | Cumulative temperature till maturity to reach 50% radiation interception due to leaf senescence | °C·day |
50-600 (e.g., wheat 50-200; tomato 300-400) | 50-700 | 357.47 | 83.2345 |
| Tbase | Base temperature for phenology development and growth | °C |
0-12 across 14 crops (e.g., tomato 6, maize 8, peanut 10) |
10-18 (1 °C steps) for chili calibration | 15 | 15 |
| Topt | Optimal temperature for biomass growth | °C |
15-28 (e.g., tomato 26; maize 28; potato 22) | 25-32 | 25 | 22.73z |
| RUE | Radiation use efficiency (aboveground only and without respiration) | g MJ-1 m-2 |
0.80-2.10 (e.g., tomato 1.00; maize 2.10) |
1.5-3.5 (fruit/veg), crop-specific | 2.05 | 1.60 |
| I50maxH | The maximum daily reduction in I50B due to heat stress | °C·day | 40-120 | 40-150 | 105 | 55.21 |
| I50maxW | The maximum daily reduction in I50B due to drought stress | °C·day | 5-30 | 0-40 | 2.35 | 10.79 |
| Tmax | Threshold temperature to start accelerating senescence from heat stress | °C |
32-38 (most crops 32-36; cassava 38) | 32-40 | 31.33z | 31.79z |
| Text | The extreme temperature threshold when RUE becomes 0 due to heat stress | °C | 45-50 | 44-50 | 34.18z | 45.48 |
| SCO2 | Relative increase in RUE per ppm elevated CO2 above 350 ppm | (ppm-1) | 0.01-0.10 (lower for C4) | 0-0.10 | 0.096 | 0.075 |
| Swater | Sensitivity of RUE (or harvest index) to drought stress (ARID index) | - | 0.4-2.5 | 0.4-2.5 | 1.90 | 0.820 |
| AWC | Fraction of plant available water-holding capacity (in considered soil bucket) | - |
0.05-0.25 (site-dependent; e.g., 0.05 peanut; 0.25 sweetcorn) | 0.08-0.20 typical | 0.12 | 0.12 |
| RCN | Runoff curve number | - | 60-85 (site-dependent) | 60-85 | 70 | 70 |
| DDC | Deep drainage coefficient | - |
0.1-0.8 (site-dependent; commonly 0.3-0.7) | 0.2-0.6 typical | 0.4 | 0.4 |
| RZD | Active main root zone depth | mm | 300-2200 (crop/site-dependent) |
400-800 typical for chili fields | 800 | 800 |
These regional differences should not be interpreted as cultivar-specific physiological traits. Since the same cultivar (TB, Tanjeo Baksa) was deployed across both regions and calibrated independently, the divergence in estimated parameters — including RUE, T_opt, and heat tolerance indices — reflects the combined effect of genotype-by-environment interaction and structural limitations of the SIMPLE model. In particular, the water stress function (f_Water) was not activated in this study (ARID = 0), and the model lacks an energy balance component to estimate canopy temperature from air temperature. Consequently, differences in soil moisture regime and microclimate between sites — which would alter actual plant temperature and drought stress exposure — were instead absorbed into the calibrated parameter values. This phenomenon, known as equifinality, means that multiple parameter combinations can yield similarly adequate fits to observed data, limiting the physiological interpretability of individual parameter estimates (Beven and Binley 1992). The Andong calibration resulted in higher RUE and lower heat tolerance thresholds, while Yeongyang showed lower RUE, higher heat tolerance, and elevated harvest index; these contrasts are better interpreted as region-specific compensatory fits rather than true cultivar differences. Senescence-related parameters in Yeongyang indicated earlier onset of photosynthetic decline, potentially limiting overall production potential.
During validation, model performance varied considerably across site-cultivar combinations. For the Andong Site A-KB (Kaltan Baksa) combination, the reported R2 = 1.000 and RMSE = 0.0 g plant⁻¹ reflect a calibration-only result: no independent validation data were available for this specific combination, and the perfect fit indicates calibration match rather than predictive capacity, and should be interpreted with caution. For all other combinations, calibration and evaluation were conducted on data from different measurement time points within the same growing season. Some combinations yielded high R2 and low error values, while others showed low or negative explanatory power, indicating structural mismatches (Table 5). Even within the same region, microenvironmental factors such as soil moisture regime, microtopography, and management practices substantially contributed to performance variability. No consistent performance gap was observed between cultivar groups (adaptive vs. resilience types), indicating that prediction difficulty is governed by the interaction between cultivar traits — particularly senescence onset timing and thermal-water responses — and field environmental conditions. Thus, while the decay term is essential for reproducing late-season trends, its activation timing and magnitude require recalibration according to region, cultivar, and environment.
Table 5
Prediction performance of the SIMPLE model (R2, RMSE, MAE) for adaptive and resilience hot pepper cultivars at Andong and Yeongyang sites by region and plot
| Region | Site | Cultivar group | Cultivar | R2 |
RMSE (g/plant) |
MAE (g/plant) |
| Andong | A | Adaptive | TB (Tanjeo Baksa) | 0.267 | 62.9 | 47.0 |
| Resilience | KB (Kaltan Baksa)z | 1.000 | 0.0 | 0.0 | ||
| B | Adaptive | TB (Tanjeo Baksa) | 0.977 | 1.9 | 1.6 | |
| Resilience | KB (Kaltan Baksa) | 0.965 | 2.3 | 2.1 | ||
| Yeongyang | C | Adaptive | TB (Tanjeo Baksa) | 0.846 | 24.8 | 19.7 |
| Resilience | KT (Kalatan) | 0.616 | 24.8 | 21.0 | ||
| D | Adaptive | TB (Tanjeo Baksa) | 0.743 | 21.8 | 18.8 | |
| Resilience | SL (Sanglok) | 0.762 | 13.6 | 12.8 | ||
| E | Adaptive | TB (Tanjeo Baksa) | 0.315 | 40.1 | 35.0 | |
| Resilience | BK (Baikalla) | 0.822 | 21.4 | 18.6 | ||
| F | Adaptive | TN (Tanjeo N) | 0.949 | 10.4 | 9.2 | |
| Resilience | KY (Kaltan Yeolpoong) | 0.953 | 10.6 | 9.9 |
Agronomic implications suggest that Andong-type systems (rapid early growth, high radiation use efficiency, low heat tolerance) would benefit from heat avoidance strategies such as planting date adjustment, shading, and microclimate modification. Yeongyang-type systems (gradual growth, high heat tolerance, elevated harvest index) could achieve yield stabilization through optimization of the light environment and management interventions that delay senescence. From a modeling perspective, the contrasting effective thermal times, radiation use efficiencies, and senescence parameters across regions preclude application of a single parameter set; stratified calibration at the regional or field scale is necessary at minimum.
Several limitations warrant consideration. First, the decay term represents an empirical approximation: biomass decline is triggered at a fixed DAT = 100 threshold with a constant fractional rate K_decay, irrespective of cultivar identity, environmental stress level, or developmental stage. While this modification improved average fit to late-season observations, it does not reflect the underlying physiological drivers of senescence. A more mechanistically sound approach would link senescence rate to soil water deficit, accumulated heat stress, or phenological stage, rather than elapsed time alone. The absence of an energy balance component means that canopy temperature — a primary driver of heat-induced senescence — cannot be estimated from meteorological inputs, limiting the model's capacity to simulate environment-specific senescence dynamics. Second, the water stress module was effectively inactive (ARID = 0), which may have caused the decay term to partially compensate for unmodeled drought stress effects. Future work should prioritize integration of a physically based soil water balance and energy balance module before further refinement of the senescence submodel. Process-based models with more explicit organ- level carbon balance and senescence routines, such as WOFOST (van Diepen et al. 1989), may offer a more appropriate framework for capturing the complexity of pepper growth dynamics under diverse Korean field conditions. The choice of SIMPLE was motivated by its minimal data requirements and computational simplicity; however, these advantages come at the cost of structural limitations that become apparent under late-season stress and across heterogeneous environments. Future refinements should link decay activation to developmental stage or accumulated thermal time, connect decay intensity to environmental stressors, and, if necessary, extend the framework to organ-specific decay. Additional challenges include the empirical nature of water and heat stress functions and the omission of constraints related to pests, diseases, nutrient disorders, and reproductive processes such as fruit set, expansion, and abscission. The modified SIMPLE model more realistically captures late-season biomass decline and improves average predictive capacity; however, failure cases persist under extreme stress or high microenvironmental heterogeneity. Future research should strengthen linkages between environmental and physiological processes through improved senescence modules, hierarchical calibration across region-field-cultivar scales, integration of physically based hydrological and thermal modules, and multi-year, multi-site cross-validation.
Conclusion
This study incorporated a first-order decay term into the SIMPLE crop model to capture late-season biomass decline in Korean chili pepper production, improving predictive performance and reducing overestimation while maintaining numerical stability. Calibration revealed distinct regional parameter sets: Andong was characterized by lower thermal time to maturity, higher radiation use efficiency, and greater heat sensitivity, whereas Yeongyang exhibited higher thermal requirements, lower radiation use efficiency, better heat tolerance, and a higher harvest index. These contrasts demonstrate that a single generic parameter set is inadequate across environmentally differing production regions. Performance varied substantially across site-cultivar combinations, with some cases showing clear predictive failure. Inconsistencies between calibrated parameter values and their allowable physiological ranges likely reflect compensatory calibration rather than genuine cultivar-specific responses. The current model is therefore best regarded as a tool for exploratory diagnosis and local calibration rather than broad predictive application, particularly under extreme weather conditions.
From a management perspective, heat-avoidance strategies — such as planting date adjustment, shading, and microclimate modification — are most relevant for Andong-type systems, while optimization of the light environment and management interventions that delay senescence onset are more applicable for Yeongyang-type systems. Future model development should: (i) link decay activation to phenological stage or accumulated thermal time, and connect decay intensity to environmental stress drivers; (ii) implement hierarchical calibration with physiologically informed prior distributions; (iii) integrate physically based soil water balance and energy balance components; and (iv) conduct multi-year, multi-site cross-validation to assess transferability. The SIMPLE model was selected in this study for its minimal input requirements and broad crop applicability; however, the structural limitations identified — particularly the absence of an energy balance module and mechanistic soil water dynamics — suggest that models with greater physiological detail, such as WOFOST (van Diepen et al. 1989), warrant evaluation for pepper production systems in Korea where soil moisture variability and microclimate heterogeneity are pronounced. Addressing these structural and validation gaps is necessary for the decay-enhanced SIMPLE model to serve as a reliable decision-support tool for diverse Korean chili pepper production systems.
