


Introduction
Materials and Methods
1. Experimental site and design
2. Soil physical properties
3. Soil chemical properties
4. Plant growth evaluation
5. Statistical analysis
Results and Discussion
1. Changes in soil physical properties
2. Changes in soil chemical properties
3. Growth and yield of summer squash
Conclusion
Introduction
Greenhouse soil cultivation has become an essential production system to meet the year-round demand for high- value horticultural crops. However, unlike open-field cultivation where rainfall facilitates the leaching of excess salts, greenhouse soils are prone to salinity build-up due to limited water exchange and intensive fertigation practices (Blanco and Folegatti 2002). Salt accumulation not only alters soil structure and water dynamics through surface crusting but also reduces nutrient availability and root function, ultimately limiting crop productivity (Ondrasek et al. 2011). Furthermore, continuous monocropping in greenhouse soils aggravates these problems by favoring the proliferation of soil-borne pathogens, thereby increasing the risk of yield decline. These challenges highlight the importance of developing sustainable soil management strategies tailored to greenhouse systems (Huang et al. 2013).
Summer squash (Cucurbita moschata D.) is an economically important vegetable crop characterized by rapid growth, continuous fruiting, and high market value, and it is widely used in Korean culinary culture. Compared to zucchini squash, summer squash has firmer flesh, allowing it to better retain its shape during cooking processes such as stews and pancakes (Park et al. 2010). In 2020, the cultivation area of summer squash in Korea was 593.3 ha, of which 228.1 ha were under greenhouse production (KOSIS 2020). However, long-term greenhouse cultivation often leads to soil-related problems such as salt accumulation, nutrient imbalance, and compaction, which jeopardize the growth and productivity of indeterminate crops (Katerji et al. 1998; Carvajal et al. 1999; Adriansyah and Kusmiyati 2020). These unfavorable soil conditions can restrict vegetative growth and fruit set, ultimately reducing yield and quality. Therefore, appropriate management strategies are essential for improving soil environments, thereby ensuring stable and sustainable production of summer squash.
Soil comprises three phases (solid, liquid, and gaseous) and their balance governs soil structure, aeration, and water availability (Wang et al. 2015). Disturbance of this balance, often caused by salinization or compaction, reduces soil productivity and crop growth. Soil fertility is critically determined by physical properties such as texture, bulk density, porosity, moisture content, and hardness, along with soil chemical properties including electrical conductivity, pH, and nutrient availability (nitrogen, phosphorus, potassium, and calcium) (Horn et al. 1994). Imbalances in these properties, frequently observed under long-term greenhouse cultivation, can lead to salt accumulation, nutrient stress, and yield decline (Song et al. 2018; Liu et al. 2019). Therefore, comprehensive evaluation of soil physical and chemical characteristics is essential for assessing soil quality and the effectiveness of soil amendments.
Soil microorganisms, particularly beneficial rhizosphere microorganisms, which are key drivers of soil functioning, mediate organic matter decomposition, nutrient mineralization, and the transformation of essential elements such as nitrogen, phosphorus, and carbon (Gyaneshwar et al. 2002; Hemkemeyer et al. 2021). These beneficial microbes enhance root development in the rhizosphere by producing phytohormones, facilitating nutrient uptake, and improving water-use efficiency (Tsavkelova et al. 2006). They also reduce the risk of disease outbreaks by releasing extracellular enzymes and volatile organic compounds that suppress soil-borne pathogens. In Korean agricultural practice, commercially formulated microbial products are regulated and distributed as microbial materials, whereas similar products are commonly referred to as microbial inoculants in European and North American studies, reflecting differences in terminology rather than functional concept (Calvo et al. 2017). Based on these ecological functions, microbial inoculants formulated from beneficial rhizosphere microbes are increasingly used as soil amendments (Trabelsi and Mhamdi 2013). Such materials not only restore soil structure and fertility but also support sustainable crop growth and productivity by creating a more favorable rhizosphere environment (Welbaum et al. 2004).
Therefore, this study aimed to investigate the effects of commercially applied microbial inoculants (MIs) on soil physical and chemical properties and the growth and productivity of summer squash cultivated under greenhouse soil conditions.
Materials and Methods
1. Experimental site and design
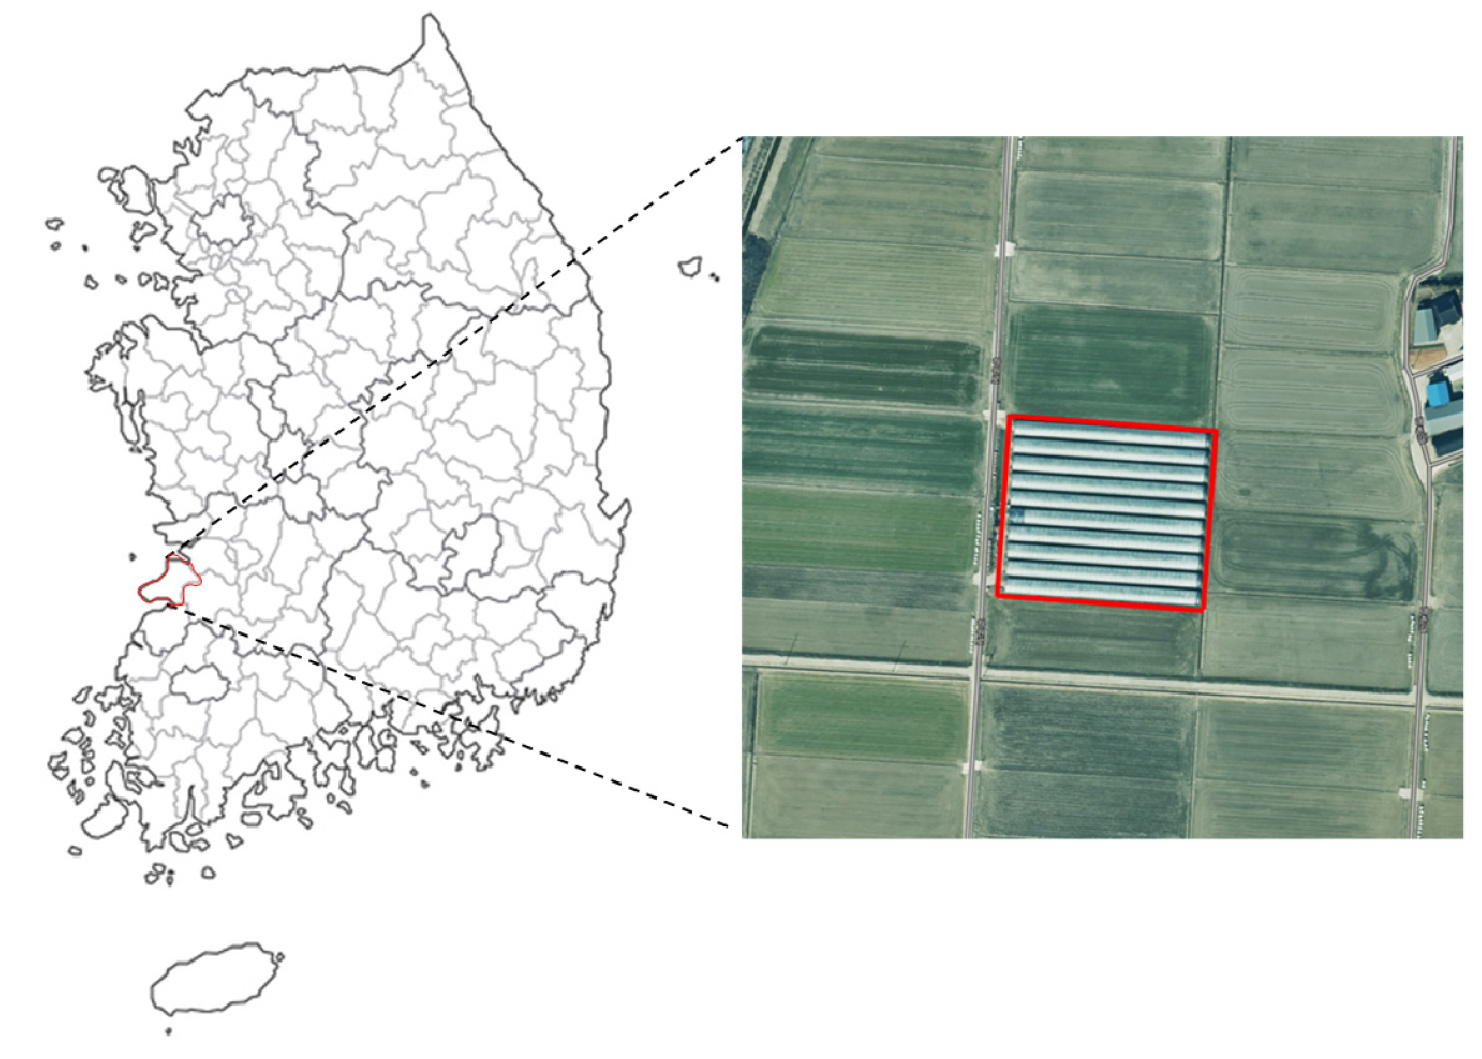
The study was conducted in Baeksan-myeon, Buan-gun, Jeollabuk-do, Republic of Korea (35°42′38.3″ N, 126°48′43.5″ E) from May to November 2023. Among ten greenhouses (Fig. 1) at the site, four were selected for this study and randomly assigned to control and treatment groups. Summer squash (cv. Doksoori; Hongik Bio, Pyeongtaek, Republic of Korea) was used as the experimental crop.
A liquid rhizosphere microbial inoculant composed of Azotobacter vinelandii, Burkholderia vietnamiensis, Paenibacillus polymyxa, and Pseudomonas putida (>106 CFU mL-1 each) was used in this study. The inoculant was applied via fertigation by mixing it with the fertigation solution and delivered at a rate of 1 L per 660 m2, beginning in mid-May 2023 and subsequently at 14 day intervals until late November 2023. The same fertigation regime and volume were applied to both the control and treatment groups, with the inoculant added only to the treatment, ensuring that differences between treatments were attributable to the microbial inoculant rather than variations in liquid input. Six plants were randomly selected from each greenhouse at each sampling time for growth measurements. All greenhouse management practices were applied uniformly throughout the experimental period.
2. Soil physical properties
Soil physical properties, including soil texture, bulk density, soil phases, and hardness, were investigated. Soil samples for physical property analysis were collected at two time points: before treatment application and at the final growth stage during the last plant growth assessment. Samples were collected from the topsoil (0-15 cm) within the root zone of each greenhouse. For each treatment, soil samples were collected in triplicate using a 100 mL core sampler.
Soil texture was determined using the pipette method. Oven dried soil samples were pretreated to remove organic matter, dispersed with sodium hexametaphosphate, and transferred into a sedimentation cylinder. At specific settling times, aliquots were withdrawn with a pipette, dried, and weighed. The proportions of sand, silt, and clay were then calculated and classified according to the USDA system (Shirazi and Boersma 1984; Gee and Bauder 1986).
Bulk density and soil phases were measured using undisturbed soil cores (100 mL volume; 5 cm height × 5 cm diameter), collected in triplicate with a non-rebound hammer. Bulk density, defined as the mass of soil solids per unit soil volume, was determined after oven drying the samples at 105°C for at least 36 h to remove soil moisture. Soil phases were then estimated from bulk density, particle density, and soil water content (Al-Shammary et al. 2018).
Soil hardness was measured using a portable and fieldconvenient Yamanaka type soil penetrometer (DIK-5553, Daiki Rika Kogyo Co., Tokyo, Japan), which measures spring compression under pressure and reports values in millimeters. After calibrating the device to zero, the penetrometer with a clean cone tip was inserted vertically into the soil at a constant speed, and ten measurements were taken per greenhouse. Although soil hardness is typically measured on a soil cross-section, measurements were performed vertically on the soil surface in this study to evaluate crusting caused by salt accumulation.
3. Soil chemical properties
Soil samples collected after harvest at the end of the cultivation period were used to analyze soil chemical properties, including electrical conductivity (EC), pH, inorganic nitrogen (NH₄+-N and NO₃--N), phosphorus (P), calcium (Ca), and potassium (K).
EC was measured using air dried soil samples mixed with distilled water and equilibrated, after which the supernatant was filtered. EC was determined using an EC meter (Orion Versa star Pro, Thermo Fisher Scientific, Waltham, MA, USA), and results were expressed in dS·m-1 (Rhoades 1996).
Soil pH was measured by suspending soil samples in distilled water at a 1:5 ratio and equilibrating for 30 min. The suspension was analyzed using a calibrated pH meter (Orion Versa star Pro, Thermo Fisher Scientific, Waltham, MA, USA) with standard buffer solutions (pH4, 7, and 10) (Sparks et al. 2020).
Inorganic nitrogen (NH₄⁺-N and NO₃--N) was extracted using a 2 M KCl solution (Lee et al. 2017). Ammonium and nitrate concentrations were determined by steam distillation and titration using an automated Kjeldahl system (Kjeltec auto 2400/8400, FOSS Tecator AB, Höganäs, Sweden) and calculated using Equation 1 as follows:
where is the volume of sulfuric acid consumed for titration of the sample (mL), is the volume consumed for the blank (mL), is the normality of the standard sulfuric acid, is the correction factor of the standard acid, and is the dry weight of the soil sample (g).
Total P, Ca, and K concentrations were analyzed by digesting soil samples with perchloric acid and determining concentrations using inductively coupled plasma optical emission spectrometry (ICP-OES; ICP-5800, Agilent Technologies, Santa Clara, CA, USA) (Tighe et al. 2004). Concentrations were calculated using Equation 2 as follows:
where is the concentration of the element in the analyzed sample obtained from the calibration curve (mg·L-1), is the concentration of the blank sample obtained from the calibration curve (mg·L-1), is the dilution factor (applied when the range of the calibration curve was exceeded), is the volume of the sample solution (0.1 L in this study), and is the dry weight of the soil sample (kg).
4. Plant growth evaluation
Plant growth was assessed by measuring plant height, stem diameter, number of nodes, number of leaves, fresh weight, and dry weight on August 18, September 8, and November 22, 2023. Plant height (shoot length) was measured from the ground level to the apical meristem using a measuring tape, and growth rate was calculated based on differences between measurement intervals. Stem diameter was recorded using a vernier caliper at the middle of the lower internode. Leaf area was measured for selected plants at each sampling time using a leaf area meter (LI-3100C, Li-Cor, Lincoln, NE, USA). The number of nodes was counted from the cotyledonary node to the last fully expanded leaf near the shoot apex, whereas the number of leaves was determined by counting only fully expanded leaves, excluding those with discoloration or disease symptoms. Fresh weight was measured immediately after harvest, and dry weight was determined after oven drying the samples at 70°C for at least 72 h in a convection drying oven (JSOF-250T, JSR, Gongju, Republic of Korea). Biomass accumulation was calculated based on dry matter weight.
Fruit yield was assessed by harvesting fruits (≥200 g) from May to November 2023 and expressed as kg per greenhouse per month (kg·house-1·month-1) (Goo et al. 2022). Average total yield was compared between the treatment and control groups.
5. Statistical analysis
All data were statistically analyzed using R software (version 4.2.3; R Foundation for Statistical Computing, Vienna, Austria). Significant differences between the treatment and control groups were determined using a t-test based on individual plant measurements. Graphs were generated using SigmaPlot (version 14.5; Systat Software Inc., San Jose, CA, USA).
Results and Discussion
1. Changes in soil physical properties
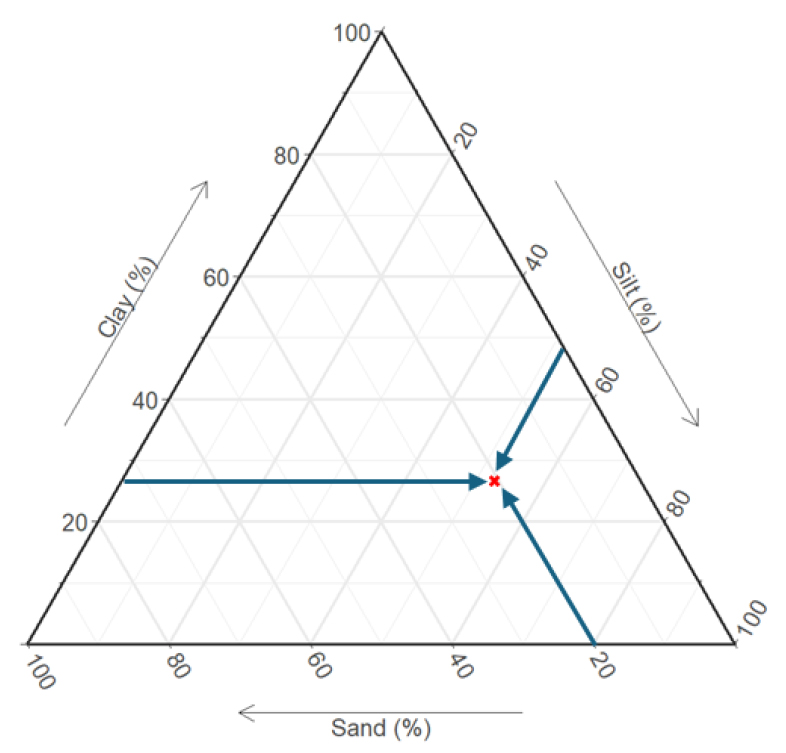
Soil texture analysis was conducted to evaluate the relative proportions of sand, silt, and clay (Shirazi and Boersma 1984). The experimental soil consisted of 20.62% sand, 52.24% silt, and 27.14% clay, corresponding to a silt loam texture, which generally provides favorable drainage characteristics (Fig. 2).
In greenhouse soil cultivation, surface soil often hardens due to salt accumulation. Soil hardness was lower in the treatment group (6.4 mm) than in the control group (10.6 mm), suggesting alleviation of surface compaction following application of MIs (Table 1). Similarly, bulk density was lower in the treatment group (1.46 g·cm-3) than in the control group (1.64 g·cm-3). Lower bulk density is generally associated with increased porosity, which enhances soil aeration, drainage, and root growth.
Analysis of soil phase composition showed that the treatment group had 55.3% solid phase and 44.7% pore space, whereas the control group contained 61.9% solid phase and 38.0% pore space. This shift toward greater pore space indicates improved soil aggregation and a more favorable balance among solid, liquid, and gas phases, approaching the ideal ratio of 2:1:1. Such improvements in soil structure may result from combined effects of wetting drying cycles, microbial secretions, and biological aggregation processes, which contribute to enhanced water retention, aeration, and root development. Similar reductions in soil bulk density and hardness following biological or organic amendments have been reported in saline alkali soils (Chen et al. 2020). Although soil pH conditions differed between studies, these findings collectively suggest that biological inputs can contribute to the mitigation of soil compaction.
Table 1
Soil hardness; bulk density; and proportions of solid, liquid, and gas phases as affected by treatment group on November 22, 2023
| Groupz | Soil hardness (mm) | Bulk density (g·cm−3) | Solid phase (%) | Liquid phase (%) | Gas phase (%) |
| Control | 10.6 ± 0.51 | 1.64 ± 0.05 | 61.9 ± 1.84 | 18.3 ± 1.09 | 19.7 ± 1.49 |
| Treatment | 6.4 ± 0.44 | 1.46 ± 0.03 | 55.3 ± 1.31 | 22.4 ± 1.06 | 22.3 ± 0.91 |
| Significancey | *** | * | * | * | ns |
2. Changes in soil chemical properties
Soil EC, measured using a soil–water extract, was 9.61 dS·m-1 in the treatment group and 13.21 dS·m-1 in the control group, indicating greater salt accumulation in the untreated soil (Table 2). The EC values observed in this study were considerably higher than the generally recommended range for vegetable cultivation. However, elevated EC levels are frequently reported in long-term greenhouse soils due to intensive fertigation and the limited leaching of salts by rainfall. Previous studies have reported that EC levels exceeding 8 dS·m-1 can occur in protected cultivation systems where continuous fertilizer input and restricted water exchange promote salt accumulation (Wang et al. 2022). Therefore, the soil conditions observed in this study likely reflect a typical scenario of salt accumulation in intensively managed greenhouse soils.
Table 2
Soil EC, pH, and NH4+-N and NO3−-N concentrations as affected by treatment group on November 22, 2023
| Groupz |
EC (dS·m-1) | pH |
NH4+-N (mg·kg-1) |
NO3−-N (mg·kg-1) |
P (mg·kg-1) |
K (mg·kg-1) |
Ca (mg·kg-1) |
| Control | 13.21 ± 1.41 | 4.45 ± 0.05 | 3.115 ± 1.02 | 836 ± 112 | 1019 ± 151 | 289 ± 8.2 | 249 ± 31 |
| Treatment | 9.61 ± 0.34 | 4.75 ± 0.05 | 1.065 ± 0.07 | 653 ± 56 | 1050 ± 23 | 258 ± 6.0 | 236 ± 8.4 |
| Significancey | * | ** | * | ns | ns | ** | ns |
Excessive soil salinity relative to the root environment can disrupt water and nutrient uptake by plants, thereby inhibiting normal physiological functions (Vı́llora et al. 2000). Soil pH increased significantly from 4.45 in the control group to 4.75 in the treatment group, suggesting partial alleviation of soil acidity following application of MIs. The soil pH values measured in this study were lower than the optimal range for most vegetable crops, which may be attributed to long term fertilization and continuous cropping in greenhouse systems. Acidification of greenhouse soils has been widely reported because of intensive nitrogen fertilization and nutrient imbalance under protected cultivation.
The concentration of ammonium nitrogen (NH₄+-N) was significantly lower in the treatment group (1.065 mg·kg-1) than in the control group (3.115 mg·kg-1). In contrast, nitrate nitrogen (NO₃--N) concentrations did not differ significantly between the two groups, with values of 653 mg·kg-1 in the treatment group and 836 mg·kg-1 in the control group. The MIs used in this study contained Azotobacter, Burkholderia, Paenibacillus, and Pseudomonas, several of which have been reported as plant growth promoting bacteria capable of atmospheric nitrogen fixation or enhancement of nutrient uptake (Egamberdiyeva 2007; Rawat et al. 2013). Therefore, enhanced plant nitrogen uptake mediated by microbial activity may partly explain the observed reduction in soil NH₄+-N and NO₃--N concentrations in the treatment group. However, alternative pathways such as nitrogen loss through leaching or denitrification cannot be excluded, as previously reported in agricultural soils (Cameron et al. 2013; Alori et al. 2017).
P plays an essential role in plant metabolic processes, although its uptake can be antagonized by other nutrients such as N and Ca. In this study, no significant difference in soil P concentration was observed between the treatment group (1050 mg·kg-1) and the control group (1019 mg·kg-1). The high baseline soil P concentration (>1000 mg·kg-1) may explain the absence of a detectable effect typically associated with phosphate-solubilizing microorganisms (Calvo et al. 2014). Exchangeable Ca concentration was also similar between the treatment (236 mg·kg-1) and control (249 mg·kg-1) groups. Although Ca deficiency often manifests in rapidly growing tissues due to limited internal mobility, no visible deficiency symptoms were observed, indicating that Ca availability was sufficient under both treatments.
In contrast, exchangeable K concentration was significantly lower in the treatment group (258 mg·kg-1) than in the control group (289 mg·kg-1). This reduction may be attributable to increased plant uptake of K, potentially facilitated by potassium-solubilizing microorganisms and enhanced crop growth, rather than a decline in soil fertility (Meena et al. 2014).
Improvements in soil physical properties, such as reduced soil hardness and bulk density and increased pore space, may have facilitated root growth and penetration. Enhanced soil structure can improve water retention and aeration, which in turn may promote more efficient water and nutrient acquisition by plants. These changes may support greater canopy development, ultimately contributing to higher fruit yield. However, as root growth and soil hydraulic properties were not directly measured in this study, these interpretations should be considered as potential mechanisms rather than definitive causal relationships.
3. Growth and yield of summer squash
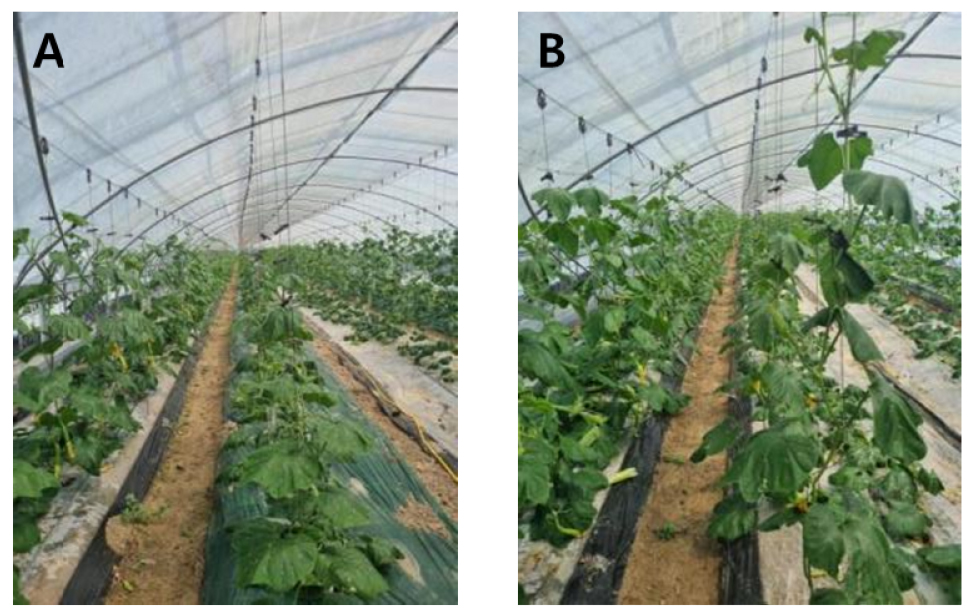
The growth status of summer squash under the control and treatment groups is shown in Fig. 3. Visually, plants in the treatment group exhibited more vigorous early vegetative growth, with longer vines and larger leaves, compared with those in the control group.
Plant height was measured from the ground level to the shoot apex (Fig. 4A). At the early growth stage, the treatment group showed significantly greater plant height than the control group; however, no substantial differences were observed between the two groups at the late growth stage in November. In September, stem diameter was 7.43 mm in the treatment group and 6.54 mm in the control group. In contrast, stem diameter values in November were 10.32 mm in the treatment group and 11.45 mm in the control group, indicating a slightly greater diameter in the control (Fig. 4B). Nevertheless, the differences between groups were generally small, suggesting that treatment application had a limited effect on stem diameter. Although stem diameter was slightly lower in the treatment group at the late growth stage, this difference may be associated with a shift in assimilate allocation from vegetative growth to fruit development under improved nutrient availability.
The number of nodes, determined based on visible leaf scars, did not differ substantially between the treatment and control groups (Fig. 4C). In contrast, leaf number was significantly higher in the treatment group, reflecting enhanced nitrogen availability and uptake (Fig. 4D). On November 22, leaf area was 13,428 ± 584 cm2 in the treatment group and 9,398 ± 221 cm2 in the control group.
Plant fresh weight was defined as the weight of plant samples prior to drying. In September, fresh weight was 821 g in the treatment group and 546g in the control group (Fig. 4E). In November, fresh weight increased to 1,139 g and 971 g in the treatment and control groups, respectively, indicating greater biomass accumulation in the treatment group. Plant dry weight, measured after oven drying the same samples, showed a similar trend, with consistently higher values observed in the treatment group (Fig. 4F).
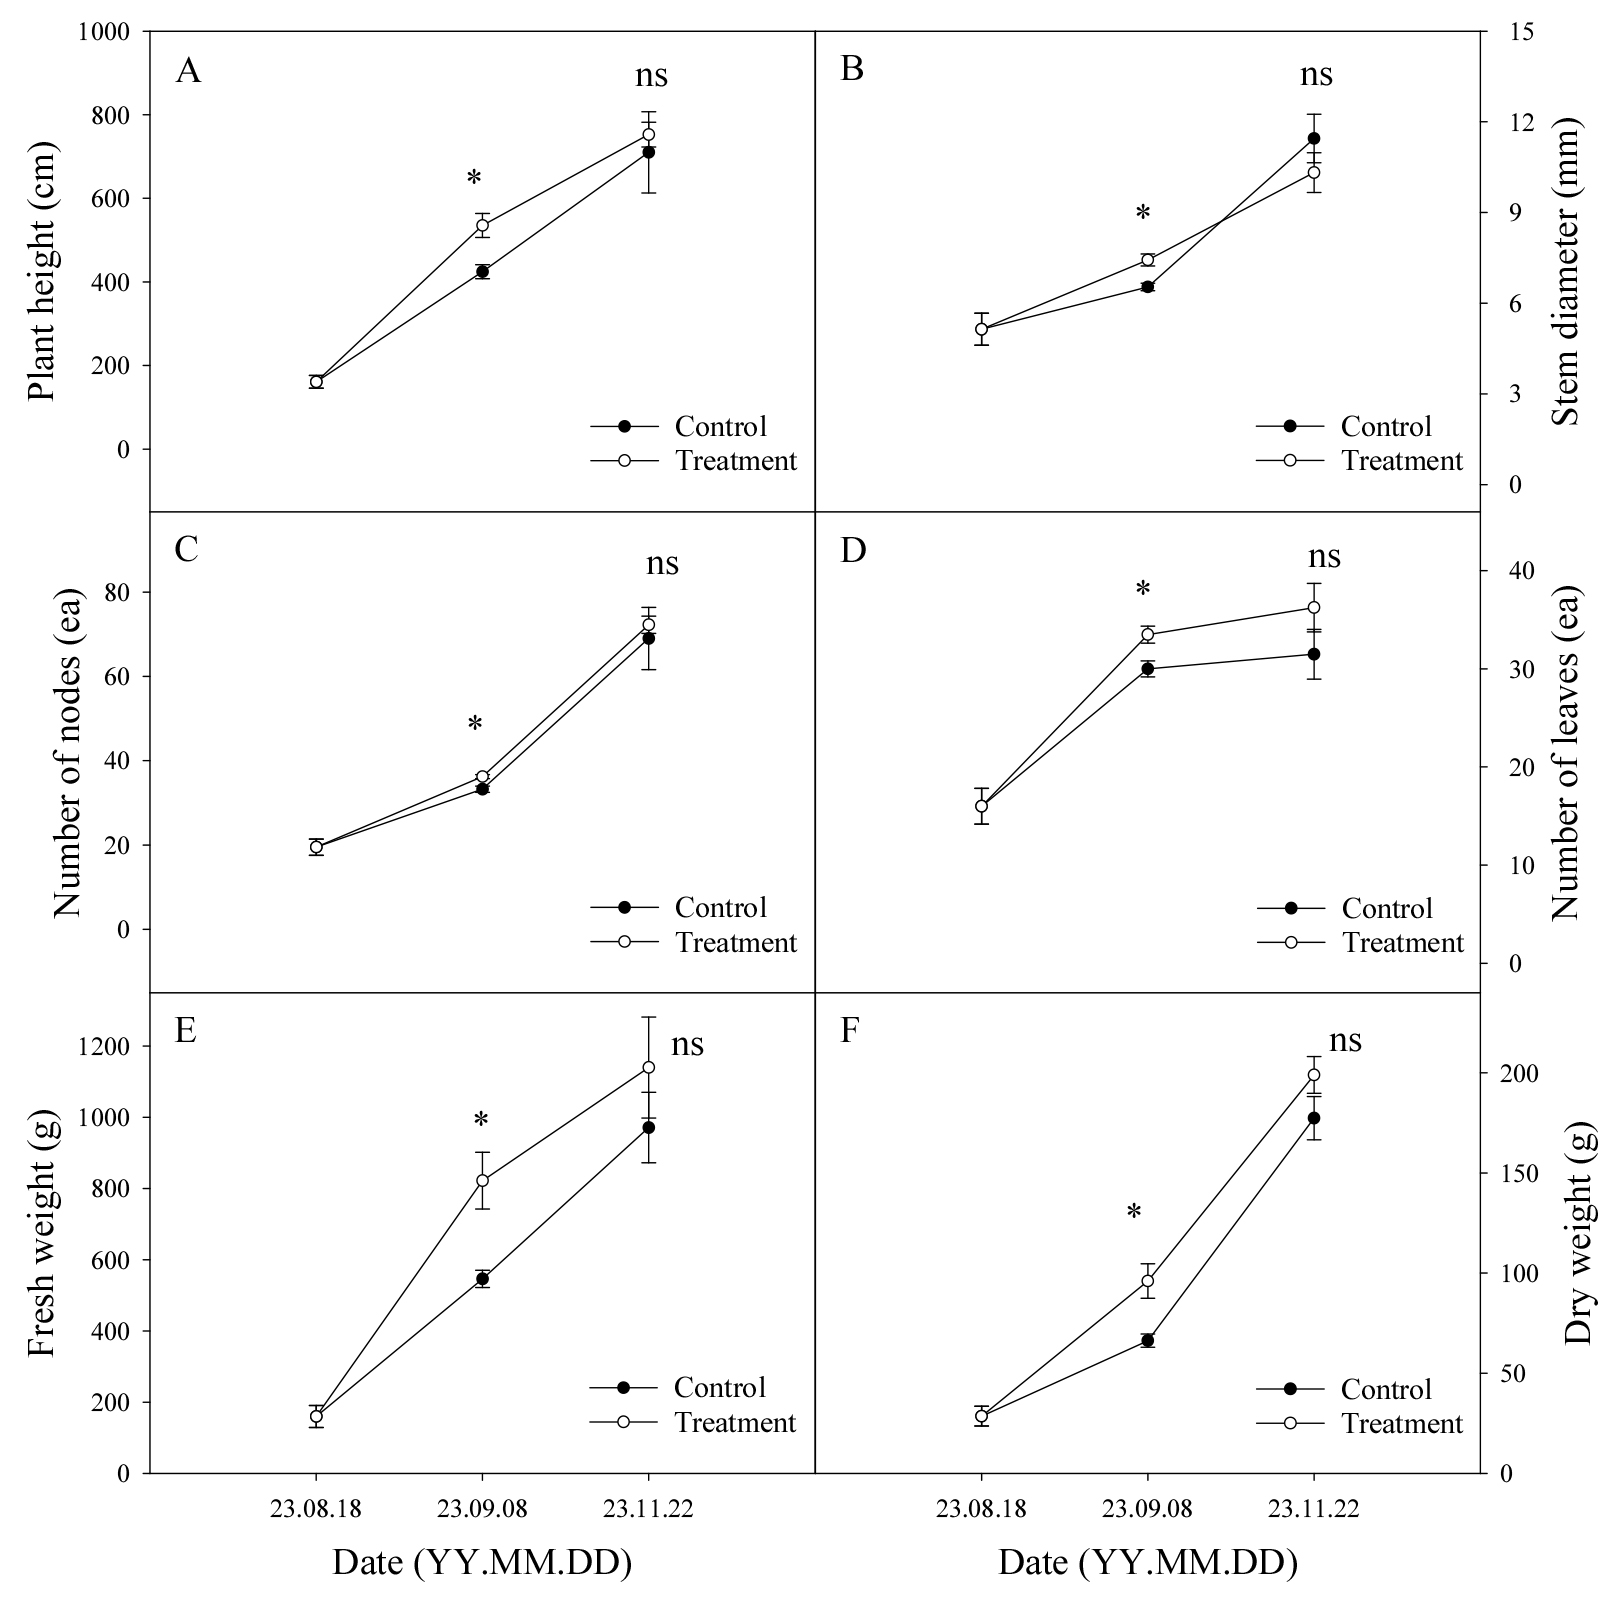
Fig. 4
Growth characteristics of summer squash under control and MIs treatments: (A) plant height, (B) stem diameter, (C) number of nodes, (D) number of leaves, (E) plant fresh weight, and (F) plant dry weight measured on August 18, September 08, and November 22, 2023. Values represent mean ± standard deviation (n = 8). Asterisks indicate statistical significance according to Student’s t-test (*p < .05; ns, not significant)
Although plant height and stem diameter did not differ markedly between treatments at the late growth stage, other vegetative traits, including leaf number, leaf area, and biomass, were consistently greater in the treatment group. These results suggest that application of microbial inoculants promoted canopy development and photosynthetic potential, which are key determinants of assimilating production and yield. Similar enhancements in vegetative growth following MIs application have been reported in cucumber grown under protected cultivation (Simranjit et al. 2019) and in tomato, where increased photosynthetic activity and fruit yield were observed (Xu et al. 2000). More broadly, MIs have been recognized as effective biofertilizers that stimulate plant growth and improve nutrient availability (Shahwar et al. 2023). Therefore, the enhanced vegetative growth observed in the treatment group likely contributed to increased productivity.
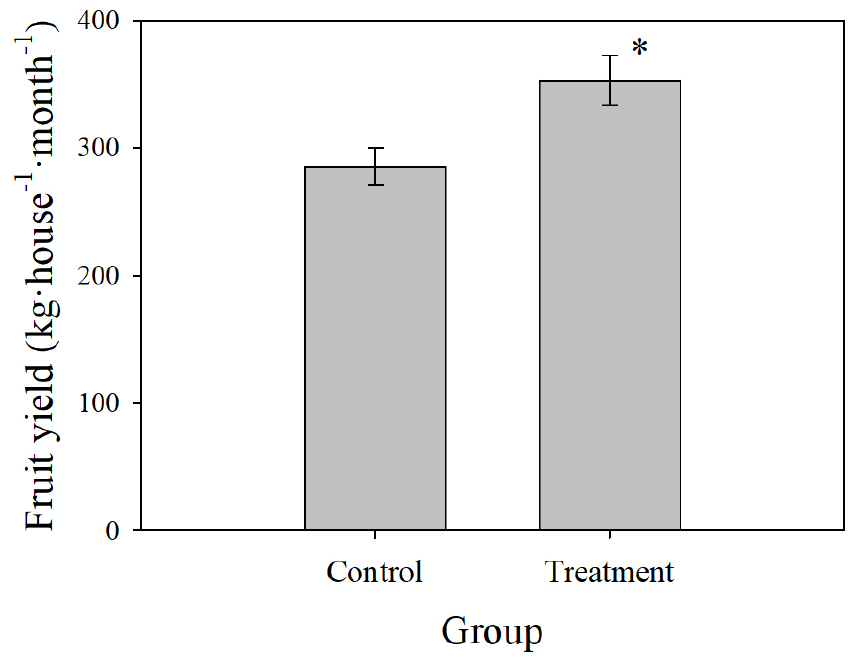
Application of MIs significantly enhanced fruit yield under greenhouse cultivation. Average yield increased from 285 kg·house-1·month-1 in the control group to 352 kg·house-1· month-1 in the treatment group (Fig. 5). Soil EC was also lower in the treatment group (9.61 dS·m-1) than in the control group (13.21 dS·m-1), which may reflect reduced salt accumulation and potentially improved rhizosphere conditions. However, these changes could also be influenced by alternative processes such as nutrient leaching, denitrification, spatial variability among greenhouses, or increased nutrient uptake associated with greater plant biomass. Previous studies have shown that moderate salinity levels can stimulate zucchini yield under controlled conditions (Vı́llora et al. 2000), whereas excessive nutrient input accelerates salt accumulation and negatively affects productivity (Ha et al. 2015). In the present study, yield improvement was observed despite initially high EC conditions, suggesting that microbial inoculation may contribute to mitigating salinity stress and sustaining crop productivity in greenhouse systems. Because both treatments received the same fertigation regime, differences in liquid input are unlikely to explain the observed effects.
Conclusion
This study demonstrated that application of microbial inoculants improved soil physical properties and was associated with enhanced summer squash performance under greenhouse conditions. The treatment group exhibited reduced soil hardness and bulk density, indicating the development of a looser and more favorable soil structure. In addition, soil EC and ammonium nitrogen concentrations were lower in the treatment group than in the control group, suggesting partial mitigation of salinity stress and changes in soil nitrogen dynamics, while soil pH increased. Although most other soil chemical properties and late stage measurements of plant height and stem diameter did not differ significantly between treatments, early-stage vegetative growth and fruit yield were consistently higher in the treatment group. These results indicate that improvements in soil physical conditions and rhizosphere environment contributed to enhanced crop performance. Overall, the findings of this study suggest that microbial inoculants can serve as a sustainable soil management option in intensive greenhouse cultivation systems by improving soil structure, alleviating salinity-related constraints, and supporting stable crop growth and productivity.