

Introduction
Materials and Methods
1. Plant Material and Distribution Condition
2. Determination of Color, Firmness, Total Soluble Solid Content
3. Statistical Analysis
Results and Discussion
1. The Quality Characteristics of Ripe Fruit Based on Harvest Time
2. Changes in Physico-Chemical Properties During the Simulation Distribution of Strawberries Harvest at Different Times and Coloration Rates
Introduction
Strawberry (Fragaria × ananassa Duch.) is one of the fruit consumed largely in fresh and processed form. It is rich in sugars, vitamins, and minerals as well as bioactive compounds such as ascorbic acid, carotenoids, phenolic compounds, folic acid, and nutritionally valuable natural antioxidants (Tulipani et al., 2011; Chaves et al., 2017). Previous studies suggest that Korean and Japanese strawberries have major differences in the nutritional value of strawberries according to their varieties, and that the main components of strawberries are ascorbic acid, anthocyanin, and ellagic acid. In addition, the difference in these components is more affected by the growing season (Kim et al., 2015). The ‘Seolhyang’ strawberry, which was bred between Japanese ‘Red Pear’ and ‘Akihime’ in South Korea in 2005, is characterized by high sugar content and sweet fruity flavor, and its export is steadily increasing. The major exporting countries are Singapore and Hong Kong, which account for two-thirds of exports (MAFRA, 2018).
The maturity of strawberry fruit is characterized based on color change due to anthocyanin formation, softening, and accumulation of sugars and organic acids during ripening (Cao et al., 2015; Given et al., 1988; Ornelas-Paz et al., 2013; Silva et al., 2007). Development of red color begins from fruit apex in strawberries. As ripening progresses, most of the surface of the fruit, up to calyx, becomes bright red colored, which turns into deep red when the fruit is completely ripened.
Strawberry cultivation in South Korea begins after the plant has been transplanted in September, and harvesting starts in December and continues until the following June. Seolhyang cultivar is excellent in quality and is easy to cultivate; however, it has a soft texture. In particular, strawberry harvested after April are easily soften due to high air temperature and relative humidity during cultivation. Therefore, in South Korea, less ripened and harder strawberries with a coloring degree of 80% or less are harvested and distributed. However, since strawberry is a non-climacteric fruit, which should be harvested at full maturity stage to maintain marketing quality, the flavor and color tend to decrease when it is harvested early (Given et al., 1988). On the other hand, when strawberries are harvested from a fully pigmented stage, they are easily softened due to high metabolic activities, which can be easily attacked by microorganisms and can suffer physical damage. As a result, postharvest life becomes shorter (Hashmi et al., 2013; Zhang et al., 2019).
The purpose of this study was to investigate the postharvest quality characteristics of ‘Seolhyang’ strawberry fruit based on the harvest date and the coloring degree. Furthermore, identification of the ripening phase of strawberry suitable for room temperature, cold-chain, and low temperature distribution was carried out.
Materials and Methods
1. Plant Material and Distribution Condition
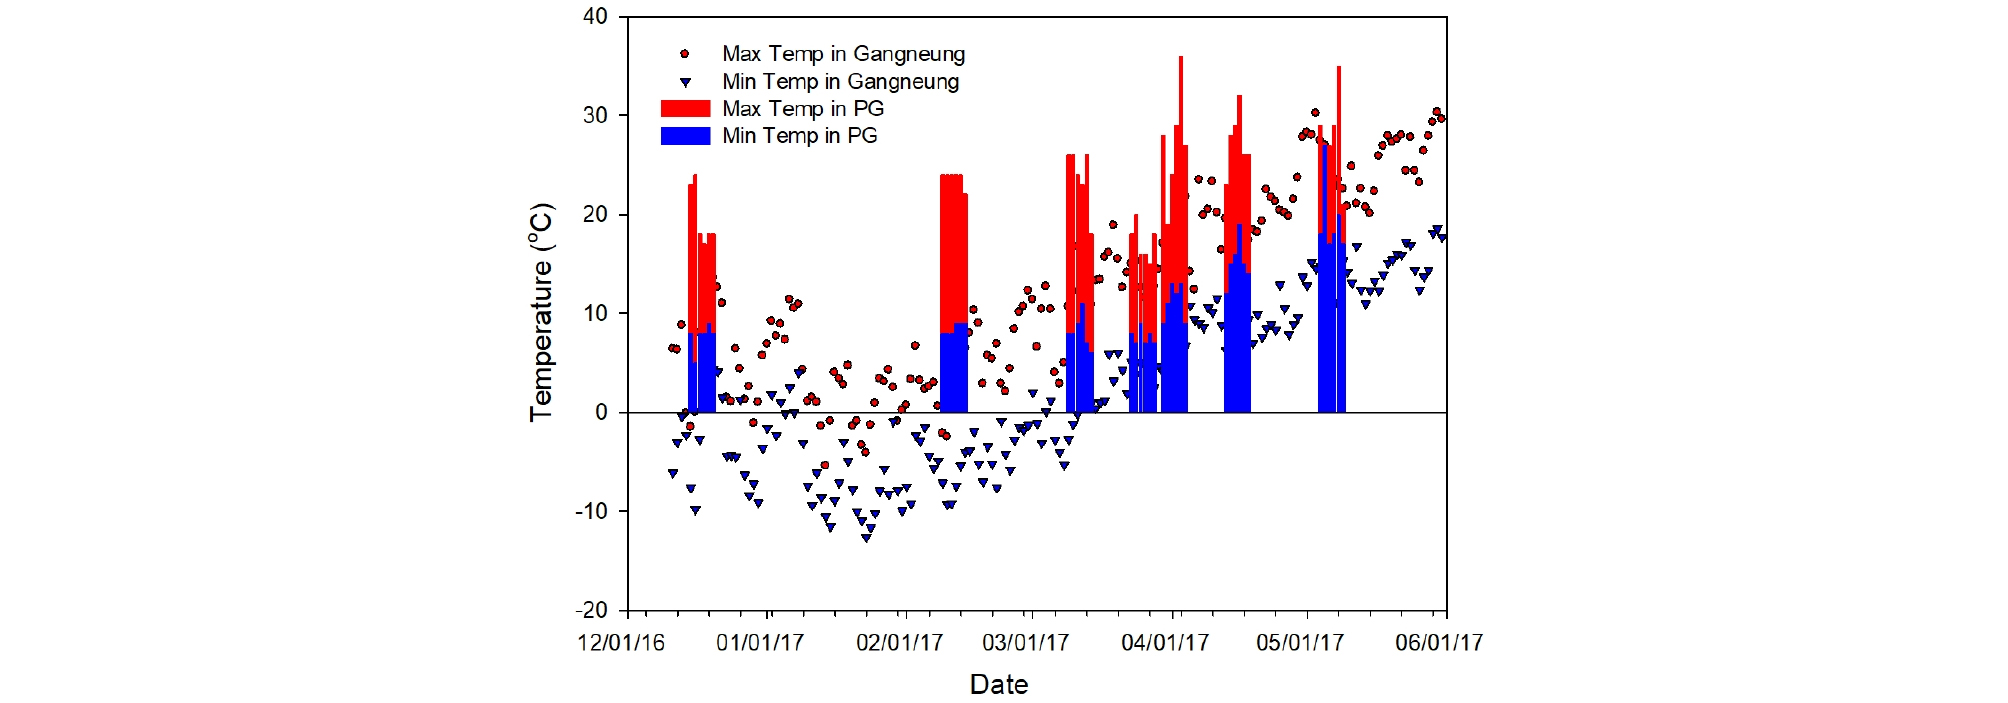
Strawberries (Fragaria × ananassa Duch. cv. Seolhyang) were harvested manually on six different dates between December 2016 and May 2017 (December 20, February 14, March 28, April 4, April 18, and May 9). All experiments were carried out using the strawberries harvested from the plastic greenhouse in the Gangneung area (lat. 37° 45′ N, long. 128° 53′ E). The highest and lowest temperatures in Gangneung area during strawberry growing period were determined based on the data obtained from meteorological office in South Korea. Additionally, maximum and minimum air temperatures in the plastic greenhouse were recorded continuously for 6 days, until 5 days prior to each harvest, and on the harvest day.
For after ripening evaluation, strawberries in four stages of ripening (70%, 80%, 90%, and 100%) were harvested on March 14, April 4, April 18, and May 9. Strawberries sorted into four fruit ripening stages by fruit skin color (Fig. S1). Strawberries varied in color depending on the growing season. Therefore, each coloring stage was classified as shown in Fig. S1 depending on the type of strawberry colored by each period.
They were immediately moved to the laboratory and selected for uniform size, color, and absence of damages. Strawberry cultivation periods varied depending on the outside temperature. Therefore, the temperature and the relative humidity of the after-ripening condition were varied to suit the harvesting time. The after-ripening experiments on strawberries harvested on March 14, April 4, April 18, and May 9 were carried out at the mean temperature and relative humidity of 16.5°C and 37.7% RH; 19.2°C and 58.3% RH; 12°C and 90% RH (common cold distribution conditions); 4°C and 90% RH (simulated distribution conditions), respectively.
2. Determination of Color, Firmness, Total Soluble Solid Content
External color of fifteen fruit was measured using a colorimeter (CR-400, Minolta CO. Ltd., Osaka, Japan) and L, a, and b values were determined based on the Hunter color system at two positions on fruit surface around the equatorial plane of the fruit. The Hunter L value represents lightness or darkness, Hunter a value represents redness or greenness (− value, greenness; + value, redness), and Hunter b value represents blueness or yellowness (− value, blueness; + value, yellowness). The a and b values help derive hue angle (H = tan-1) and chroma value (C = ). Firmness of fruit was measured by performing penetration test with a 5 mm cylindrical probe on the skin of whole fruit using a texture analyzer (EZ Test/CE-500N, Shimadzu, Kyoto, Japan). The speed of the probe was 120 mm·min−1 and defined as the maximum penetration force. Fifteen fruit was measured at each sampling time and the results were expressed in Newtons (N). The soluble solids content (SSC) of a fruit was measured using a portable refractometer (PAL-1, Atago, Tokyo, Japan) and results were expressed as °Brix (n=15).
3. Statistical Analysis
The data obtained were subjected to analysis of variance (ANOVA) using SAS statistical software (SAS Institute, Cary, N.C., U.S.A.). Duncan’s Multiple Range Test (DMRT) was carried out at P ≤ 0.05 level of significance to compare differences between means.
Results and Discussion
1. The Quality Characteristics of Ripe Fruit Based on Harvest Time
We examined air temperature in the plastic greenhouse until 5 days before harvest and compared the degree of coloring of the fruit (Fig. 2). Until harvest in February, the average air temperature in the plastic greenhouse during the experimental period was approximately 16°C, the maximum air temperature was 25°C, and the minimum air temperature was 8°C. In the early March and early April, the average air temperature in the plastic greenhouse was approximately 20°C or less except on April 3, and the lowest temperature was 6°C.
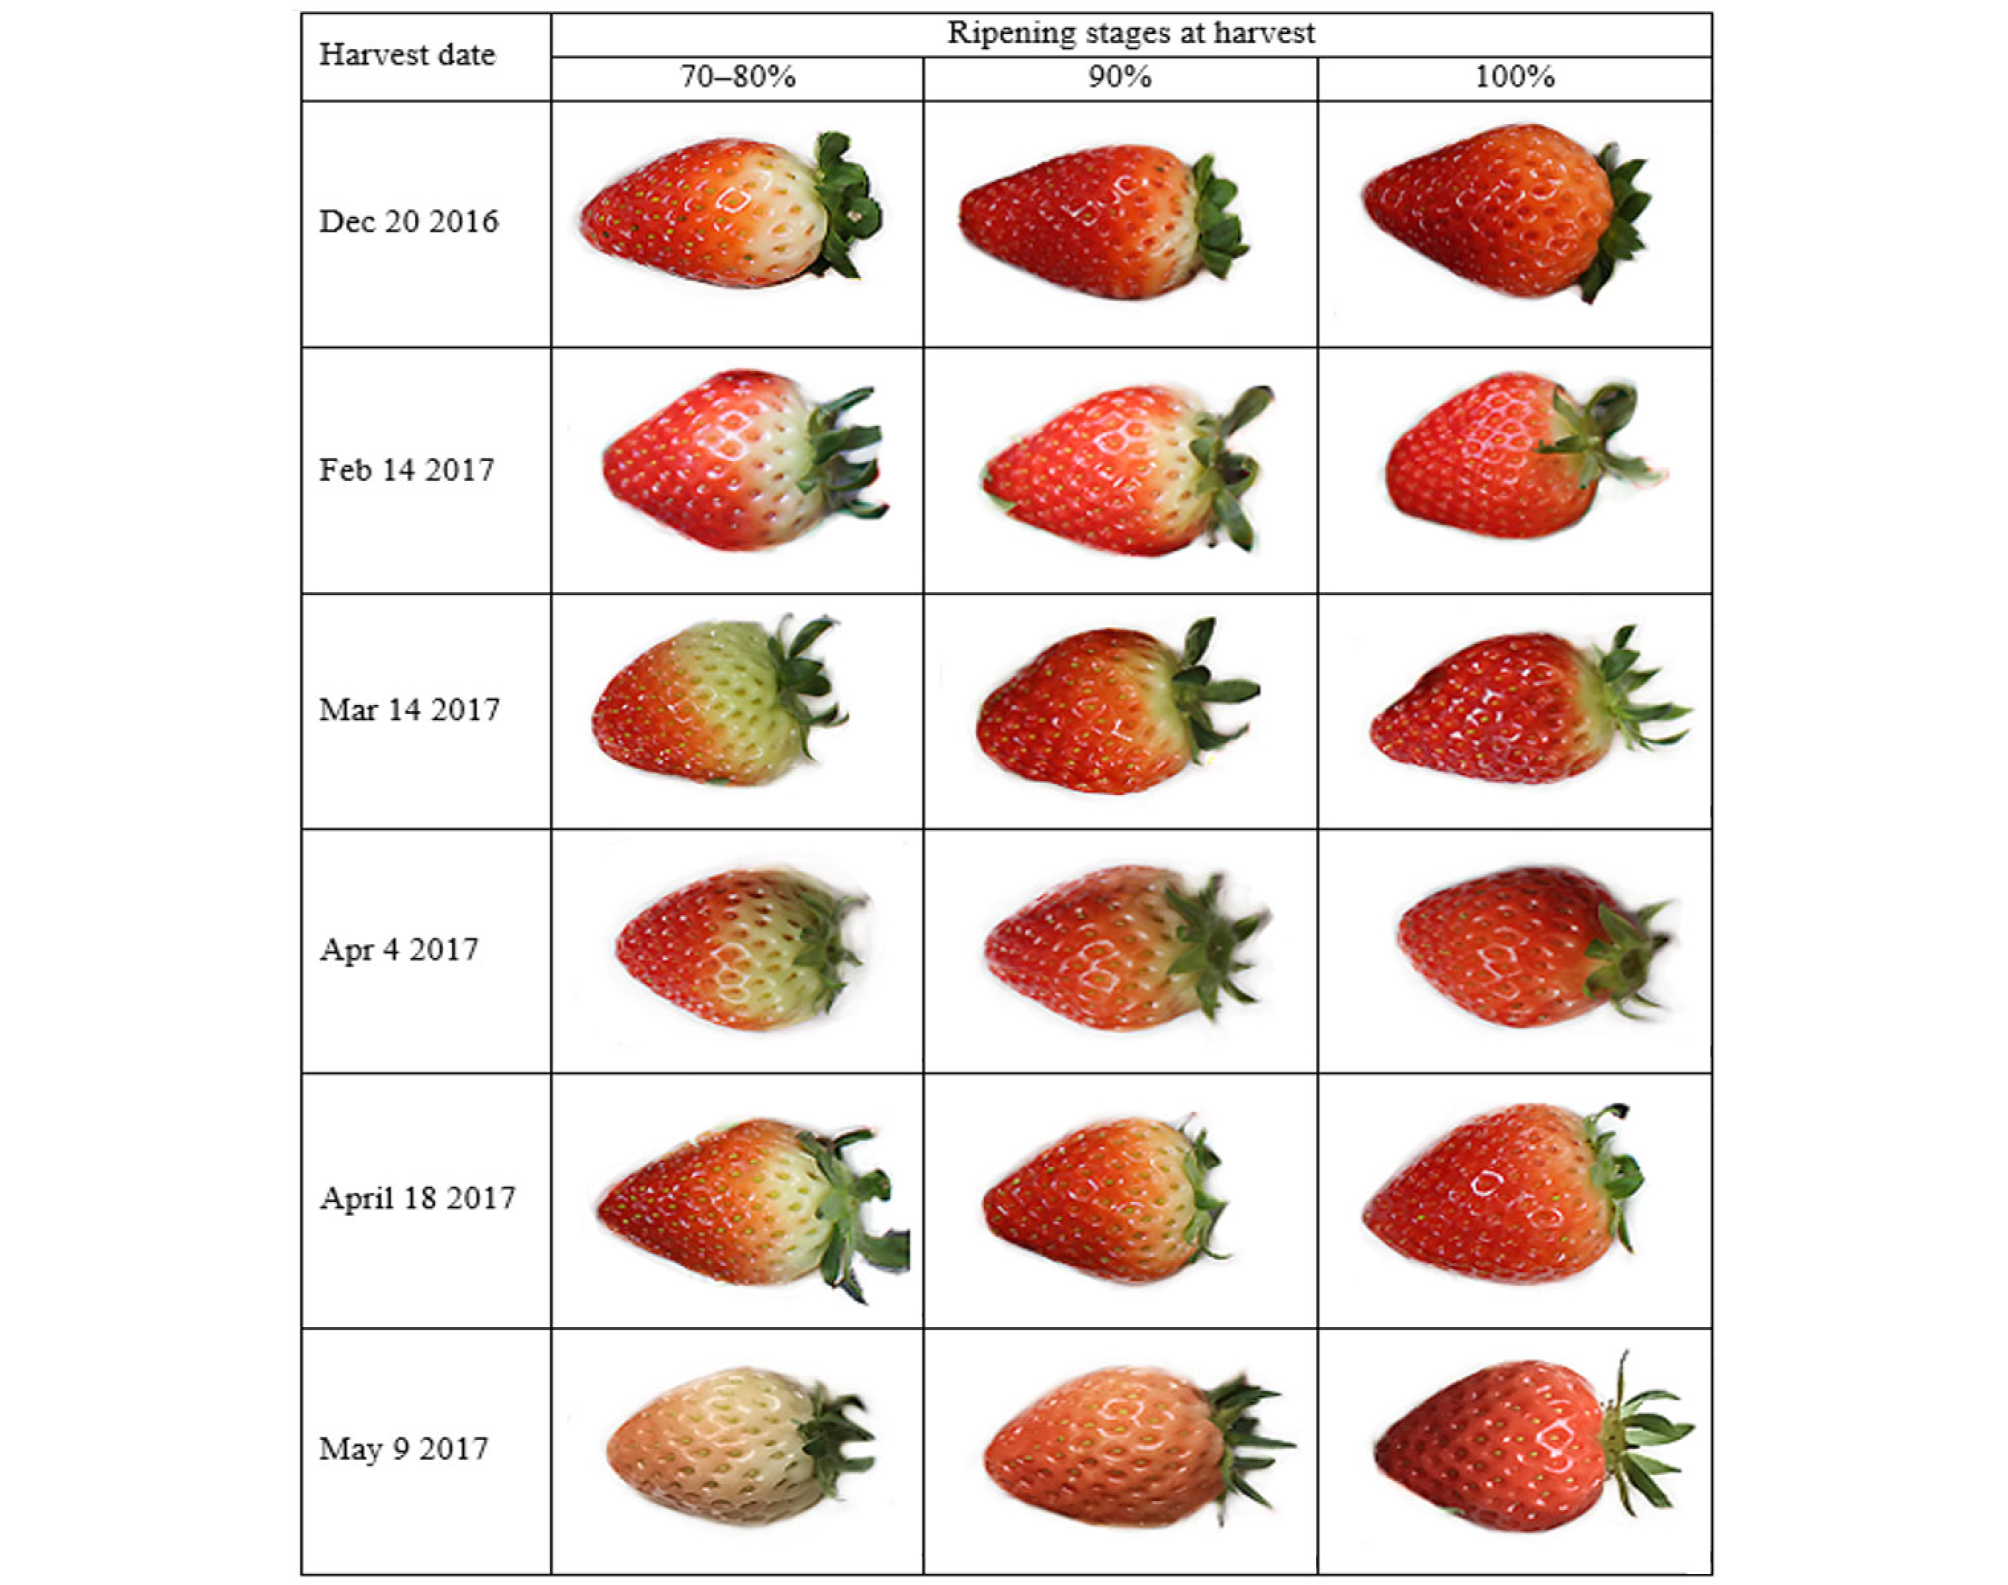
The reddish color appearing from apex to calyx of the fruit did not differ depending on the harvest time. Surface uncolored part of a strawberry adjacent to calyx, produced from mid- December to February, when the day and night air temperatures gradually decreased, was white. However, surface uncolored part of strawberry adjacent to calyx, produced from March to April was light green. Additionally, there was a clear difference between the colored and uncolored parts of the fruit harvested on April 18 and May 9.
The fruit that was harvested in early May were light pink colored, which gradually turned into deep pink, and then red. They were colored differently compared to previously harvested fruit, and the colored and uncolored parts were ambiguous. When the air temperatures in the plastic greenhouse were compared, the average temperature was found to vary depending on the day; the temperature varied between 20 and 27.5°C, after considering exceptional cases of temperature fluctuation. The number of days showing temperatures of 25°C or higher, including the maximum 32°C, in the plastic greenhouse was 5 before harvest on April 18, and 4 before May 9; the maximum temperature change in the plastic greenhouse did not show much variation.
However, the night temperatures in the plastic greenhouse before harvest were maintained between 12°C and 16°C before April 18 except 2 days before harvest; however, it varied from 17 to 20°C before May 9. The optimum temperature required for growing strawberries is 25/12°C (day/night), and when exposed to high temperatures (30/22°C, day/night), growth, yield, and fruit quality are reduced (Wang and Camp, 2000; Wang and Lin 2006).
Previous studies have shown that, when day/night temperatures were higher, strawberries are more reddish and darker color while SSC, titratable acids, and ascorbic acid content were lower. Contrarily, the fruit that was grown at 18/12°C showed higher sugar and organic acid contents (Wang and Camp, 2000). In a previous study, the quantities of anthocyanins produced between 15 and 35°C were studied based on tissue culture experiments; the highest anthocyanin content was observed at 20°C which became extremely low at 35°C, showing that the higher the treatment temperature was, the lower the anthocyanin content was (Zhang et al., 1997). These results suggest that the coloring tendency of strawberry fruit changes when the maximum daytime temperature is above 25°C and when the lowest nighttime temperature is above 18°C in plastic greenhouse.
Strawberries coloration starts from the fruit apex. Seolhyang strawberries used in this experiment colored parts were clearly reddish and non-colored parts became greenish when growth temperature was in the optimum range. However, with an increase in the temperature in the plastic greenhouse, the colored part was intensified, while that of non-colored parts became pinkish which gradually developed into red. As a result, there no clear demarcation was found between the colored and non-colored parts in the case of late harvested strawberries under high plastic-greenhouse temperature (Fig. S1).
The quality of harvested strawberries was evaluated during each production period (Table 1). From December to April, the hardness of strawberries was 2.5-3.0 N. The SSC, which can predict the sugar content of fruit, ranged from 6.8 to 9.5 °Brix. The strawberries cultivated during the coldest months before March (-10.5-13.6°C) showed an SSC of 8.6 °Brix or higher; however, it was lowered to 8.1 °Brix in April (3.1-27.8°C) and 6.8 °Brix in May (10.0-30.3°C) when the weather was warmer. The results indicated that higher air temperature during these cultivation periods decreased SSC of the strawberry fruit.
Table 1. Quality characteristics of Seolhyang strawberries according to the time of harvest (n=15).
The air temperature during the cultivation period had little effect on the Hunter L value indicating brightness, while it affected the Hunter a value indicating red color and the Hunter b value indicating yellow color. The Hunter L values were in the range of 36.5–43.8. These were high in strawberries cultivated in April, whereas those of strawberries harvested in December, February, March, and May were not significantly different. The Hunter a values were in the range of 32.3–37.2; these were higher in strawberries harvested from December to March and in those that were more reddish. From April, the Hunter a value decreased.
Changes in Hunter b values were similar to those of Hunter a values; these were lowered to 17.1–17.6 by March, but then increased. As a result, the chroma and hue angles, which are determined based on the Hunter a and b values, were affected by the climate during the growth period of strawberries. The hue angle is the qualitative attribute of color, which has traditionally been regarded as bluish, yellowish, and reddish. Chroma is the characteristic that allows the assessment of intensity/purity of any given hue and it is considered the quantitative attribute of color.
The hue angle indicated that the strawberries harvested from December to March were more reddish, and those harvested after April, which is characterized by rising temperature, were light reddish. Previous studies have shown that an increase in day/night temperatures affects fruit color by increasing color saturation; the fruit surface becomes darker and redder (Šamec et al., 2016). Similarly, in this study, the hue angle and chroma value of the strawberries harvested on February 14 and March 28, when the daily temperature variability was large, were high.
The above results show that the appropriate maturity of strawberries is characterized by firmness of approximately 2.9–3.0 N, and SSC remained above 8.6 °Brix until March and declined after April. The quality index values that determine the maturity stage of strawberries should be red color, Hunter a value ranging from 32 to 37, and hue angle of 36-45°. Hunter b values ranging from 17 to 20 and chroma values of 50 or higher should be color indicators to determine the maturity.
In this study, the fruit harvested before March had a higher Hunter a, Hunter b, and hue angle values than those harvested in April and May. The reason for this is that when the temperature in the plastic greenhouse was low, the firmness of flesh was harder and the fruit ripening was slowly, which means that it takes time for completion of coloring when the harvest time is delayed.
2. Changes in Physico-Chemical Properties During the Simulation Distribution of Strawberries Harvest at Different Times and Coloration Rates
The main determinant of quality of strawberry fruit, a non-climacteric fruit, is ripening, (Nunes et al., 2006; Ornelas- Paz et al., 2013). Strawberry fruit do not ripen well after harvesting; therefore, they should be harvested after complete ripening. However, ripening is affected by the variety cultivated, cultivation period, cultivation method, and many other factors (Šamec et al., 2016; Voca et al., 2009).
Strawberries produced in low temperature maintain high firmness during storage and distribution, show a linear post-ripening process, and maintain the quality during longer period. Therefore, post-ripening experiment on Seolhyang strawberry fruit was carried out from mid-March, i.e., when the climate starts becoming warmer. The fruit harvested at each ripening stage was classified based on the ripening phase suitable for each application (room temperature distribution, cold-chain distribution, and low temperature storage) with different temperature conditions during post- ripening.
Refrigerated carts or wing-bed vehicles without refrigeration are often used for storing strawberries until early April because temperatures are lower. The strawberries harvested on April 18, when the temperature began to increase above the optimal temperature required for strawberry growth, underwent an post-ripening experiment at 12°C, which is a common cold circulation condition. On the strawberries harvested on May 9, post-ripening experiments were conducted under simulated circulation conditions of 4°C and 90% RH.
Especially when the temperature increases in May, growth of strawberry plants is vigorous while the quality of fruit degrades. High temperature of May accelerates the growth rate of fruit, and the period from post-flowering to maturation is greatly shortened, resulting in decreased hardness of the tissue (Ahn et al., 2014)
Strawberries harvested on March 14 and April 4 subjected to simulated distribution at room temperature, on an average took one day to progress from a particular stage of maturity to the next (Table 2). That is, if a simulated distribution is carried out at a temperature of 16°C or higher, the number of days required for reaching 100% maturity is 3 days for 70% ripe strawberries, 2 days for 80% ripe strawberries, and 1 day for 90% ripe strawberries. However, strawberry harvested at 70% maturity during both the periods lost commercial viability before reaching 110% maturity (dark red, overripe) under the conditions of simulated distribution at room temperature. Thus, Seolhyang strawberries should be harvested at a stage of more than 80% maturity, when long-term distribution is expected to be carried out at room temperature.
Table 2. Accumulated days from harvesting at each ripening stage to progressing to the next stage by after-ripening. Simulated distribution of strawberries harvested on March 14, April 4, April 18, and May 9 was carried out at 16.5°C and 37.7% RH; 19.2°C and 58.3% RH; 12°C and 90% RH; and 4°C and 90% RH, respectively.
The strawberries harvested on April 18 and subjected to simulated distribution at 12°C on an average took 2 days to progress from the harvest stage to the next stage. Strawberries that were harvested on May 9 and subjected to simulated distribution at 4°C, took more than 3 days to progress into the next stage and the color was not uniform. Especially, strawberries harvested at the stage of less than 80% maturity were not commercialized before they were fully ripened; therefore, strawberries should be harvested at a stage of more than 90% maturity.
Firmness of strawberry fruit is very important as an indicator of quality for harvesting and proper distribution. As ripening progresses, the firmness of the strawberry changes, the degree of which varies depending on whether they are detached from the plant or attached. Strawberries detached from the plant do not seem to maintain the same level of firmness as those ripened on the plant (Poel et al., 2014). Firmness of strawberries harvested from March to May decreased with an increase in coloration, which depends on the degree of ripening (Table 3).
Table 3. Changes in firmness of ‘Seolhyang’ strawberries with the progression of after-ripening from harvest time.
For example, 70% mature strawberries harvested on March 14, showed 2.5 N firmness, while the firmness of strawberries harvested at 100% maturity stage was 1.8 N. Furthermore, post-ripening firmness of 70% mature strawberries was similar to the firmness observed at the beginning of harvest; firmness at this stage was higher than that observed in 100% mature strawberries on the plant.
Firmness of the strawberry fruit harvested on March 14 and April 4 and subjected to simulated distribution at room temperature tended to be maintained or slightly increased during maturation. Firmness of the strawberries harvested on April 4 tended to decrease from 3.2 N to 2.9 N as the degree of maturity at the time of harvest increased from 70% to 100%. Firmness of the strawberries harvested at 70% maturity stage increased as the maturity progressed to 100%. It took 6 days for the ripening to increase from 70% to 100% (Table 2), and the firmness was believed to increase due to water loss. The strawberries harvested at a stage of more than 80% maturity maintained an average firmness of 2.9 N or higher even after reaching 100% maturity due to post- ripening during simulated distribution at room temperature. Firmness of the strawberries harvested on April 18 decreased to 3.3 N in 70% mature strawberries and to 2.7 N in 100% mature strawberries.
However, the firmness of strawberry fruit harvested at different stages of maturity remained above 2.7 N during simulated distribution at 12°C. Firmness of the strawberry harvested on May 9, i.e., during a season of increasing temperature, decreased sharply as the maturation stage at the time of harvest progressed; firmness decreased from 2.6 N at 70% maturity stage to 1.87 N at 100% maturity stage. During simulated distribution at 4°C, firmness of strawberry hardly changed, i.e., firmness at the time of harvest was maintained.
Sweetness of strawberry fruit was determined by SSC because most soluble solids are sugars. Cao et al.(2015) reported that, in four strawberry varieties, the proportion of sugars in SSC during ripening was on an average higher than 86%, and the ratio of sugar content to SSC was constant. Therefore, the sugar content in strawberries can be predicted quickly and easily by measuring their SSC contents. Overall, SSC of the strawberries harvested in March and April was higher than that of strawberries harvested in May (Table 4). Despite fluctuations in SSC during the period of post-ripening, i.e., as the maturation progressed, it did not significantly differ from that at the beginning of the harvest.
Table 4. Changes in soluble solid content of ‘Seolhyang’ strawberries with the progression of after-ripening from harvest time.
Strawberry fruit of each ripening stage harvested on April 18 showed an increase in SSC during the post-ripening process in a simulated distribution experiment carried out at 12°C. This increase was thought to be due to increase in soluble sugar content, which is due to the decomposition of trace amounts of starchy components. Sugars and organic acids make a significant contribution to the flavor of strawberry fruit; soluble carbohydrates accumulate in strawberry fruit in the form of fructose, glucose, and sucrose (Liu et al., 2018).
Strawberry fruit accumulates starch early in their growth. The conversion of starch to soluble sugars accounts for about 3% of the latter present in ripe fruit. In strawberry fruit, starch is localized mainly in the cortex at immature green stage, 7 days after anthesis (Souleyre et al., 2004). SSC of the strawberry fruit harvested on May 9, which is characterized by above optimal growth temperature, decreased to 5.0–5.5 °Brix even in the ripe stage; this increased slightly during low temperature distribution at 5°C.
Strawberries harvested at all maturity stages showed SSC of 5.8 °Brix when they reached the stage of 100% ripening. The strawberries cultivated at above optimal temperature faced difficulty in proceeding to the next stage. Therefore, 70% mature strawberries harvested on May 9 did not proceed to the next stage and measurement of their SSC was impossible. Similarly, strawberries from 80% maturity stage progressed to 90% maturity stage, but not to 100% maturity stage, and therefore, SSC at this stage could not be measured. According to a previously reported study, strawberries detached from plants showed lower malic acid, glucose, fructose, and sucrose contents than the vine-ripened fruit, indicating that a sustained supply of photoassimilates, water, and nutrients is essential for normal fruit ripening (Poel et al., 2014).
SSC of strawberries harvested in March and April at 70% maturity stage, determined by post-ripening stain, was lower than that of those harvested at 100% maturity stage. However, strawberries harvested on May 9 did not corroborate these results.
Regardless of the temperature of at which harvesting was carried out, the Hunter L value did not tend to change with ripening stage at the time of harvest (data not shown). As a particular stage of maturity stage progressed into the next stage during the simulated distribution period, the Hunter L value decreased and the rate of decrease was higher under simulated distribution at low temperature than that at room temperature.
The Hunter a value, which indicates the red color of berries, increased with maturation and post-ripening (Table 5). Despite exceptions, its value was found to be approximately 24–26 at 90% maturity stage and 30–35 at 100% maturity stage. Hunter a value was almost constant during post-ripening stage, irrespective of the time of harvest and temperature of simulated distribution, until the next ripening stage was reached. The Hunter b value, which indicates yellow, decreased gradually as the maturity and post-ripening progressed (data not shown).
Table 5. Changes in the Hunter a values of ‘Seolhyang’ strawberries with the progression of after-ripening from harvest time.
The Hunter b value was approximately 21–22 at 90% maturity stage and 16–21 at 100% maturity stage. In the colorimetric survey, red color is indicated by hue value together with the Hunter a value. Regardless of the time of harvest, the hue angle gradually decreased as the ripening stage at the time of harvest progressed and with post-ripening of fruit harvested at each ripening stage (Table 6). The hue angle of strawberries harvested at 70% maturity stage was 78–98, which decreased to 36–48 at 100% maturity stage. In particular, when the simulated distribution is performed at more than 12°C, the ripening achieved was 90% or higher; however, when the test was conducted at a low temperature (4°C), ripening did not exceed 80%. In addition, the fruit that was harvested at the 80% maturity stage did not progress to 100% maturity stage. Nunes et al. (2006) reported that only strawberry fruit harvested in the three-quarters colored stage were generated color, pH, acidity, soluble solids content, and phenolic content equal to the harvesting level present in strawberries harvested in the full red stage during storage at 1°C. It also suggests that for long-term storage of strawberries, firmness and color retention are better when harvested in three-quarter colored stages than in full red stages.
Table 6. Changes in hue angle of ‘Seolhyang’ strawberries with the progression of after-ripening from harvest time.
Results show that, the progression rate of ripening stage based on strawberry color was 10%/day during simulated distribution at room temperature, 5%/day at 10–12°C, and 3%/day at low temperature storage (5°C). Seolhyang strawberry fruit should be harvested when their maturity is higher than 80% for long-term distribution at room temperature, and when it is at least 90% for low-temperature storage (< 5°C) to maintain merchantability until the fruit is 100% ripe. Additionally, firmness is an important indicator of quality, and strawberries showing firmness of 3.0 N or more are favorable for quality control after harvesting.
