Introduction
Material and Methods
1. Experimental materials
2. Drought stress treatment and visual assessment of wilting for drought response in seedlings
3. Plant image capture and leaf area calculation
4. Statistical analysis
Result and Discussion
1. Experiment 1: Comparative analysis of traditional visual assessment and image processing techniques for drought response evaluation in Kimchi cabbage seedlings
2. Experiment 2: Validation of RGB image analysis for drought response assessment in Kimchi cabbage, radish, and lettuce seedlings
Conclusion
Introduction
Kimchi cabbage (Brassica rapa L. ssp. pekinensis) is a key ingredient of kimchi and is cultivated year-round in Korea. Kimchi cabbage is highly susceptible to drought, and when drought occurs, leaf development is impeded, growth rate slows, and leaf size decreases. When drought becomes severe, the leaf color turns yellow, wilts, or dies, which can ultimately lead to yield loss (Ahluwalia et al., 2021; Kuo et al., 1988; RDA, 2019; Shawon et al., 2020).
Drought is a major environmental stress factor that significantly impacts plant growth and production. Drought stress causes a decrease in water content due to impaired water uptake by plants, stomatal closure, decreased cell expansion, and decreased leaf area and chlorophyll content, which in turn reduces photosynthetic capacity and negatively affects growth and yield (Chaves et al., 2003; Flexas et al., 2004). Although some recovery is possible by rewatering after drought stress, complete recovery of damaged leaf tissue may be difficult. Damage to drought stress and recovery responses to rewatering may vary depending on plant genotype and cultivation conditions, and can be important indicators for evaluating plant tolerance and resilience to drought stress (Lawlor and Cornic, 2002).
Various methods have been proposed to breed drought-resistant varieties and evaluate the tolerance of crops to drought stress (Bao et al., 2023; Marchin et al., 2020; Wang et al, 2024). Other studies have focused on evaluating the drought response of seedlings to achieve uniform and reproducible water-stress conditions (Badr et al., 2020; Jang et al., 2024; Meeks et al., 2013; Zu et al., 2017). However, existing evaluation methods are time-consuming and require repeated measurements. In addition, some methods rely on subjective judgment, which may lead to inconsistent results. These methods often provide data only at a specific point in time, making it difficult to capture the dynamic changes over time. Therefore, more efficient and objective methods are required to evaluate drought response in crops.
Recent advances in image analysis technology have provided promising solutions for objective and consistent high-throughput drought tolerance evaluation (Chen et al., 2014). High-throughput phenotyping methods are being studied as alternatives to solve the labor-intensive and time-consuming problems of traditional plant phenotyping techniques (Correia et al., 2022; Guo et al., 2023; Yoon et al., 2024). Utilizing image-processing technology for drought tolerance evaluation can overcome the limitations of existing methods, such as the subjective judgment of investigators, and can process large amounts of data quickly and efficiently. The analysis of sequential images over time can dynamically assess seedling growth and stress responses.
Briglia et al. (2019) analyzed morphological characteristics (leaf area, color, etc.) of grapevines using RGB and NIR imaging techniques and suggested the possibility of using them as drought stress indicators through correlation analysis with leaf water potential. However, they did not present a quantitative classification model for drought stress assessment. Mishra et al. (2021) presented an approach that can accelerate digital phenotyping for drought-tolerant cultivar selection by quantifying and visualizing drought stress responses in Arabidopsis thaliana using visible and near-infrared spectral imaging techniques combined with deep learning. Unsupervised learning-based clustering allowed visual tracking of drought-related changes over time. However, the drought tolerance assessment required comparison with well-watered plants that were not subjected to drought stress and the applicability to crops other than Arabidopsis thaliana has not been verified.
This study aimed to evaluate the drought response of Kimchi cabbage seedlings by comparing a novel approach to estimate leaf area changes due to wilting using RGB imaging technology with conventional visual assessment methods. The changes in leaf area ratio during drought treatment and recovery stages were investigated based on the leaf area at the beginning of drought stress treatment. In this study, image processing technology was applied to estimate the leaf area of multiple plants in a community rather than individual plants. Additional tests were performed on radish and lettuce seedlings to further verify the effectiveness of RGB image analysis.
Material and Methods
1. Experimental materials
This study was conducted in an individual greenhouse cell measuring 12 × 8 m within a Venlo-type glass greenhouse (north-south orientation, 38 m long × 24 m wide, side height 4.5 m) located at the National Institute of Horticultural and Herbal Science (NIHHS) in Wanju, Jeollabuk-do, in 2023. It was consisted with two experiments. In Experiment 1, to evaluate the drought response of Kimchi cabbage at the seedling stage through drought stress treatment, 16 Kimchi cabbage breeding lines being developed at NIHHS were used as materials. Kimchi cabbage seeds were sown in 12 plug trays with 72 cells each (280 mm wide × 540 mm long × 48 mm high, 6 × 12 cells, cell volume 34 mL, Bumnong Co., Korea) filled with growing media (Heungnong Bio No. 1, Heungnong Seeds, Korea).
In Experiment 2, in addition to Kimchi cabbage, commercial or bred varieties of radish and lettuce were used. Four varieties per crop were selected, with the Kimchi cabbage varieties being ‘Asia-ppuli-baechu’ (Asia Seed, Korea), ‘Bulam3ho’ (Farm Hannong, Korea), ‘CR Matjjang’ (Farm Hannong, Korea), and ‘Hwipalam’ (Sakata Korea, Korea); the radish varieties being ‘Cheongdaebommou’ (Nongwoo Bio, Korea), ‘Geumbong’ (Kwonnong Seed, Korea), ‘Seohomou’ (Nongwoo Bio, Korea), and ‘Tokwang’ (Farm Hannong, Korea) ; and the lettuce varieties being ‘Galmaetbit’ (RDA, Korea), ‘Hacheong’ (RDA, Korea), ‘Heeseoncheongchima’ (RDA, Korea), and ‘Sambokhacheong’ (RDA, Korea) . The seeds were sown in 72-cell plug trays, divided into three sections, with 24 seeds per variety per replicate, and three replicates for each variety.
After sowing, the growing media was sufficiently moistened by overhead irrigation. The plug trays were placed on the cultivation bench in a greenhouse cell and grown as seedlings. Depending on the weather and the growth stage of the crops, overhead irrigation was performed 1-2 times a day. From the third week after sowing, liquid fertilizer ‘Mulpure’ (for leafy vegetables, Daeyu Co., Korea) was applied via sub-irrigation. Four weeks after sowing, plants with 4-5 unfolded leaves were used as experimental materials for drought response screening.
2. Drought stress treatment and visual assessment of wilting for drought response in seedlings
For drought stress treatment, Kimchi cabbage seedlings with 4-5 unfolded leaves grown for 4 weeks were used as plant materials. Drought stress treatment was performed by withholding water. The duration of drought stress treatment was 7 days, and was adjusted according to the seedling’s wilting response during the treatment period. The degree of wilting for each seedling was visually assessed daily.
The visual assessment method for wilting was modified according to that described by Jang et al. (2024). The drought response of each plant was classified into six stages: (1) completely dry or dead, (2) very severe wilting, (3) severe wilting, (4) moderate wilting, (5) slight wilting, and (6) healthy. In Experiment 1, watering was restarted when the wilting degree reached very severe (visual score for wilting: 2) or when the plant dried and died (visual score for wilting: 1). Just after rewatering, water was supplied to the plants every day for 7 days and recovery response from wilting was observed. In Experiment 2, water was resupplied after 4 days of drought stress treatment, when the plant had withered (visual score for wilting: 2) or when the plant had died (visual score for wilting: 1). Water was supplied daily for 7 days after rewatering.
Visual scores for wilting were calculated using the following equation:
Visual scores for wilting = [(Number of plants in ‘stage 1’ × 1) + (Number of plants in ‘stage 2’ × 2) + (Number of plants in ‘stage 3’ × 3) + (Number of plants in ‘stage 4’ × 4) + (Number of plants in ‘stage 5’ × (Number of plants in ‘stage 6’ × 6)] / Total number of plants treated
A higher value indicates greater tolerance to drought stress.
3. Plant image capture and leaf area calculation
During the evaluation period of wilting degree and recovery response after rewatering, images of the individual plug trays were taken along with a visual assessment of the wilting degree. Individual plug trays were placed in a photobox (foldable LED photobox plus 63 cm, PRODEAN, China) with LED lighting installed at the top. Images were taken from the top view of the plug trays using a smartphone camera.
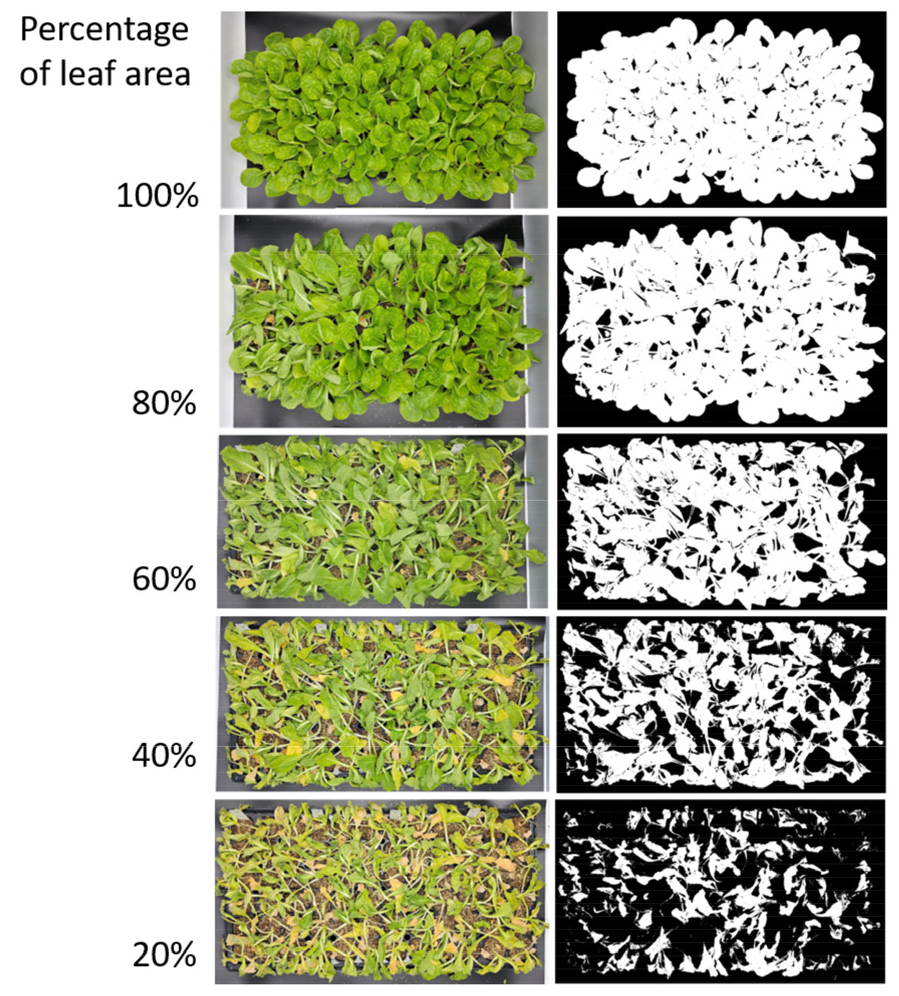
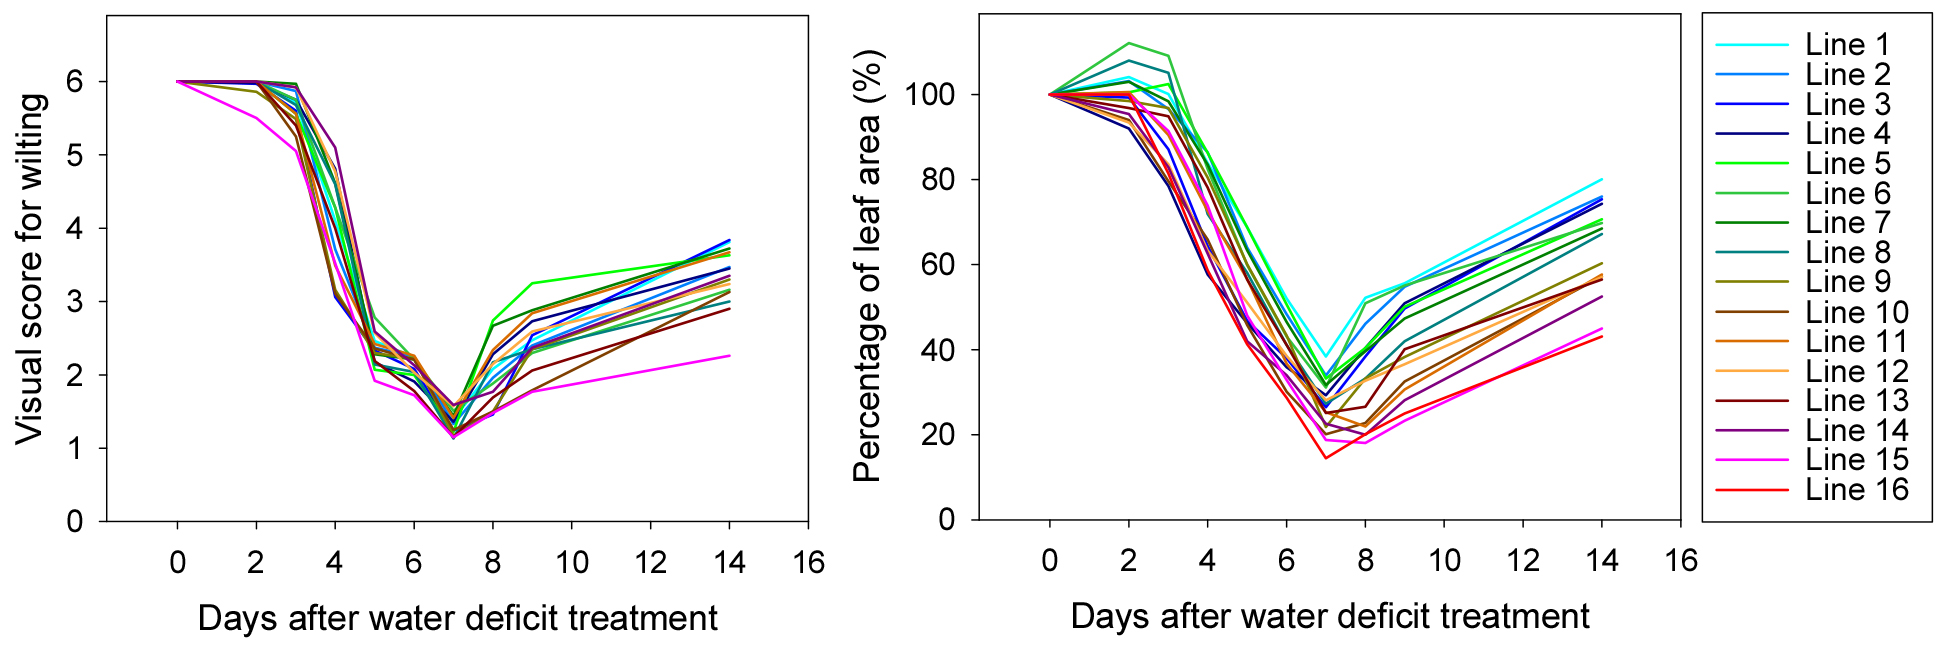
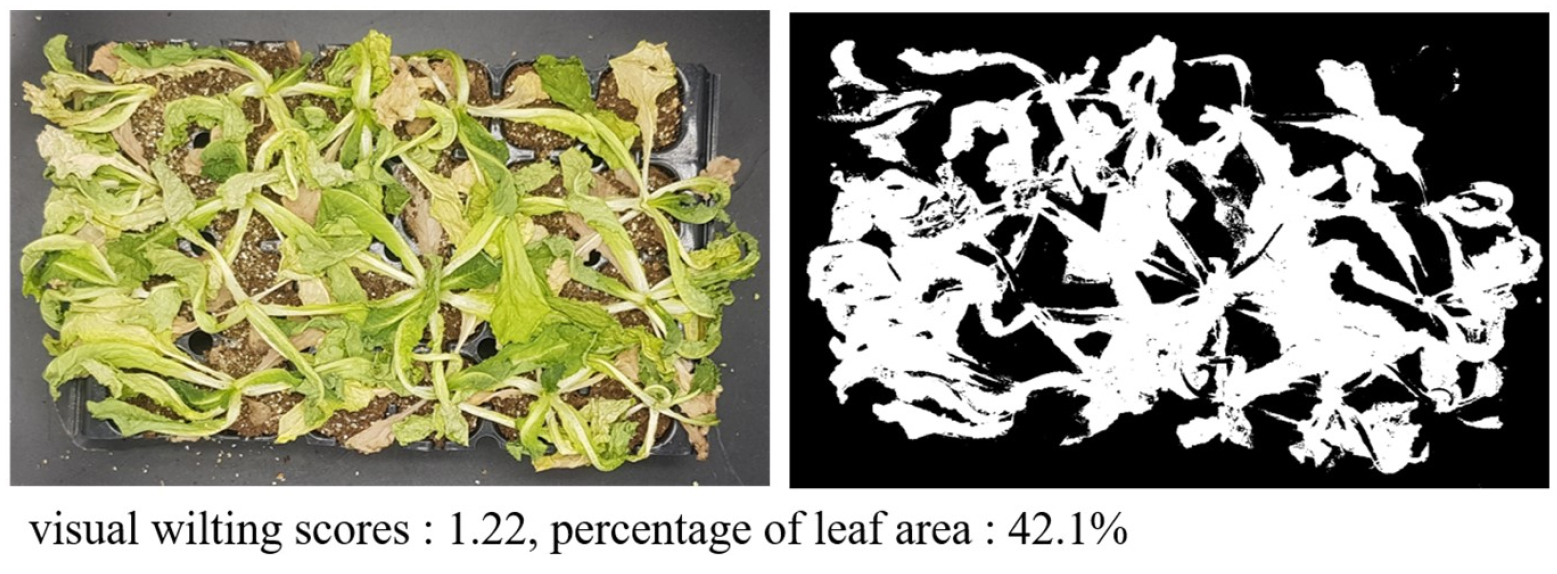
The captured images were processed using the ImageJ Fiji software to extract and binarize the green portions of the plants, and the pixel values of the corresponding areas were obtained (Fig. 1). The percentage of leaf area (PLA) was calculated based on the measured values of each plug tray at the start of drought stress treatment and the measured values during the wiling and recovery response evaluation period after drought stress treatment and rewatering (Fig. 2). The equation used for this calculation was as follows:
Percentage of leaf area (PLA, %) = (pixel value at evaluation time / pixel value at the start of drought stress treatment)×100
4. Statistical analysis
The collected data were analyzed using SigmaPlot (v.14, Grafiti, Palo Alto, CA, USA). Correlation and regression analyses for visual assessment values of drought response and PLA, ANOVA and multiple comparison tests for crop varieties in the experiment.
Result and Discussion
1. Experiment 1: Comparative analysis of traditional visual assessment and image processing techniques for drought response evaluation in Kimchi cabbage seedlings
The first experiment involved 16 Kimchi cabbage breeding line seedlings subjected to a 7-day drought stress treatment followed by a 7-day recovery period with rewatering. Visual wilting scores were recorded daily from the onset of drought stress treatment during the recovery phase. Concurrently, RGB images were captured daily, and PLA was calculated by extracting the green areas from these images.
Fig. 3 illustrates the changes in visual wilting scores and PLA over the 14-day period. During the drought stress treatment, the visual wilting scores decreased, indicating experiencing greater stress. PLA also decreased, reflecting a reduced leaf area due to wilting. Upon rewatering, gradual recovery was observed in both visual scores and PLA, although the extent of recovery varied among the different lines.
To provide a more detailed comparison, the visual wilting scores and PLA were analyzed at two key time points: the end of the 7-day drought stress treatment and the end of the 7-day recovery period. Table 1 presents the visual wilting scores and PLA values at these two time points along with the average values ranked for each breeding line.
Table 1.
Visual wilting scores and percentage of leaf area at the end of the 7-day drought stress treatment and the 7-day recovery period, including average values ranked for each line.
| Breeding line | 7days after drought stress treatment | 7days after rewatering | Averagez | |||
|
Visual score for wilting |
Percentage of leaf area |
Visual score for wilting |
Percentage of leaf area |
Visual score for wilting |
Percentage of leaf area | |
| Line1 | 1.7 | 38.4 | 3.6 | 80.1 | 2.7 | 59.3 |
| Line2 | 1.4 | 33.9 | 3.8 | 76.0 | 2.6 | 55.0 |
| Line3 | 1.3 | 26.5 | 3.5 | 75.4 | 2.4 | 51.0 |
| Line4 | 1.2 | 29.3 | 3.8 | 74.3 | 2.5 | 51.8 |
| Line5 | 1.4 | 33.2 | 3.4 | 70.7 | 2.4 | 51.9 |
| Line6 | 1.2 | 31.1 | 3.6 | 69.8 | 2.4 | 50.5 |
| Line7 | 1.5 | 31.7 | 3.2 | 68.5 | 2.3 | 50.1 |
| Line8 | 1.4 | 27.3 | 3.7 | 67.2 | 2.6 | 47.3 |
| Line9 | 1.1 | 21.8 | 3.0 | 60.3 | 2.1 | 41.1 |
| Line10 | 1.2 | 20.1 | 3.3 | 57.2 | 2.2 | 38.7 |
| Line11 | 1.3 | 25.3 | 3.1 | 57.7 | 2.2 | 41.5 |
| Line12 | 1.4 | 28.1 | 3.7 | 57.1 | 2.5 | 42.6 |
| Line13 | 1.6 | 25.1 | 3.2 | 56.5 | 2.4 | 40.8 |
| Line14 | 1.2 | 22.6 | 2.9 | 52.5 | 2.0 | 37.6 |
| Line15 | 1.6 | 18.8 | 3.4 | 45.0 | 2.5 | 31.9 |
| Line16 | 1.1 | 14.5 | 2.3 | 43.1 | 1.7 | 28.8 |
The drought stress response and recovery capacity varied depending on breeding lines. Some breeding lines demonstrated better resistance to drought, while others showed quicker recovery once watered again. To thoroughly evaluate how different plant types responded to drought and recovered afterwards, average values were calculated at the two key time points.
After seven days of drought stress treatment, the visual assessment scores ranged from 1.1 to 1.7, indicating that most seedlings were severely wilted or dying. In contrast, seven days after rewatering, the scores improved to between 2.3 and 3.8. Similarly, PLA decreased from 14.5% to 38.4% on the seventh day of drought stress treatment but recovered to between 43.1% and 80.1% seven days after rewatering.
The average values, combining both the drought response and recovery capacity, ranged from 1.7 to 2.7 for visual wilting scores and from 28.8% to 59.3% for PLA. This ranking highlighted the relative drought resistance and recovery capacity of each breeding line. Breeding lines with higher average wilting scores and PLA values were ranked higher, suggesting better overall drought response and resilience.
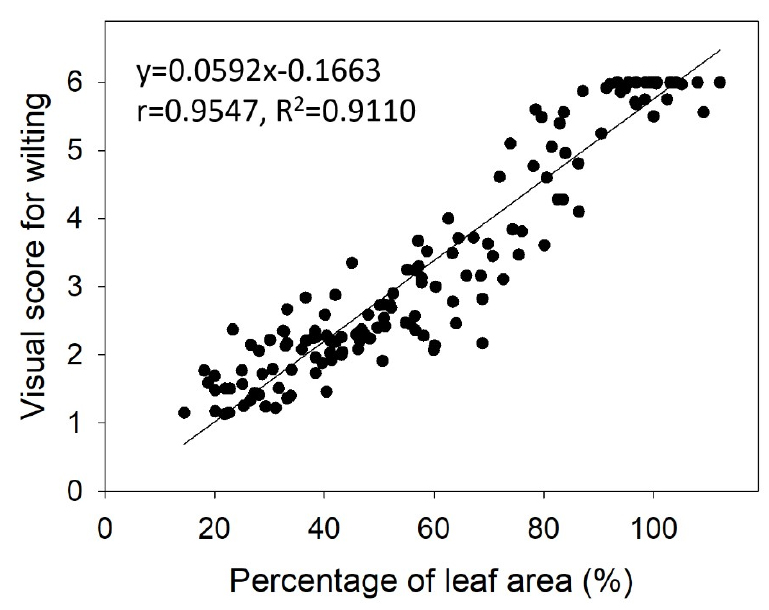
A scatter plot was generated to examine the correlation between the visual wilting scores and PLA values across the entire 14-day period (Fig. 4). The Pearson correlation coefficient (r), p-value, and coefficient of determination (R2) were calculated to quantify this relationship. The analysis revealed a strong positive correlation (r = 0.9547, p < 0.001, R2 = 0.9110) between visual wilting scores and PLA. This indicates that as the visual wilting score increased, the PLA increased significantly. The high R2 value suggests that the PLA can reliably predict visual wilting scores, validating the use of image-based analysis as a quantitative method for assessing drought stress.
These results suggest that the RGB image analysis method is a reliable alternative to traditional visual assessments for determining drought response in Kimchi cabbage seedlings. Traditional assessment methods heavily rely on subjective visual scores, which are susceptible to human errors and variability. In contrast, the RGB image analysis method offers objective and quantitative measurements of leaf area, thereby reducing potential inconsistencies.
The traditional visual assessment in drought response assessment using image analysis has been significantly advanced by recent studies. Bhugra et al. (2017), Duan et al. (2018), and Kim et al. (2020) demonstrated the effectiveness of image-based technology in discriminating between drought-resistant and drought-sensitive plants, with Duan et al. focusing on rice, Bhugra et al. proposing a multi-modal image analysis framework, Kim et al. constructing the imaging platform to analyze drought-tolerant traits. Liang et al. (2024) and Pinho et al. (2024) further expanded this approach, with Pinho using image analysis to distinguish maize cultivars based on water deficit tolerance and Liang using an unmanned aerial vehicle (UAV)-based imagery to evaluated soybean drought tolerance. These studies collectively highlight the potential of image analysis in traditional visual assessment for drought tolerance.
In this study, RGB imaging technique was used to evaluate the drought stress response of Kimchi cabbage seedlings. Through this technique, the leaf area of multiple seedlings in communities was estimated and the drought response was quantified by comparing the leaf area before and after the drought stress. This method makes it easy to assess the drought response and can be an efficient tool to monitor the plant response under drought stress.
2. Experiment 2: Validation of RGB image analysis for drought response assessment in Kimchi cabbage, radish, and lettuce seedlings
To verify the effectiveness of the evaluation method using RGB image analysis, additional drought response evaluations were conducted on Kimchi cabbage, radish, and lettuce seedlings. Four cultivars were used for each crop. As in Experiment 1, the drought stress response by stopping irrigation and the recovery response to rewatering was evaluated after drought stress treatment through single-water treatment.
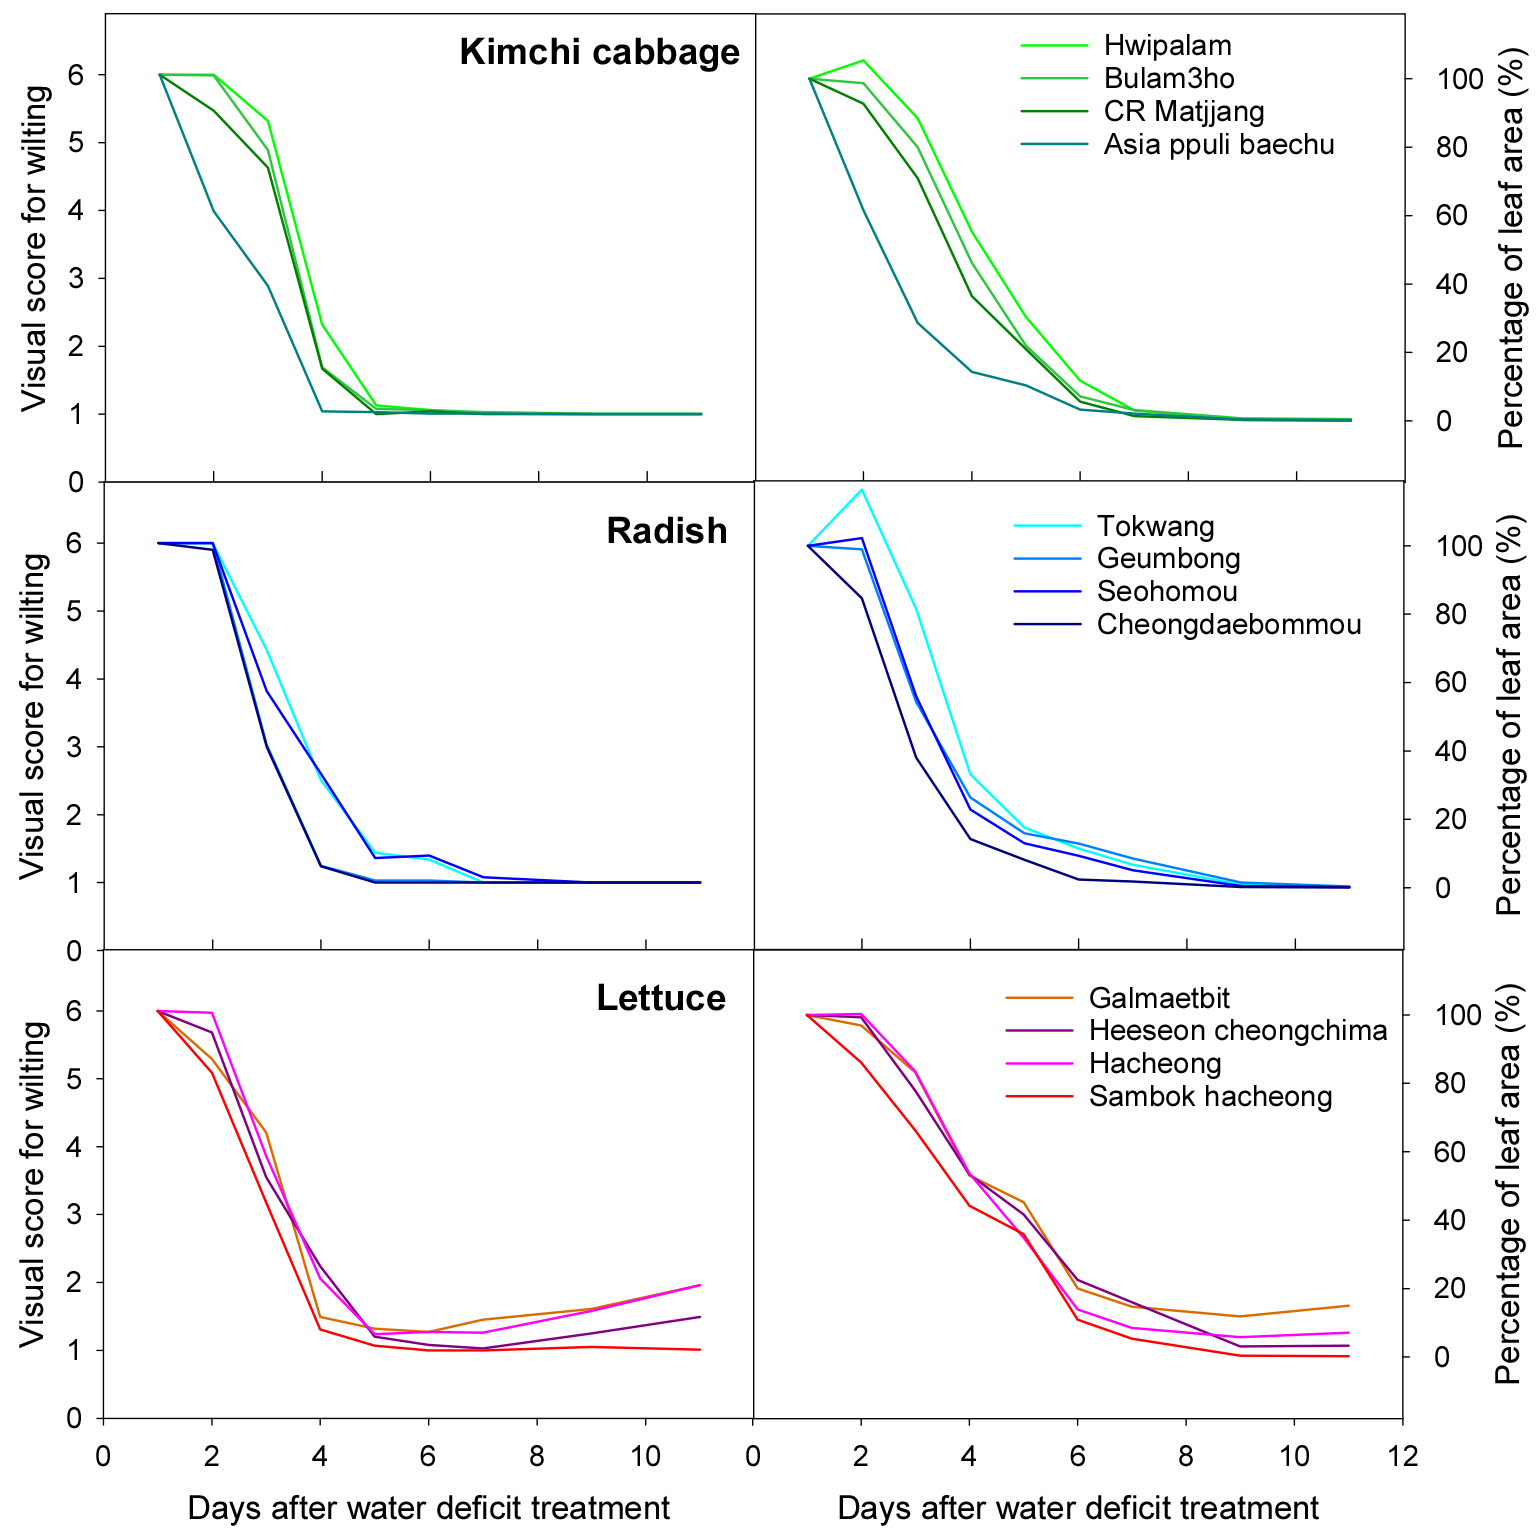
Fig. 5 shows the visual wilting score and PLA value for each crop and variety for a total of 11 days, 4 days after drought stress treatment, and 7 days after rewatering. The visual score for wilting decreased rapidly until the 4th day of drought stress treatment, and the value tended to reach 1 and remained at that value. PLA decreased more gradually and approached 0 on the 6th day of treatment.
The degree of decrease in the visual score for wilting and PLA value differed depending on the variety, and the trend was similar for the visual scores for wilting value and PLA value. In the case of Kimchi cabbage, ‘Hwipalam’ had a relatively high value and ‘Asia ppuli baechu’ had a relatively low value. In the case of radish, ‘Tokwang’ had a high value and ‘Cheongdaebommou’ had a low value. In the case of lettuce, ‘Galmaebit’ had a high value and ‘Sambok hacheong’ had a low value.
The wilting response to drought stress is affected by environmental factors such as temperature and light (Jang et al., 2024). Compared to Experiment 1, wilting due to drought stress treatment progressed faster and was more severe in Experiment 2. Accordingly, most plants did not recover and died despite re-irrigation 4 days after drought stress treatment, which was 3 days earlier than in Experiment 1. The visual evaluation score and PLA values did not show a normal distribution and clustered around a specific value (visual score for wilting: 1). In addition, in the case of lettuce, even when the plants died on the 5th day after the drought stress treatment, some leaves initially remained green and showed high PLA values despite low visual scores (Fig. 6).
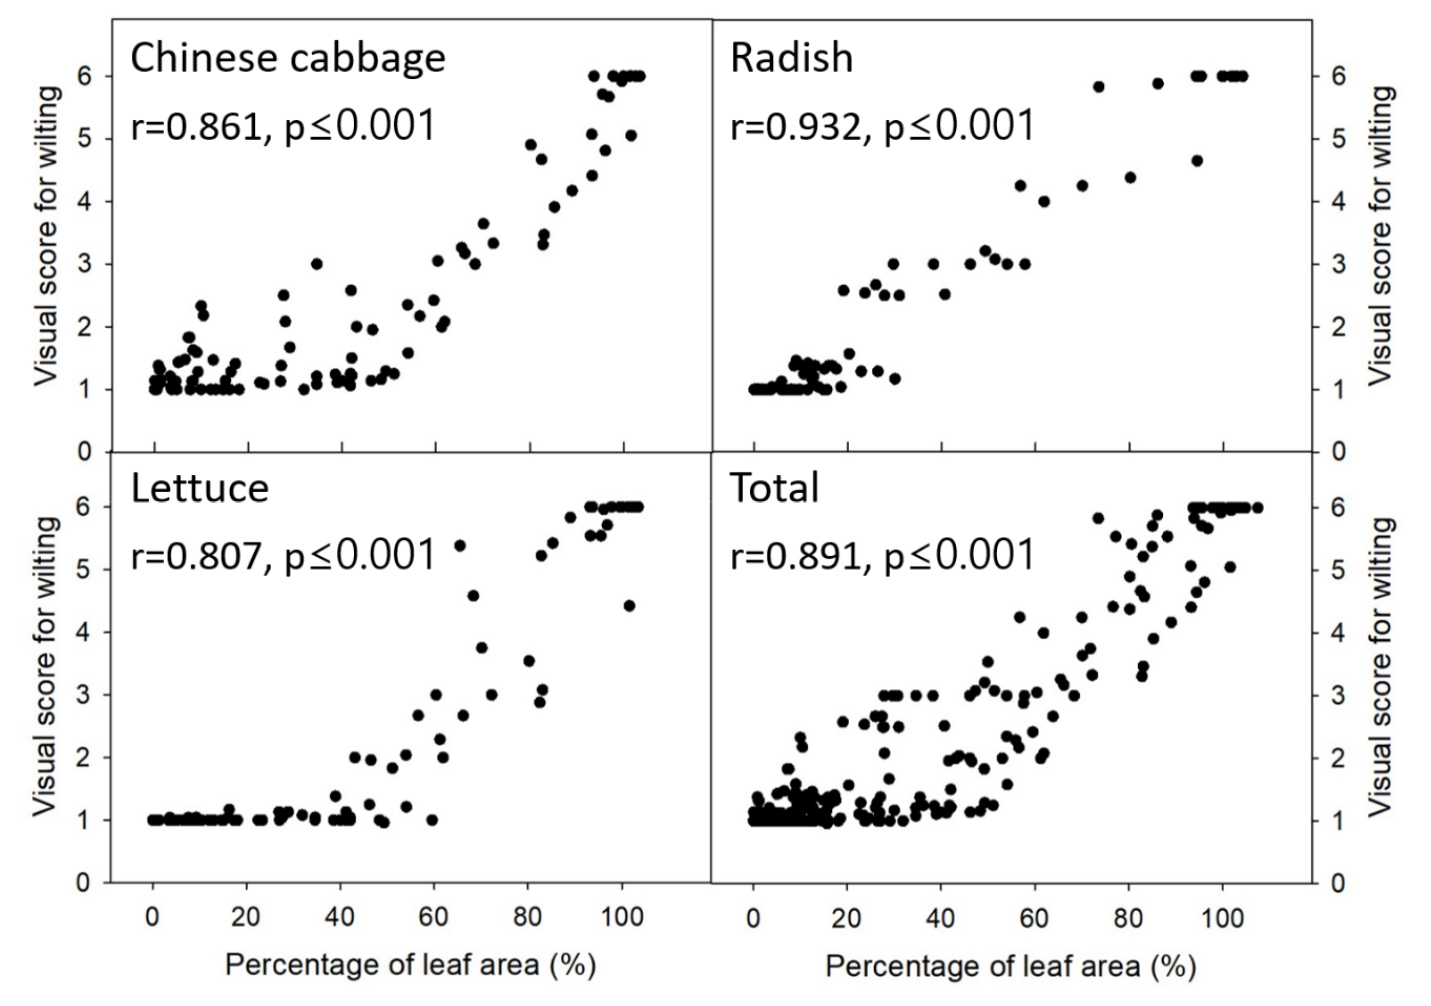
Nevertheless, similar to the results observed in Experiment 1, a strong positive correlation was found between the visual wilting scores and PLA values in kimchi cabbage (r = ‒0.861, p ≤ 0.001), radish (r = 0.932, p ≤ 0.001), and lettuce (r = 0.807, p ≤ 0.001), confirming the applicability of PLA as a drought stress indicator for various crops (Fig. 7). When considering all three crops, the r value was 0.891, indicating a high correlation for various types of seedlings.
Table 2 shows the visual wilting scores and PLA values after 4 days of drought stress treatment and during the 7-day recovery period. Kimchi cabbage and radish showed significant differences in visual wilting scores and PLA values depending on the cultivar, with similar trends. Although there were no differences between the lettuce varieties, the trend values were similar. This indicates consistency in the drought responses of the crops examined.
Table 2.
Visual wilting scores and percentage of leaf area at the end of the 4-day drought stress treatment and the 7-day recovery period, including average values for Kimchi cabbage, radish, and lettuce.
| Breeding line | 4days after drought stress treatment | 7days after rewatering | Averagez | |||
|
Visual score for wilting |
Percentage of leaf area |
Visual score for wilting |
Percentage of leaf area |
Visual score for wilting |
Percentage of leaf area | |
| Kimchi cabbage | ||||||
| Hwipalam | 1.13ay | 30.36a | 1.00a | 0.10b | 1.06a | 15.23a |
| Bulam3ho | 1.08a | 22.00a | 1.00a | 0.46a | 1.05a | 11.23a |
| CR Matjjang | 1.00a | 20.93a | 1.00a | 0.05b | 1.00a | 10.49a |
| Asia ppuli baechu | 1.03a | 10.35b | 1.00a | 0.19b | 1.01a | 5.27b |
| Radish | ||||||
| Tokwang | 1.44a | 17.62a | 1.00a | 0.27ab | 1.22a | 8.95a |
| Geumbong | 1.03ab | 15.94a | 1.00a | 0.37a | 1.01ab | 8.15a |
| Seohomou | 1.36ab | 13.03ab | 1.00a | 0.20ab | 1.18ab | 7.52a |
| Cheongdae bommou | 1.00b | 8.15b | 1.00a | 0.03b | 1.00b | 4.09b |
| Lettuce | ||||||
| Galmaetbit | 1.32a | 45.27a | 1.96a | 15.02a | 1.64a | 30.15a |
| Heeseon cheongchima | 1.20a | 41.68a | 1.49a | 3.30a | 1.34a | 22.49a |
| Hacheong | 1.24a | 34.87a | 1.96a | 7.12a | 1.60a | 20.99a |
| Sambok hacheong | 1.07a | 35.89a | 1.01a | 0.24a | 1.04a | 18.07a |
These results suggest that RGB image analysis is a reliable alternative to traditional visual assessments for assessing drought responses in different crops. Traditional assessment methods rely heavily on subjective visual scores, which are vulnerable to human error and variability. In contrast, RGB image analysis can reduce potential discrepancies by objectively and quantitatively measuring leaf area.
Research has been conducted to develop plant disease detection and classification, growth monitoring, and environmental stress assessment technologies using digital image processing and plant phenotypic analysis (Bock et al., 2010; Furbank and Tester, 2011; Kumaratenna and Cho, 2024). Plant phenotyping studies using automated technology are time- and cost-effective because they allow for high-throughput phenotyping in a short period of time. Recently, the availability of inexpensive digital cameras and accessible image processing software has made it possible to easily apply these assessment methods to research and agriculture.
To expand the development of this technology in the future, it should be applied to crops other than those examined in this study and to various environmental conditions to verify its diversity and robustness. In addition, RGB image analysis can be combined with other imaging processing technologies, such as infrared or hyperspectral imaging, to provide more accurate and precise information on plant stress responses (Jones et al., 2009; Li et al., 2014; Mertens et al., 2023; Walsh et al., 2024).
This study demonstrates the potential of a stress response assessment method based on leaf area changes using RGB image analysis to improve the six-point visual assessment method currently used to evaluate wilting responses to drought stress. This enables a more objective and accurate assessment of plant drought responses, while reducing the effort required for the assessment. Therefore, this study represents an advancement in the assessment methodology of drought stress responses. The high correlation between the conventional visual assessment method and RGB image analysis values for several crops emphasizes the consistency and robustness of the RGB image analysis method, suggesting its potential as a standard tool for assessing responses to drought stress.
Conclusion
This study demonstrated the effectiveness of RGB image analysis as a reliable and objective method for assessing the drought stress response in Kimchi cabbage seedlings and further verified its applicability to radish and lettuce. The strong positive correlation between visual wilting scores and PLA confirmed the robustness of PLA as a drought stress indicator. Despite some variability in recovery responses due to environmental factors, the consistent trends observed across different crops highlight the potential of RGB image analysis to provide accurate and quantitative assessments of drought responses. This method addresses the limitations of conventional visual assessment, reduces subjectivity and variability, and provides a time- and cost-effective alternative for plant phenotyping. Integrating RGB image analysis into drought response assessments could enhance phenotyping efficiency and contribute significantly to the development of drought-tolerant crop varieties. Future studies should explore the scalability of this technique across a range of species and environmental conditions and its potential to be combined with advanced imaging technologies for comprehensive plant health and stress response assessment.


