

Introduction
Materials and Methods
1. Incubation and Growth Conditions of Mushrooms
2. Measurement of Mycelium Occupation Ratio in Bottles with Growth Stage
3. Measurement of CO2 Emission Rates of Substrate and Fruit Bodies
4. CO2 Emission Models of Substrate and Fruit Bodies
5. Statistical Analysis
Results
1. Mycelium Ratio and CO2 Emission Rate of Substrate with Growth Stage
2. Growth and CO2 Emission Rate of Fruit Bodies
3. Total CO2 Emission Rate of One Bottle of King Oyster Mushroom
Discussion
Introduction
Commercial cultivation of mushrooms has sharply increased over the last few decades with the development of cultivation techniques. Among mushrooms such as Button mushroom, Shiitake mushroom, Oyster mushroom, Wood Ear mushroom, Straw mushroom, Enoki mushroom, and Snow Ear mushroom (Kües and Liu, 2000), Oyster mushrooms (Pleurotus genus) are widely cultivated in East Asia regions. The bottle cultivation methods developed since the 1950s have enabled large-scale production for commercial purposes (Kües and Liu, 2000; Yamanaka, 2011; Oh et al., 2017). However, because King Oyster mushrooms (P. eryngii) are typically cultivated in bottles, environmental factors such as temperature, humidity, and CO2 concentration should be adequately controlled (Lee et al., 2003; Kim et al., 2019).
In mushroom cultivation, CO2 is emitted during mycelium incubation, initiation of fruit body, and its growth. The amount of emitted CO2 depends on strain species, weight, moisture content of the medium, incubation temperature, and incubation period (Jang et al., 2007). Mycelium growth and fruit body quality are negatively affected by accumulation of CO2. Indeed, Zadražil (1975) reported that the mycelium growth of Pleurotus mushrooms was suppressed when exposed to high CO2 concentrations of 22-28%. In addition, the expansion of fruit body’s pileus was inhibited at CO2 concentrations of 3,000-9,000 μmol CO2∙mol-1 (Kinugawa et al., 1994), while the quality of the mushroom is optimal at 2,400 μmol∙mol-1 (Ryu et al., 2005). To prevent physiological disorders during mycelium growth and fruit body formation, CO2 concentration level should be adequately controlled (Ryu et al., 2005; Jang et al., 2007; Jang et al., 2009). Quantitative analysis of mushroom CO2 emissions is thus very important, but it has been rarely performed during cultivating stage. When O2 concentration falls below 3%, it was known that the opening of the mushroom pileus was prevented (Kamal et al., 2015). However, the O2 concentration is not an important factor because the O2 concentration is rarely lower than 3% in actual cultivation situations.
Most of the recent studies for modelling the respiration of mushroom have been carried out for quality control after harvest (Azevedo et al., 2015), and Micaelis-Menten equations were mainly used (Iqbal et al., 2009). For modelling during crop growth, Thornley (1970) suggested a linear combination of net photosynthetic rate and plant dry weight. Likewise, a linear combination of dry weight and change rate of dry weight was applied to the mushroom. The respiration rate of each part of mushroom can be represented using dry weight models of the mycelium and fruit bodies (Chanter and Thornley, 1978). However, it is difficult to separate the medium from the mycelium in the middle of bottle cultivation conditions. Thus, in order to quantify the mushroom CO2 emission rate, it is necessary to determine the amount of mycelium in the substrate and use growth models reflecting growth characteristics of fruit bodies. In order to estimate the mycelium abundance, an image processing method utilizing photographs of medium cross- section was developed, in which the percentage change in mycelium as a function of temperature and humidity was expressed by a quadratic equation model (Yang et al., 2012). However, the conventional model described as above did not express how the respiration rate changes depending on temperatures in the substrate including mycelium and the fruit bodies during the cultivation of King Oyster mushroom.
Repeated harvests of fruit bodies from the medium may reduce the number and weight of fruit bodies (Flegg and Smith, 1982; Burton and Noble, 1993). For practical purposes, a method involving cutting the others except 1-2 large fruit bodies, called thinning, is widely used to improve the quality of King Oyster mushroom cultivars (Ryu et al., 2005). Existing mushroom respiration models were described as a single process in which fruit bodies were initiated and harvested. However, it is necessary to reflect the thinning effect because the growth of fruit body changes drastically through the thinning. The objectives of this study were to quantify the CO2 emission rate of King Oyster mushrooms (Pleurotus eryngii (DC.) Quél) as a function of temperature and growth stage during the cultivation including thinning processes and validate the CO2 emission rate model.
Materials and Methods
1. Incubation and Growth Conditions of Mushrooms
King Oyster mushrooms (Pleurotus eryngii (DC.) Quél) cultivated in Ain-Farm (Geumgwangmyeon, Anseong, Korea) were used in this study. The disclosure strain was Sae song-ee No. 2, developed by Gyeonggi Agricultural Research Institute, Korea. The substrate used for the mushrooms consisted of a 1:1:2 mixture of sawdust:corn cob:additives with a water content of 65-68%. The additives consisted of 30% wheat bran, 10% beet pulp, 6% soybean meal, and 4% dried bean curd. For their cultivation, 950 mL polypropylene bottles were filled with 570 g of substrate and sterilized for 60-90 min at 121℃. Inoculated mycelium were incubated for 26-28 days and post-incubated for 5 or 6 days in an incubation room maintained at a temperature of 21-22℃ and a relative humidity of 65-70%. After post-incubation, then the upper surface of the substrate was scraped in order to initiate the fruit bodies. After scraping, the temperature and relative humidity in the incubation room were gradually changed from 18 to 15℃ and from 95 to 80-85%, respectively.
2. Measurement of Mycelium Occupation Ratio in Bottles with Growth Stage
In order to analyze the growth of mycelium and fruit bodies with days after scraping (DAS), fresh and dry weights of the substrate including mycelium were measured at 8, 12, and 15 DAS. To estimate the percentage of mycelium in the substrate, photographs of five cross-sections of cylindrical bottles (at 2 cm intervals) were taken in three replications. Photographs were converted to binary images using Image J (US National Institutes of Health, Bethesda, MD, USA), and the ratios corresponding to the percentages of substrate and mycelium were obtained by calculating the number of pixels. Among the photographs on the inside of Fig. 1, the images below were taken from the section of the substrate at each growth stage. The photographs on the top were processed using Image J to separate the substrate and mycelium.
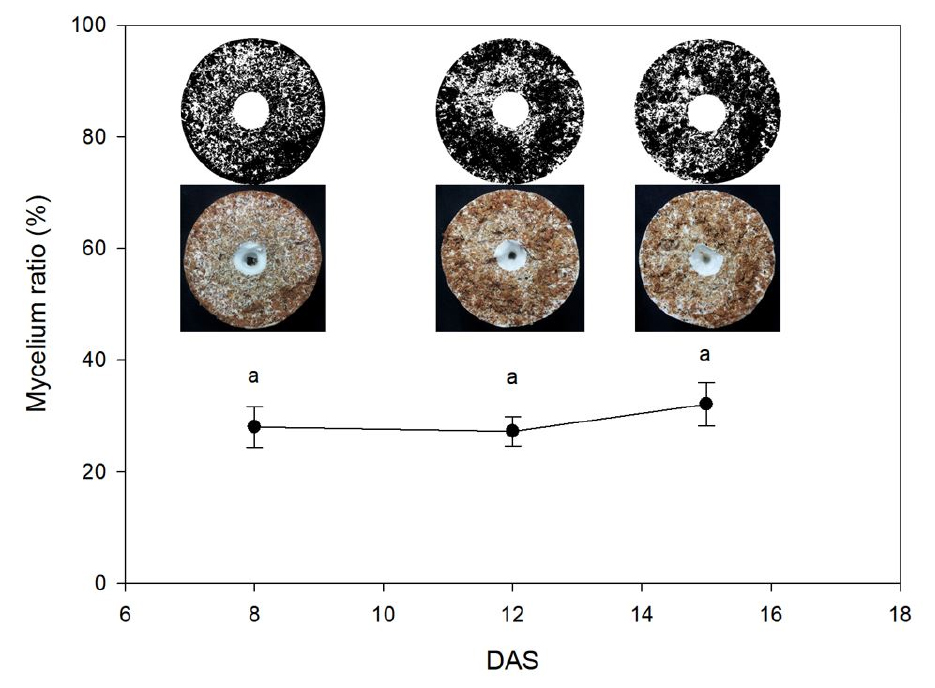
Fig. 1
Change in the mycelium proportion of King Oyster mushrooms as a function of days after scraping (DAS). Data were collected by image processing. Vertical bars represent the mean ± SD (n = 15). Different letters indicate a statistically significant differences (DMRT at p < 0.05). Within whole growth stage, the same letters are not significantly different at 0.05.
3. Measurement of CO2 Emission Rates of Substrate and Fruit Bodies
To measure the CO2 emission rates of the substrate and fruit bodies, mushrooms were cultivated in closed acrylic chambers (1.0 × 0.8 × 0.5 m) maintained at a constant internal temperature (Fig. 2). The CO2 concentrations were measured using an infrared CO2 sensor (LI-820, LI-COR, Lincoln, NE, USA) controlled by a data logger (CR1000, Campbell Scientific, Logan, UT, USA). Mushrooms at 8, 12, and 15 DAS were used for measurement of CO2 emission rates. At 12 DAS, all but the two largest fruit bodies of 2.5 to 3 cm were removed (Fig. 3). Three mushroom bottles corresponding to each growth period were placed in a chamber, and the CO2 emission rate of a bottle was measured. The measurement for each bottle was repeated three times. The CO2 emission rate of mushroom bottles was calculated by measuring the CO2 concentration in the closed chamber every 5 s. After removing fruit bodies, the CO2 emission rate of the substrate including mycelium was measured again using the same method. The CO2 emission rates of the mushrooms at 8, 12, and 15 DAS were measured at temperatures of 16℃, 18℃, 20℃, 22℃, and 25℃.
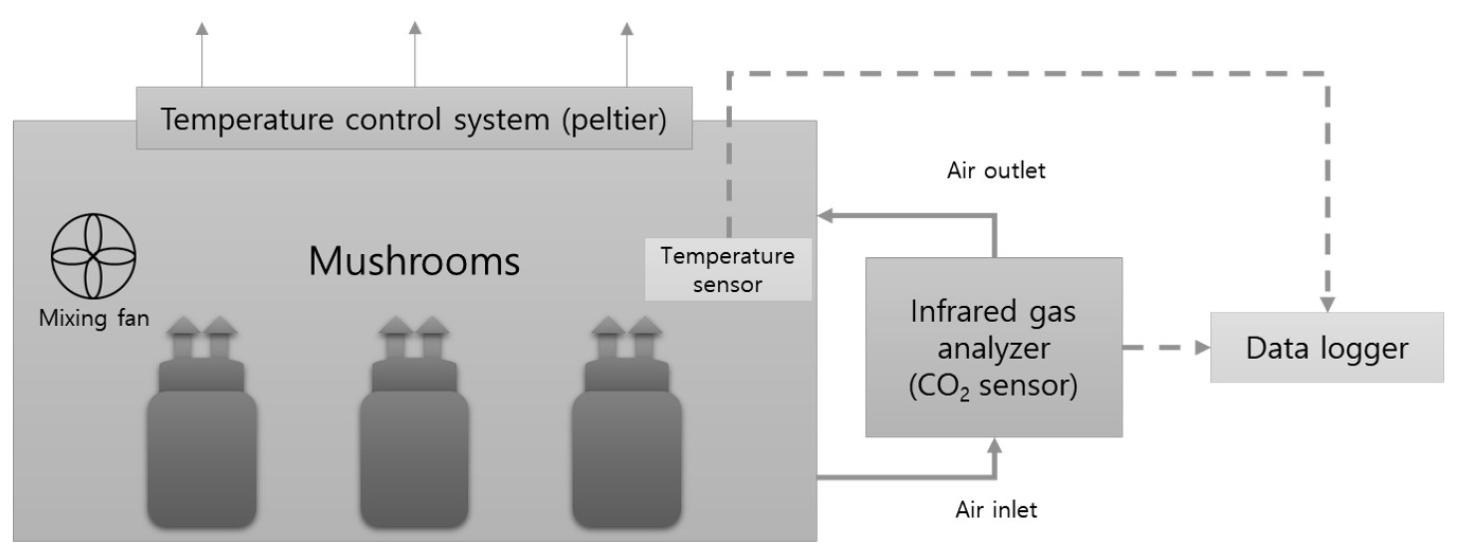
Fig. 2
Measurement of the CO2 emission rate of King Oyster mushrooms using a closed acrylic chamber (1.0 × 0.8 × 0.5 m), in which the internal temperature was controlled at temperatures of 16℃, 18℃, 20℃, 22℃, and 25℃. Three replicate experiments were performed simultaneously using three independent devices.

4. CO2 Emission Models of Substrate and Fruit Bodies
To establish a CO2 emission model of the mushrooms, the measured CO2 emission rates were regressed using the statistical program SPSS (SPSS Inc., Chicago, IL, USA). The CO2 emission rate of the substrate including mycelium as a function of temperature was expressed using Eqn. 1. The symbols used in the models are summarized in Table 1.
Table 1.
Parameters used in respiration models.
Regression analysis was conducted at 8 DAS before thinning and at 12 and 15 DAS after thinning.
Although fruit body growth is known to follow Gompertz equation (Chanter and Thornley, 1978), the fruit bodies of King Oyster mushroom in this study were harvested before reaching the stationary phase and were thus evaluated using an exponential function (Eqn. 2). Specifically, when k is assumed to be constant after thinning, it is possible to express fruit body growth as follows.
Using the measured dry weights of fruit bodies at 8, 9, 11, 12, 13, and 15 DAS, regression analysis was performed with respect to time t.
The respiration rate of fruit bodies, divided into growth respiration and maintenance respiration, was determined by Eqn. 3, which consists of dry weight and its rate of change (Thornley, 1970; Chanter and Thornley, 1978; Cannell and Thornley, 2000). By substituting Eqn. 2 into Eqn. 3, the following model of fruit body respiration was obtained (Eqn. 4).
Since the maintenance and CO2 production coefficients are variables related to temperature, it would be appropriate to express as quadratic forms with a maximum or minimum value using temperature. M or P in Eqn. 4 were defined as a function of temperature as follows:
The respiration of fruit bodies in a mushroom bottle was obtained by the difference between CO2 emission rates before and after cutting fruit bodies.
For validation, the CO2 emission rates of the bottle-cultivated mushrooms at a temperature of 24℃ were measured in the same closed chamber at 7, 9, 11, 13, and 15 DAS. The data at 7, 9, and 11 DAS were used for the validation before thinning and those at 13 and 15 DAS after thinning.
5. Statistical Analysis
All measured data were evaluated using SPSS statistical package (IBM, New York, NY, USA). Data were analyzed with Duncan's new multiple rage test (DMRT) after an analysis of variance (ANOVA) at the significance level of 0.05.
Results
1. Mycelium Ratio and CO2 Emission Rate of Substrate with Growth Stage
The mycelium ratios in the substrate were 28.01 ± 3.64%, 27.23 ± 2.62%, and 32.08 ± 3.91% at 8, 12, and 15 DAS, respectively, and showed no significant difference among the growth stages (Fig. 1). Conversely, the CO2 emission rates of the substrate including mycelium before and after thinning were significantly different (Table 2). Using the parameters of Eqn. 1 (Table 1), the CO2 emission rates of the substrate including mycelium before and after thinning could be quantified. The value of R2 in both cases were 0.79 and 0.87, respectively.
Table 2.
CO2 emission rate (μg CO2∙s-1) of the substrate including mycelium of King Oyster mushrooms with temperature and growth period.
2. Growth and CO2 Emission Rate of Fruit Bodies
The dry weight of fruit bodies exponentially increased with time (Fig. 4). Ws0 and k were 0.009 g and 0.549, respectively. The initial dry weight of fruit bodies after thinning was 0.002, which was obtained from Eqn. 2 using regression analysis. The reduction in initial dry weight was induced by thinning process. The values of R2 in the two cases were estimated as 0.79 and 0.88, respectively. The CO2 emission rates of fruit bodies before and after thinning could be quantified by using the parameters of Eqn. 5 described in Table 3. The values of M and P were expressed as quadratic equations and increased with increase of temperature (Fig. 5).
Table 3.
Regression parameters of CO2 emission rate models of the substrate including mycelium (Rm, Eqn. 1) and the fruit bodies of King Oyster mushrooms (Rf, Eqn. 5) before and after thinning processes.
| Growth stage | Rmz | Rf | ||||||
| a1 | a2 | a3 | R2 | a4 | a5 | a6 | R2 | |
| Before thinning | 143.370 | 0.013 | -137.343 | 0.79 | 0.009 | 0.00494 | 0.549 | 0.79 |
| After thinning | 260.417 | 0.017 | -282.851 | 0.87 | 0.012 | 0.00110 | 0.549 | 0.88 |
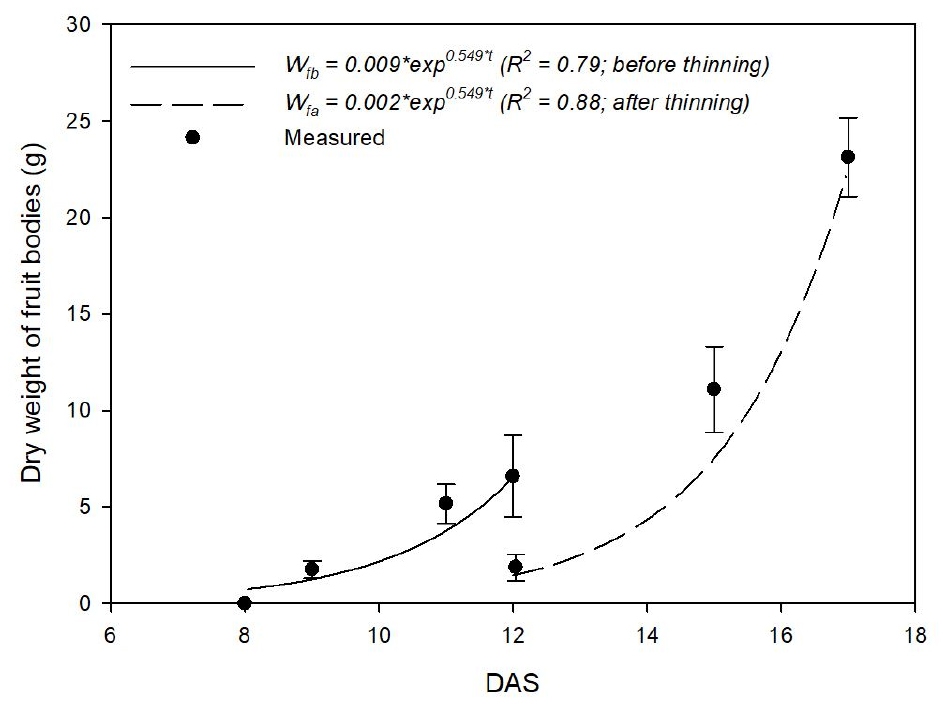
Fig. 4
Change in the dry weight of King Oyster mushroom fruit bodies at a controlled temperature of 18℃ with days after scraping (DAS) and their regressed equations. At 12 DAS, the others of the small fruit bodies were thinned, leaving only two large fruit bodies. Vertical bars represent the mean ± SD (n = 15).

3. Total CO2 Emission Rate of One Bottle of King Oyster Mushroom
The CO2 emission rate with growth stage and temperature for mushroom cultivation bottle was described (Fig. 6) by applying the CO2 emission rate models of the substrate including mycelium and the fruit bodies before and after thinning (Table 3). The total CO2 emission rate of mushroom cultivation bottles exponentially and linearly with growth stage and temperature, respectively. In validation, the CO2 emission rates estimated by the models were in a good agreement with those measured at a temperature of 24℃ (Fig. 7). Before the thinning stage, the CO2 emission rate estimated by the model was close to 60 μg CO2∙s-1, while actual values ranged from 40 to 110 μg CO2∙s-1. After the thinning stage, the estimated values ranged from 130 to 150 μg CO2∙s-1, but the actual values were between 100 and 200 μg CO2∙s-1. The value of R2 in validation was approximately 0.71.


Discussion
Mycelial growth in a limited volume of growth media can be represented by logistic curves that are dependent on the carrying capacity of K+ (Koch, 1975). In a previous study, cross-sectional images of the substrate consisting of growth media and mycelia were used to identify a stationary phase in which the ratio of mycelia to the substrate was constant. The presence of this stationary phase suggested that the mycelia of the mushrooms used in this study were in the latter part of the logistic growth phase. This observation is consistent with a previous research showing that mycelia enter into a stationary phase after six days of incubation (Yang et al., 2010). On the other hand, the mycelial dry weights of Flammulina velutipes was decreased after fruit body initiation (Kitamoto and Gruen, 1976). There are two possible explanations for this observation. First, the nutrients in the medium may be reduced at the onset of the stationary phase as a result of mycelia feeding. Secondly, the nutrients may move to fruit bodies from the mycelia to facilitate fruit body growth (Chanter and Thornley, 1978). Indeed, the presence of an abundance of nutrients in the waste media of mushroom cultivation by-products has led to the use of such waste media as fodder in other applications (Kim et al., 2010). However, under the experimental conditions of this study, the ratio of mycelium in the substrate was not decreased. This result indicates that the mycelial growth stage reaches the stationary phase, meaning that mycelium no longer grew but only fruit body did.
In a previous study based on image processing methods, the proportion of mycelium was determined to be greater than 60% during the entire growth period (Yang et al., 2010), while the present study identified a ratio of 30%. This difference may be due to the specific media used in the two studies: wood and corncob chips were used in the previous study, while the present study utilized sawdust. The difference in color between the media might have also affected our estimation. Therefore, it is necessary to provide a reference for estimating the proportion of mycelium when using image-based measurements. And soil respiration measurement systems can be used to measure the rate of CO2 emission of mycelium in a given substrate (Bekku et al., 1995). Alternatively, respiration rates can be measured within a relatively short time by connecting the infra-red gas analyzer and the chamber (Rochette et al., 1997; Takahashi et al., 2008; Brändle and Kunert, 2019).
During the thinning process, the base parts of medium and fruit body suffer physical damage. Following these wounds, the mushroom respiration rate increases, and plant tissues age (Fonseca et al., 2002). Because the respiration of harvested mushrooms is closely related to their quality, this phenomenon has been quantified (Jacxsens et al., 2001; Pogorzelska-Nowicka et al., 2020). In this study, although there was no significant change in proportion of the mycelium, the CO2 emission rate of mycelium changed significantly (Table 2). However, because cutting a large number of small fruit bodies before thinning caused physical damages, CO2 emission rates of fruit bodies at this stage were overestimated, resulting in a negative relationship between the values of M and P and the temperature. Therefore, the values of M and P obtained after thinning were used in the model. Based on this result, we inferred that the CO2 emission rate increased due to thinning rather than mycelium growth. In cases of Agaricus bisporus and Pleurotus eryngii, the respiration rates of fruit bodies after harvest were 97.02 ± 2.51 at 20℃ (Iqbal et al., 2009) and 300 mL∙kg-1∙h-1 at 18℃ (Azevedo et al., 2015), respectively. In this study, the respiration rate of the mushroom during cultivation was about 22,370 mL∙kg-1∙h-1 at 20℃. There was no study to measure the respiration rate of cultivated mushroom to date, it was inevitable to compare it with the measurement of respiration rate for mushroom after harvest. However, it was possible to predict the CO2 emitted in the substrate and fruit bodies of the mushroom by the respiration model previously developed (Chanter and Thornley, 1978), so that the regression coefficient can be obtained by using the existing respiration model in mushroom cultivation.
Yang et al. (2012) developed a model for the growth of mycelium or fruit bodies of King Oyster mushroom, but the respiration rate model was not associated. In this study, we developed a growth-respiration combined model for the substrate including mycelium and the fruit bodies with regressed R2 values of 0.79 to 0.88. The R2 value of 0.71 was considered a little lower in the validation due to the measurement of three points near 200 μg CO2∙s-1 (Fig. 7). These results appeared because the growth model estimated the dry weight of fruit bodies below the actual value at 15 DAS (Fig. 4). Thus more sophisticated methods for estimating CO2 emissions from substrate and fruit bodies are required. Utilizing CO2 emission rate models established in this study, the increase in CO2 concentration in mushroom cultivation facilities can be estimated and an efficient ventilation strategy will be established. For practical points of view, utilization of CO2 emitted during mushroom cultivation can be used for plant photosynthesis (Kitaya et al., 1994; Tani et al., 1996; Jung et al., 2014).
In this study, we found that the CO2 emission rates of the mushroom exponentially and linearly increased with growth stage and temperature, respectively, and clarified that the CO2 emission rate drastically increased after thinning processes. The CO2 emission rate models developed in this study can be used to control CO2 concentration for adequate mushroom cultivation.
