

Introduction
Materials and Methods
1. Plant materials
2. Growth conditions
3. Glucosinolate analysis
4. RNA Preparation
5. RNA-Seq analysis
6. Statistical analysis
Results
1. Growth characteristics
2. Quantification of individual glucosinolate content in the three kale cultivars
3. Illumina sequencing and de novo transcriptome assembly of the three kale cultivars
4. Identification of glucosinolate and phenylpropanoid synthesis genes from the transcriptomes of the three kale cultivars
5. KEGG pathway enrichment analyses of DEGs
Discussion
Introduction
The Brassicaceae family (cruciferous plant family) contains important vegetables that are widely consumed due to their health-promoting properties, as they contain various nutrients and phytochemicals, such as glucosinolates, phenolic compounds, anthocyanins, carotenoids, and vitamins (Jahangir et al., 2009; Lee et al., 2015). These phytochemicals induce detoxification enzyme activation, scavenge free radicals, alleviate inflammation, stimulate the immune system, inhibit malignant transformation, and regulate the growth of cancer cells (Mayne, 1996). Kale (Brassica oleracea var. acephala), a member of the Brassicaceae family, is widely cultivated in Asia, Europe, and the United States of America. Kale contains a wide range of phytochemicals and is particularly rich in glucosinolates (Ayaz et al., 2006; Lännenpää, 2014).
Glucosinolates and their derivatives assist plants in defense against pathogens and insects; they also exhibit a wide range of pharmaceutical and biological activities associated with a reduced risk of breast, liver, lung, stomach, pancreas, colon, rectum, prostate, and colorectal cancers in humans (Herr and Büchler, 2010). Glucosinolates are divided into three groups: aliphatic, indolic and aromatic glucosinolates (Sønderby et al., 2010; Yan and Chen, 2007). Glucosinolate biosynthesis occurs in three independent phases: side chain elongation of precursor amino acids with an additional methylene group, partial amino acid conversion to form the core structure, and secondary modification of the amino acid side chain (Sønderby et al., 2010).
The content and composition of glucosinolates and phenolic compounds in kale varies depending on the cultivation facility (open field, greenhouse, and vertical farms), environmental conditions (temperature, relative humidity, light intensity, and light quality), and carbon dioxide (CO2) levels (Lee et al., 2016; Neugart et al., 2018). Kale can be easily cultivated in open field using conventional methods; however, the yield and content of glucosinolates and phenolic compounds are not stable and high throughout the year owing to the extremely fluctuating climate conditions and soil-borne diseases (Kim and Chung, 2018), which leads to unsustainable production and unstable prices in the market. Controlled-environment agriculture systems (greenhouses and vertical farms) have been developed to overcome the abovementioned challenges, and kale production has been shifted to these systems to improve plant growth and quality. Controlled-environment agriculture systems control internal environmental conditions, provide multiple-shelf cultivation, reduce resource use (water and fertilizer) and labor cost, and help in preventing disease and pest infestation, leading to fast and sustainable yield, and the abundance of phytochemicals in plants (Kozai, 2013). Kale plants grown in vertical farms have higher glucosinolate content than plants grown in greenhouses and open fields (Kim and Chung, 2018).
Recently, advances in omics approaches have offered new strategies to explore the biosynthetic pathways of secondary metabolites and their molecular roles in plants. Transcriptome analysis can provide a fundamental key to the interpretation of gene function by using regulatory sequence analysis, gene ontology, and pathway information. In this study, we explored the secondary metabolite biosynthesis pathway and its molecular role in three different kale cultivars. Overall, the data obtained from transcriptomic and metabolomic analyses will be helpful for selecting cultivars in vertical farms with respect to glucosinolate production and in investigating gene-to-metabolite connections in kale.
Materials and Methods
1. Plant materials
Three kale cultivars, including green kale (‘Man-Choo Collard’ and ‘Mat-Jjang’) and red kale (‘Red-Curled’), were used as the plant materials in this study.
2. Growth conditions
Seeds of the three cultivars (Asia Seed, Seoul, Korea) were sown in a petri dish, irrigated with distilled water, and grown at 20 ± 5°C under a fluorescent lamp, with a photosynthetic photon flux density (PPFD) of 120 μmol·m-2·s-1 and a photoperiod of 12 h. Two days after sowing, the seedlings were transplanted on a cultivation panel (25 × 17.5 × 3 cm, L × W × H) and irrigated with distilled water. Seven days after sowing, Hoagland nutrient solution was filled in a plastic container (45 × 28 × 12 cm, L × W × H), and added to three trays (for each cultivar) in a cultivation panel (41 × 23.5 × 2.5 cm, L × W × H). A total of 45 plants per cultivar were cultivated in a deep flow technique system under the following conditions: temperature, 20 ± 5°C; PPDF, 140 μmol·m-2·s-1; and photoperiod, 12 h. Hoagland nutrient solution (1 L; pH of 6.0, electrical conductivity of 1.0 dS·m-1) was supplied once every 3 days.
The plants were harvested for growth measurements at six weeks after sowing. The shoots and roots of each plant were separated, and fresh weight was measured using an electronic scale (PAG214C, Ohaus Corporation, NJ, USA). The shoots and roots were dried in an oven (WOF-155, DAIHAN, Korea) at 70°C for 72 h, and their dry weights were measured. The leaf area was measured using an area meter (LI-3100C, Li-Cor, Lincoln, NE, USA).
3. Glucosinolate analysis
The samples were prepared for glucosinolate analysis using the method described by Jo et al. (2018). The freeze- dried powder samples (50 mg) and 70% methanol (1 mL) were mixed in a 2 mL screw-cap tube, extracted in a water bath at 75°C for 1 h, and centrifuged at 10,000 × g at 4°C for 20 min. After centrifugation, the supernatant was collected in a 2 mL tube and the pellet was subjected to another round of extraction using the same procedure. The collected supernatant was loaded onto a mini-biospin chromatography column filled with 0.7 mL DEAE-Sephadex A25 (Sigma- Aldrich, St. Louis, MO, USA) slurry for desulfation. This slurry was pre-activated with 0.1 M sodium acetate pH 4.0. (Sigma-Aldrich, St. Louis, MO, USA). The desulfurization of intact glucosinolate was performed using 200 µL of aryl sulfatase (EC 3.1.6.1, H-1 type from Helix pomatia; Sigma- Aldrich, St. Louis, MO, USA). The column was desulfurized at room temperature for 18 h, eluted three times with 0.5 mL of HPLC grade distilled water, filtered through a 0.2 μm polytetrafluoroethylene syringe filter, and stored in 1.5 mL vials. The samples (10 μL) were analyzed using an Agilent 1260 HPLC system (Agilent Technologies, Santa Clara, CA, USA) equipped with a diode array detector (DAD) set at 229, using an Acquity UPLC BEH C18 column (1.7 µm, 2.1 × 100 mm; Waters Co., Milford, MA, USA); individual glucosinolates (GSLs) were separated by gradient elution of solvent A (100% distilled water) and solvent B (20% acetonitrile in water) at a flow rate of 0.2 mL·min-1. The gradient program was as follows: a linear step from 1 to 30% solvent B within 6 min, 30-50% solvent B within 10 min, 50-99% solvent B for 11 min, followed by a constant condition for up to 14 min, a rapid decline to 1% solvent B for up to 15 min, and an isocratic flow of 1% solvent B for up to 25 min. A pure commercial glucosinolate standard was desulfurized, using the same pretreatment process as the sample, and used for the identification and quantification of GSL peaks (µmol·g−1).
4. RNA Preparation
The third leaves of the three kale cultivars were freeze- dried and crushed using an Automill machine (TK-AM7, Tokken Inc., Kashiwa, Japan) for 2 min for RNA-Seq analysis and quantitative reverse transcription-polymerase chain reaction (qRT-PCR). Total RNA was isolated using a RNeasy Plant Mini Kit (Qiagen N.V., Venlo, The Netherlands) following the manufacturer’s instructions. RNA quantity and purity were determined by evaluating the absorbance at 260 nm and 260/280 nm absorbance ratio, respectively, using a spectrophotometer (NanoDrop Lite, Thermo Fisher Scientific, Waltham, MA, USA).
5. RNA-Seq analysis
Raw data were extracted using the software provided by Agilent Feature Extraction Software (v11.0.1.1). The raw data for the same gene were summarized automatically using the Agilent feature extraction protocol to generate a raw data text file, providing expression data for each gene probed on the array. Array probes with FLAG A in the samples were filtered out. The selected gProcessedSignal value was logarithmically transformed and normalized using the quantile method. The statistical significance of the expression data was determined using fold change. Hierarchical cluster analysis was performed using complete linkage and Euclidean distance as similarity measures. Gene enrichment and functional annotation analysis for the significant probe list was performed using Kyoto Encyclopedia of Genes and Genomes (KEGG) pathway enrichment analyses (http://kegg.jp). All data analysis and visualization of differentially expressed genes were conducted using R 3.0.2 (www.r-project.org).
6. Statistical analysis
All recorded parameters were collected and obtained from five harvested plants (n = 5). Analysis of variance was performed for statistical analysis, using the SAS 9.2 program (SAS Institute Inc., Cary, NC, USA) with, and one-way ANOVA followed by Tukey’s test was used to derive the significant differences for all treatments verified with p < 0.05.
Results
1. Growth characteristics
The three kale cultivars grown under controlled environmental conditions showed significant differences in growth response (Fig. 1). The shoot fresh and dry weights of both the green kale cultivars were higher than those of the red kale cultivar (Fig. 1A, 1B). In particular, shoot fresh and dry weights of ‘Man-Choo’ were 1.4- and 1.7-fold higher than those of ‘Red-Curled’ plants, respectively. The leaf area showed a similar trend to that of the shoots, with a higher leaf area (1.6 times) in ‘Man-Choo’ than in ‘Red-Curled’ plants (Fig. 1C). Non-significant differences were observed in the root fresh and dry weights among the three cultivars (Fig. 1D, 1E).
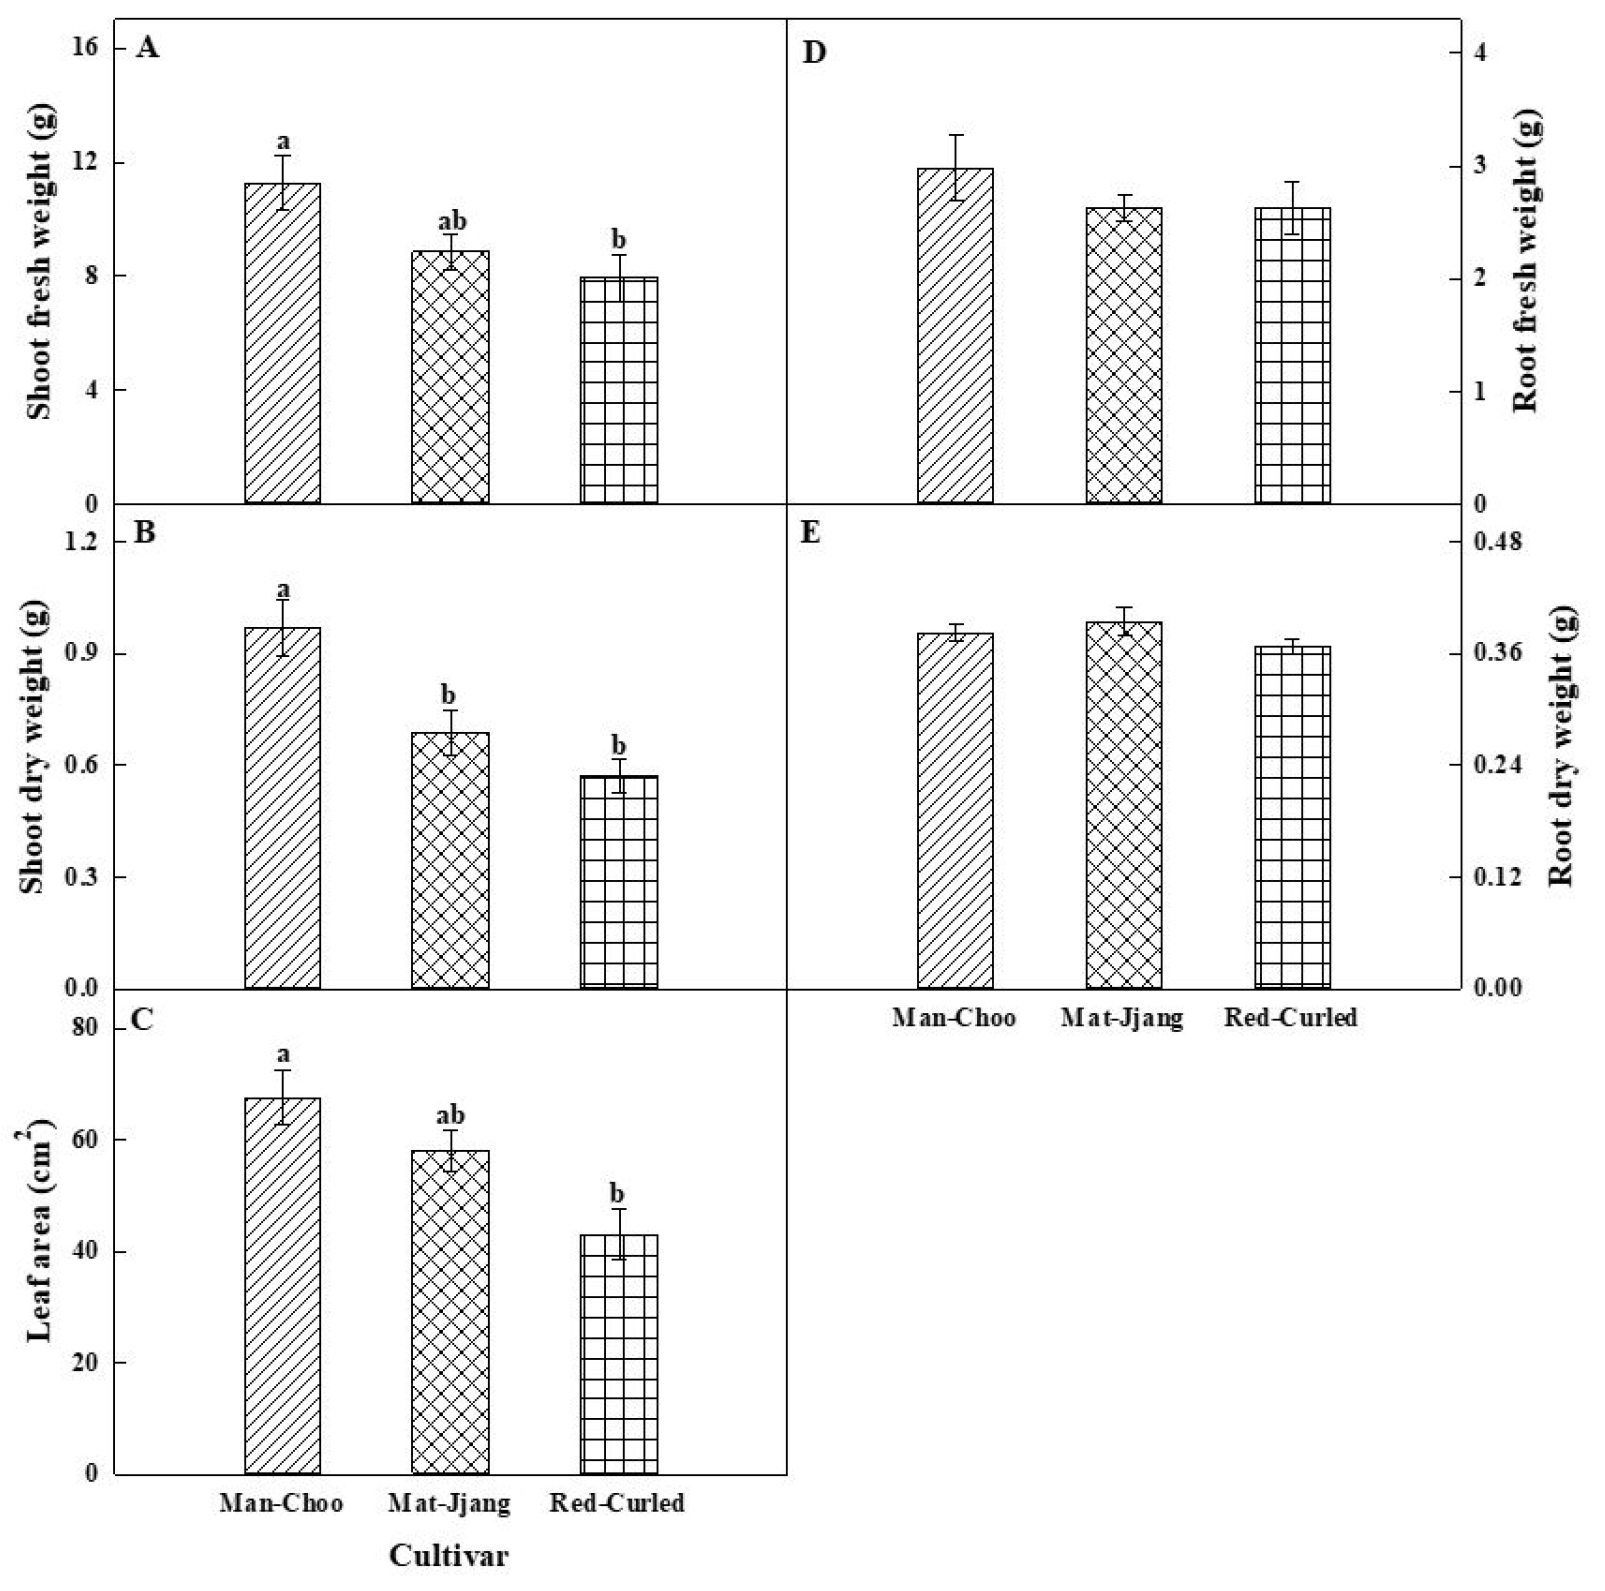
Fig. 1.
Shoot fresh (A) and dry (B) weights, leaf area (C), and root fresh (D) and dry (E) weights of three kale cultivars, namely ‘Man-Choo’, ‘Mat-Jjang’, and ‘Red-Curled’, grown in a vertical farm for 6 weeks. Different letters within a figure indicates statistically significant using Tukey’s test at p > 0.05.
2. Quantification of individual glucosinolate content in the three kale cultivars
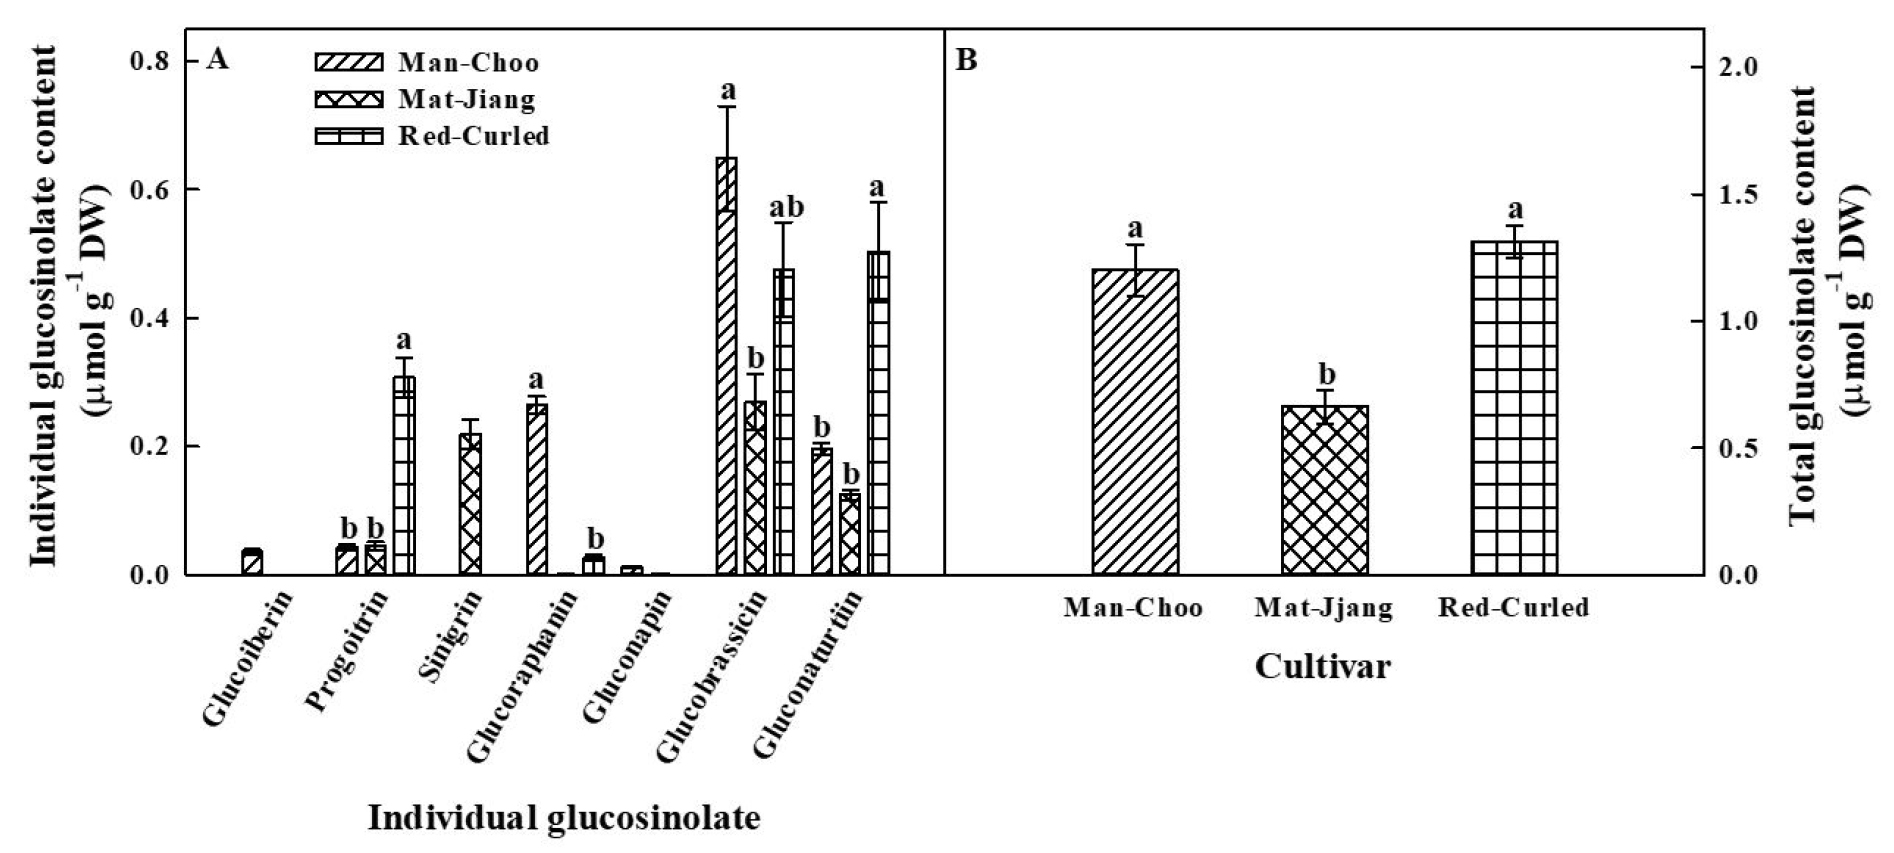
The content of individual glucosinolates in the three kale cultivars was measured, and seven individual glucosinolates were detected in some of the three kale cultivars (Fig. 2A). Glucoiberin (IBR) and sinigrin (SIN) were only identified in ‘Man-Choo’ and ‘Mat-Jjang’ plants, respectively. Gluconapin (NAP) was detected in ‘Man-Choo’ and ‘Mat-Jjang’ plants. Progoitrin (PRO), glucoraphanin (GRA), glucobrassicin (BRA), and gluconasturtiin (NAS) were detected in all three cultivars, with BRA and NAS accounting for the highest content among individual glucosinolates. The content of PRO in ‘Red-Curled’ plants was approximately 7.3- and 6.9-fold higher than in ‘Man-Choo’ and ‘Mat-Jjang’ plants, respectively. ‘Red-Curled’ plants also had 2.6- and 4.03-fold higher NAS content than ‘Man-Choo’ and ‘Mat-Jjang’ plants, respectively. The contents of GRA and BRA were the highest in ‘Man-Choo’ plants, whereas the contents of individual glucosinolates were relatively low in ‘Mat-Jjang’ plants. Significantly (p < 0.05) higher total glucosinolate content was observed in ‘Man-Choo’ and ‘Red-Curled’ plants than in ‘Mat-Jjang’ plants (Fig. 2B).
3. Illumina sequencing and de novo transcriptome assembly of the three kale cultivars
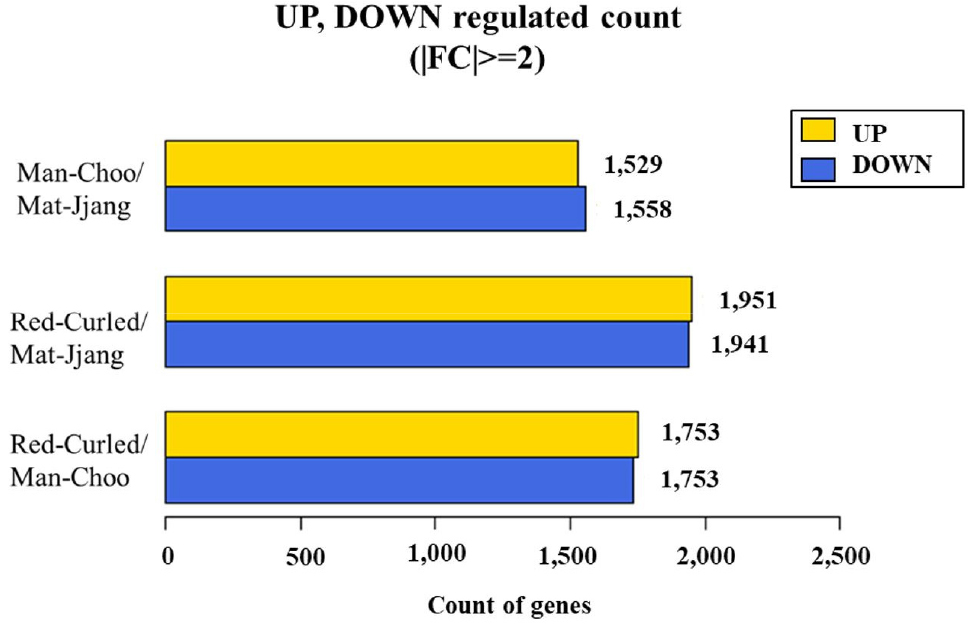
RNA sequencing analysis was performed using total RNA extracted from the three kale cultivars (Table 1). The cDNA fragments of the three kale cultivars obtained through RNA-seq were mapped to a known genomic DNA reference genome (GCF_000695525.1_BOL) using the HISAT2 program, which can perform splice junction processing with coverages of 85% and 82%, respectively. Differentially expressed genes (DEGs) and the number of up- and down-regulated genes based on fold change of expression level for each comparative combination were defined (Fig. 3). A total of 3,087 DEGs with 1,529 upregulated genes were found when the transcriptome profile of ‘Man-Choo’ plants was compared to that of ‘Mat-Jjang’ plants; 3,892 DEGs with 1,951 upregulated genes were obtained when the transcriptome profile of ‘Red-Curled’ plants was compared to that of ‘Mat-Jjang’ plants; and 3,488 DEGs with 1,753 upregulated genes were obtained when the transcriptome profile of ‘Red-Curled’ plants was compared to that of ‘Man-Choo’ plants.
Table 1.
Summary of the sequence assembly after Illumina sequencing of the three kale cultivars.
4. Identification of glucosinolate and phenylpropanoid synthesis genes from the transcriptomes of the three kale cultivars
Transcriptome analysis of kale cultivars revealed genes involved in the biosynthesis of secondary metabolites, including glucosinolates, phenolics, and anthocyanins (Table 2 and 3). Seven genes encoding enzymes related to the glucosinolate biosynthetic pathway from the transcriptome data of kale cultivars were identified, including isopropylmalate dehydratase (IPMDH), branched-chain-amino-acid aminotransferase 6 (BCAT6), cytochrome P450 79B1 (CYP79B1), glutathione S-transferase Z1 (GSTF), flavin-containing monooxygenase FMO GS-OX5-like (FMOGS-OX5), cytosolic sulfotransferase 16 (SOT16), and UDP-glycosyltransferase 72B3 (UGT72B2) (Table 2). The expression of most of these genes in ‘Man-Choo’ plants was decreased compared to that in ‘Mat-Jjang’ plants, except for the expression of FMOGS-OX5 and UGT72B2 genes, which increased by 2.09- and 3.93-fold, respectively. The expression of all genes in ‘Red-Curled’ plants was increased compared to that in ‘Mat-Jjang’ plants, and the expression of SOT16 and UGT72B2 genes displayed the highest increase, i.e., 2.76- and 2.46-fold, respectively. Comparative analysis of the transcriptomes of ‘Red-Curled’ and ‘Man-Choo’ plants revealed an increase in the expression of glucosinolate synthesis genes in ‘Red-Curled’ plants, with the SOT16 gene displaying the highest increase of 5.19-fold.
Table 2.
Differential expression of genes related to glucosinolate biosynthesis and phenylpropanoid in the three kale cultivars. Values indicate log2 ratios obtained based on the RNA-seq data.
| Gene symbol | Entrez gene ID | Description | Fold change (log2 ratio) | ||
|
Man-Choo / Mat-Jjangz |
Red-Curled / Mat-Jjang |
Red-Curled / Man-Choo | |||
| Glucosinolate transcript | |||||
| IPMDH | 106342873 | isopropylmalate dehydratase | ‒2.25 | 1.63 | 3.67 |
| BCAT6 | 106296539 | branched-chain-amino-acid aminotransferase 6 | ‒1.03 | 1.96 | 2.01 |
| CYP79B1 | 106302779 | cytochrome P450 79B1 | ‒1.58 | 1.78 | 2.81 |
| GSTF | 106307008 | glutathione S-transferase Z1 | ‒1.01 | 1.98 | 2.00 |
| FMOGS-OX5 | 106312190 | flavin-containing monooxygenase FMO GS-OX5-like | 2.09 | 1.07 | ‒1.95 |
| SOT16 | 106327830 | cytosolic sulfotransferase 16 | ‒1.88 | 2.76 | 5.19 |
| UGT72B2 | 106343816 | UDP-glycosyltransferase 72B3 | 3.93 | 2.46 | ‒1.60 |
| Phenylpropanoid transcript | |||||
| PAL2 | 106319945 | phenylalanine ammonia-lyase 2-like | ‒1.92 | 2.33 | 4.47 |
| CHS | 106327741 | chalcone synthase | ‒2.43 | ‒1.29 | 1.88 |
| 4CL3 | 106296384 | 4-coumarate--CoA ligase 3 | 1.18 | 2.06 | 1.73 |
| COMT | 106301103 | caffeic acid 3-O-methyltransferase-like | 1.61 | 2.39 | 1.49 |
| DFR | 106315758 | dihydroflavonol-4-reductase | ‒3.43 | ‒1.17 | 2.93 |
Table 3.
Upregulation or downregulation of genes related to the biosynthesis of secondary metabolites and glucosinolates in the three kale cultivars based on the KEGG database. Values indicate log2 ratios obtained based on the RNA-seq data.
| Entrez gene ID | Description (product) | Fold change (log2 ratio) | ||
|
Man-Choo / Mat-Jjangz |
Red-Curled / Mat-Jjang |
Red-Curled / Man-Choo | ||
| KEGG pathway in biosynthesis of secondary metabolites | ||||
| 106296887 | caffeic acid 3-O-methyltransferase-like | 15.00 | 1.64 | ‒9.13 |
| 106311835 | bifunctional L-3-cyanoalanine synthase/cysteine synthase C1, mitochondrial | 5.09 | 7.83 | 1.54 |
| 106300136 | lipoxygenase 2, chloroplastic-like | ‒1.53 | 13.56 | 20.70 |
| 106311776 | catalase-3-like | 4.46 | 7.02 | 1.57 |
| 106335545 | aspartate aminotransferase 3, chloroplastic | 2.43 | 7.02 | 2.89 |
| 106301303 | aldehyde dehydrogenase family 3 member F1-like | ‒2.04 | 6.54 | 13.32 |
| 106296631 | diaminopimelate epimerase, chloroplastic | 3.89 | 6.00 | 1.55 |
| 106294572 | 3-ketoacyl-CoA synthase 1 | 2.93 | 5.62 | 1.92 |
| 106307617 | putative glucose-6-phosphate 1-epimerase | 1.16 | 5.49 | 4.73 |
| 106334854 | 2-oxoglutarate dehydrogenase, mitochondrial | 3.13 | 5.44 | 1.74 |
| 106295308 | 3-ketoacyl-CoA synthase 5 | 1.14 | 5.36 | 4.71 |
| 106335697 | probable fructose-bisphosphate aldolase 2, chloroplastic | 2.65 | 5.10 | 1.93 |
| 106312287 | 3-ketoacyl-CoA synthase 1 | ‒1.46 | 4.96 | 7.23 |
| 106301496 | probable tyrosine decarboxylase 2 | ‒3.00 | 2.07 | 6.20 |
| 106295733 | 3-ketoacyl-CoA synthase 17 | ‒1.22 | 4.96 | 6.04 |
| 106311920 | phenylalanine ammonia-lyase 2 | ‒2.44 | 2.29 | 5.59 |
| 106307643 | tryptophan synthase alpha chain, chloroplastic | ‒1.68 | 3.02 | 5.08 |
| 106308419 | protein ECERIFERUM 1 | ‒1.22 | 4.09 | 5.01 |
| KEGG pathway in glucosinolate biosynthesis | ||||
| 106312180 | cytochrome P450 83B1 (CYP 83A1) | ‒11.44 | 1.84 | 21.03 |
| 106327830 | cytosolic sulfotransferase 16 (SOT16) | ‒1.88 | 2.76 | 5.19 |
| 106342873 | 3-isopropylmalate dehydratase large subunit | ‒2.25 | 1.63 | 3.67 |
| 106302779 | cytochrome P450 79B1 (CYP 79B2) | ‒1.58 | 1.78 | 2.81 |
| 106296616 | cytosolic sulfotransferase 16-like (ST5a) | 1.35 | 3.78 | 2.79 |
| 106343089 | dihomomethionine N-hydroxylase-like (CYP79F1) | ‒1.87 | 1.41 | 2.64 |
| 106306752 | S-alkyl-thiohydroximate lyase SUR1 (SUR1) | 1.20 | 3.12 | 2.60 |
| 106294846 | UDP-glycosyltransferase 74B1 (UGT74B1) | 1.84 | 2.47 | 1.34 |
Differentially expressed genes were defined as genes with log2 fold change of ≤2 or ≥2 and an FDR (false discovery rate) of ≤0.01. Positive and negative values for increases of ≥2.0 or ≤2.0 are highlighted pink or green, respectively. To analyze reliable data, noise was excluded (signal evaluation).
Five genes were related to the phenylpropanoid synthesis pathway, including phenylalanine ammonia-lyase 2-like (PAL2), chalcone synthase (CHS), 4-coumarate-CoA ligase 3 (4CL3), caffeic acid 3-O-methyltransferase-like (COMT), and dihydroflavonol-4-reductase (DFR) genes. The expression levels of these genes were compared between each combination of two cultivars. The expression of PAL2, CHS, and DFR genes decreased in ‘Man-Choo’ plants compared to that in ‘Mat-Jjang’ plants, whereas the expression of 4CL3 and COMT genes was slightly increased. Comparative analysis of the transcriptomes of ‘Red-Curled’ and ‘Mat-Jjang’ plants revealed that the expression levels of PAL, 4CL3, and COMT genes were 2.33-, 2.06-, 2.39-fold higher than those in ‘Mat-Jjang’ plants. The expression of all identified phenylpropanoid synthesis genes was higher in ‘Red-Curled’ plants than in ‘Man-Choo’ plants.
5. KEGG pathway enrichment analyses of DEGs
Gene functions with an emphasis on the biological pathways were categorized using the KEGG pathway enrichment analyses. A total of 3,910 unigenes were assigned to 130 KEGG pathways. The largest number of unigenes was classified into metabolic pathways (boe01100, 774 genes, and 19.79%) and biosynthesis of secondary metabolites (boe01110, 365 genes, and 9.33%). Meanwhile, eight genes were involved in the glucosinolate synthesis pathway (boe00966, 0.2%), including cytochrome P450 83B1 (CYP 83A1), cytosolic sulfotransferase 16 (SOT16), 3-isopropylmalate dehydratase large subunit, cytochrome P450 79B1 (CYP 79B2), cytosolic sulfotransferase 16-like (ST5a), dihomomethionine N-hydroxylase-like (CYP79F1), S-alkyl-thiohydroximate lyase SUR1 (SUR1), and UDP- glycosyltransferase 74B1 (UGT74B1) genes. Most of these genes in ‘Man-Choo’ plants were downregulated compared to those in ‘Mat-Jjang’ plants, except for ST5, SUR1, and UGT74B1 genes. In contrast, these genes were upregulated in ‘Red-Curled’ plants compared to that in ‘Mat-Jjang’ and ‘Man-Choo’ plants. Similar results were obtained for some of the genes listed to be involved in the biosynthesis of secondary metabolites.
Discussion
In the present study, three kale cultivars grown under controlled environmental conditions exhibited an efficient increase in growth and development. However, the response of growth rate was slightly different among the three cultivars. Both green kale cultivars (‘Man-Choo’ and ‘Mat- Jjang’) showed higher shoot fresh and dry weights and leaf area than the ‘Red-Curled’ cultivar. These findings are in accordance with the results obtained for growth of different green and red cultivars of other species. A previous study also reported faster growth of green perilla cultivars than that of red perilla cultivars grown in walk-in type vertical farms, under the same electrical conditions of nutrient solution, light intensity, and light quality (Lu et al., 2017; Nguyen and Oh, 2021). The differences in growth between the cultivars could be closely related to their photosynthetic processes. Red leaf cultivars normally contain abundant anthocyanins, which can protect the photosynthetic apparatus from pho-toinhibition (Smillie and Hetherington, 1999). However, this property of anthocyanins can cause a reduction in the net photosynthetic rate of red leaf plants. Further, photosynthesis in red leaves is lower than that in green leaves (Burger and Edwards, 1996); which leads to lower growth of red-leaf vegetables than that of green-leaf vegetables.
Kale contains significantly higher amounts of indolic or aliphatic glucosinolates, although the ratio varies depending on the cultivar. In the present study, the content of glucobrassicin, an indolic glucosinolate, was found to be the highest among the individual glucosinolates in all three kale cultivars. Glucobrassicin is a common indolic glucosinolate that exhibits anti-breast cancer properties (Palani et al., 2016). Various aliphatic glucosinolates were detected in each of the three kale cultivars; however, glucoiberin and gluconapin were only found in ‘Man-Choo’ plants, sinigrin was only found in ‘Mat-Jjang’ plants, glucoraphanin was detected in ‘Man-Choo’ plants (highest content) and ‘Red-Curled’ plants (lowest content), and progoitrin had the highest content in ‘Red-Curled’ plants compared to that in ‘Man-Choo’ and ‘Mat-Jjang’ plants. These aliphatic glucosinolates have numerous therapeutic benefits, such as anticancer, antifungal, antioxidant, anti-inflammatory, and wound-healing properties (Awasthi and Saraswathi, 2016; Liu et al. 2012). Progoitrin was identified as the aliphatic glucosinolate with the highest ratio of abundance in red kale compared to that in green kale, while sinigrin was the most disproportionately abundant glucosinolate in green kale compared to that in red kale (Jeon et al., 2018). ‘Red-Curled’ cultivar showed lower growth and development than the green kale cultivars, but had a higher total glucosinolate content. Previous studies reported that red leaf kale contains higher levels of total carotenoids, phenolics, anthocyanins, and glucosinolates than green leaf kale (Jeon et al., 2018; Waterland et al., 2019).
The content and composition of glucosinolates are regulated by approximately 105 genes in the Brassica oleracea L. genome; however, these genes are differently expressed or unexpressed in different species or cultivars of B. oleracea (Yi et al., 2015). The functions of the key genes involved in the glucosinolate biosynthetic pathway, such as BACT, MAM, CYP79F, CYP83, UTG74B, and SOT genes, have been confirmed in Arabidopsis, cabbage, and broccoli (Naur et al., 2003; Piotrowski et al., 2004). Methionine elongation is initiated by methylthioalkylmalate synthase (MAM), bile acid transporter5 (BAT5), branched chain aminotransferase (BCAT), isopropyl malate isomerase (IPMI), and isopropyl malate dehydrogenase (IPM-DH) (Sawada et al., 2009a; Sawada et al., 2009b). The core structures of glucosinolates are formed via catalysis by the CYP79 enzymes of the cytochrome P450 family (CYP79F1 and CYP79F2 for the aliphatic group, CYP79B2 and CYP79B3 for the indolic group, and CYP79A1 for aromatic glucosinolates) (Hull et al., 2000; Mikkelsen et al., 2000), CYP83 enzyme family (CYP83A1 for aliphatic and CYP83B1 for indolic) (Bak and Feyereisen, 2001), C-S lyase (SUR1) (Mikkelsen et al., 2004), glucosyltransferase (UGT74; UGT74B1 and UGT74C1 for aliphatic and UGT74B1 for indolic) (Grubb et al., 2004; Grubb et al., 2014), and sulfonyltransferases (SOTs) (SOT17 and SOT18 for aliphatic, SOT16 for indolic) (Piotrowski et al., 2004). In the present study, most of these genes were identified to be involved in glucosinolate biosynthesis in the three kale cultivars based on the KEGG pathway analysis. In addition, the glucosinolate content in the three kale cultivars showed a pattern similar to that of the expression of glucosinolate synthesis genes. For example, CYP83B1 and SOT6 are involved in the synthesis of both indolic and aromatic glucosinolates (Bak and Feyereisen, 2001; Grubb and Abel, 2006; Sønderby et al., 2010), and these genes were significantly upregulated in ‘Red-Curled’ kale, which corresponded to the higher content of glucobrassicin and gluconasturtiin in ‘Red-Curled’ kale. All identified genes in Red-Curved kale were upregulated compared to those in the green kale cultivars, which corresponded to the higher total glucosinolate content in the red cultivar than that found in the green cultivars.
In conclusion, this study revealed differences in the transcriptome and metabolome of the three kale cultivars. Eight genes involved in glucosinolate synthesis exhibited differential expression in the three cultivars, and some genes were found to be involved in secondary metabolite synthesis. Seven glucosinolates, including glucoiberin, sinigrin, gluconapin, gluconasturtiin, progoitrin, glucoraphanin, and glucobrassicin, were detected among these cultivars, and glucobrassicin was identified as the most common glucosinolate. For cultivation in vertical farms, the green ‘Man-Choo’ cultivar had higher growth and development and relatively higher total glucosinolate content, while the ‘Red-Curled’ cultivar had the lowest growth but contained the highest total glucosinolate content. Overall, metabolomic and transcriptomic analyses may provide useful information for selecting cultivars for cultivation in vertical farms.
