


Introduction
Materials and Methods
1. Plant material and growing conditions
2. Experimental layout and sampling
3. Measurements and derived variables
4. Data quality control
5. Statistical analysis
Results and Discussion
1. Growth trajectories over thermal time
2. Cultivar differentiation at final harvest
3. Allometric relationships
4. Parameters for crop growth model input
Conclusion
Introduction
Kimchi cabbage (Brassica rapa ssp. pekinensis) is a staple vegetable whose supply and price are highly sensitive to weather, and climate variability has increased the production risk of highland summer cultivation through physiological disorders, heat stress, and disease (Son et al. 2015; Kim et al. 2025). Reliable prediction of cabbage growth and yield is therefore of practical importance, and a range of modelling approaches has been developed for this crop, spanning process-based, empirical, and statistical frameworks.
Process-based models simulate biomass accumulation from leaf photosynthesis scaled to the canopy and linked to environmental drivers. The Excel/VBA cabbage model of Moon et al. (2018) is a representative example that was parameterised using soil–plant–atmosphere-research (SPAR) chamber experiments and is driven by hourly weather and leaf area index, enabling prediction of growth under diverse temperature regimes; the process-based K-Cabbage model has since been developed and evaluated for highland Kimchi cabbage production under climate-change scenarios (Lee et al. 2023). Generic process-based frameworks such as CROPGRO have also been adapted to Kimchi cabbage and evaluated under greenhouse and climate-chamber conditions through cultivar-specific calibration of phenology and dry-matter partitioning, with subsequent integration into platforms such as DSSAT (Feike et al. 2010; Pflugfelder et al. 2015). More recently, the WOFOST model has been reconfigured to simulate Kimchi cabbage growth and development across climate and soil combinations, with particular emphasis on fertiliser management and yield stability under climate-change scenarios (Tang et al. 2025).
Empirical regression models predict head weight or harvestable biomass from non-destructive growth variables and growing degree-days (GDD). The highland Kimchi cabbage model of Kim et al. (2015) relates head weight to thermal time and canopy traits, while the alpine summer-cabbage growth model of Ahn et al. (2014) uses logistic leaf-area expansion linked to potential heat units to estimate fresh weight. These empirical formulations have been used to support decision-making for sowing dates and harvest scheduling in highland systems where supply–demand imbalances can trigger large price fluctuations. In parallel, statistical mixed-frequency models such as the MIDAS-based approach of Moon et al. (2021) forecast regional autumn cabbage yield from high-frequency weather and growth measurements, and machine-learning models have been proposed to predict economic yields of different cultivar clusters under future climate conditions (Kim et al. 2022). Despite their differences in structure, these models consistently rely on thermal time (GDD or potential heat units), measured growth variables, and cultivar-specific parameters for growth and partitioning.
A common limitation across these approaches is the scarcity of cultivar-specific growth, allometric, and dry-matter partitioning parameters for the early seedling-to-pre-heading stages, especially under controlled environments where confounding weather variation is removed. In many existing models, parameters such as growth-curve coefficients, leaf-area and dry-weight conversions, and shoot–root partitioning ratios are inferred from field-grown plants, later developmental stages, or generic cultivar descriptions, which can reduce accuracy when models are applied to controlled-environment systems or to specific commercial cultivars. Yet these quantities—growth-curve coefficients on a thermal-time axis, allometric relationships among leaf dimensions, leaf area and dry weight, and partitioning ratios of dry matter between shoots and roots—are the direct inputs required by the process-based, regression, and statistical models described above.
Controlled-environment agriculture (CEA), including vertical farms, is expanding rapidly for leafy vegetables and offers a setting in which crop growth can be characterized under tightly controlled temperature, light, and CO2, without confounding weather variability. Recent studies have developed growth-response and production models for leafy-vegetable production in vertical farms, focusing on resource-use efficiency, planting density, and lighting strategies, and have demonstrated the potential of such systems for stable year-round production (Huang et al. 2024). Nevertheless, most of these CEA and vertical-farm studies emphasize yield, physiology, or phenomics rather than providing explicit, cultivar-specific growth and allometric parameters in a form directly usable by existing cabbage crop models.
The objective of this study was therefore to derive cultivar-specific, thermal-time-based growth-curve, allometric, and dry-matter partitioning parameters for four commercial Kimchi cabbage cultivars grown under a single controlled vertical-farm environment, and to relate these quantities to the inputs of existing cabbage models. These parameters can be used for model initialization, calibration and validation, and for non-destructive growth monitoring under comparable controlled-environment conditions.
Materials and Methods
1. Plant material and growing conditions
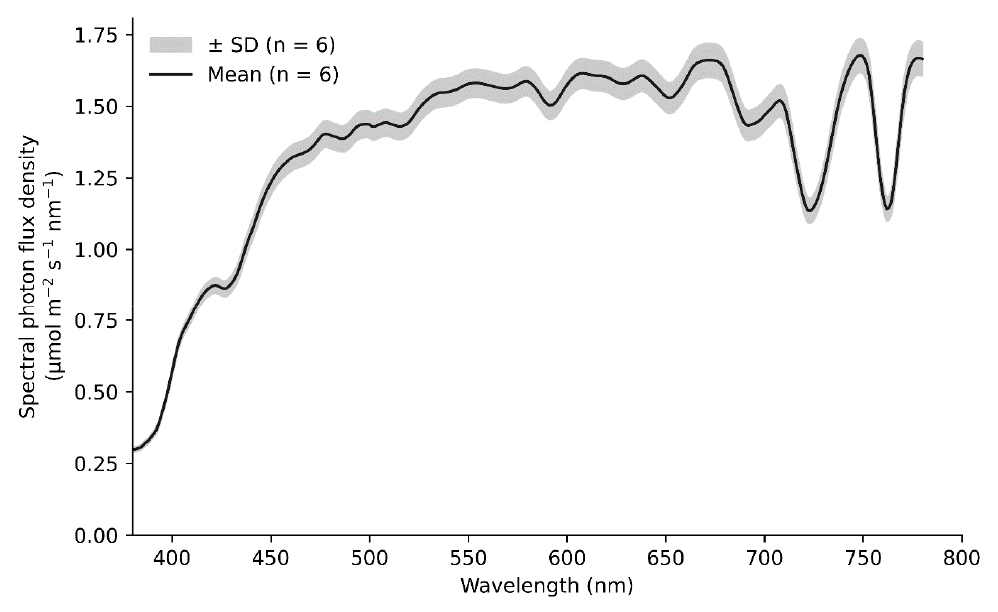
Four commercial Kimchi cabbage cultivars (Chunkwang, Cheongmyeong-gaeul, Summertop, and Haradew) were grown in a closed-type, artificial-light three-tier vertical-farm module in the PHL plant factory at Kyungpook National University, Daegu, Korea. The cultivars were chosen to span the main commercial ecotypes and breeding sources of Kimchi cabbage in Korea: Chunkwang (Sakata Korea, Seoul, Korea; spring, bolting-tolerant type), Summertop (Sakata Korea, Seoul, Korea; summer, high-temperature type), Cheongmyeong-gaeul (NH Nongwoo Bio, Suwon, Korea; autumn Chuseok/kimjang type, clubroot-resistant) and Haradew (National Institute of Horticultural and Herbal Science and Korea Agro-Fisheries and Food Trade Corporation, Wanju and Naju, Korea; semi-highland summer, heat-tolerant type), so that the derived parameter ranges are representative rather than cultivar-idiosyncratic and allow the need for cultivar-specific parameterization to be assessed. Illumination was provided by white LEDs (SG-BAR-28W, Future Green Co., Ltd., Yongin, Korea) at a photosynthetic photon flux density of about 500 µmol m-2 s-1 measured at the module centre, corresponding to a daily light integral of about 28.8 mol m-2 d-1, with a 16 h light / 8 h dark photoperiod; the spectral photon-flux distribution of the white LEDs is shown in Fig. 1 (red-to-blue ratio about 1.11, red-to-far-red ratio about 1.76). Air temperature was maintained at 25℃ during the day and 22℃ at night (daily mean 24.0℃) from 26 January 2026; before that date a constant 27℃ was applied. CO2 concentration was 400 ppm and relative humidity was 70% (60% before 26 January 2026). Seeds were sown on 12 January 2026 into a commercial substrate (cocopeat 67, peat 12, vermiculite 8, perlite 9.5%; Chamgro, Korea) and seedlings were transplanted on 27 January 2026 (15 days after sowing; i.e. 15-day-old seedlings), after which plants were sub-irrigated at an electrical conductivity of 1.2 dS m-1.
2. Experimental layout and sampling
The experiment comprised the four cultivars and seven seedling growth-retardant treatments with a commercial plant growth retardant (Binnari), with three replicate plants per combination in a balanced layout. The seven treatments were an untreated control and low, standard and high concentrations (10, 20 and 40 mL per 20 L water, corresponding to 0.5×, 1.0× and 2.0× the label rate), each applied either once (at 15 days after sowing) or twice (at 15 and 22 days after sowing). In the present analysis the growth-retardant treatments were not treated as an experimental factor of interest; rather, they were used to broaden the range of plant sizes available for estimating cultivar-level growth and allometric parameters, and data were pooled across treatments within each cultivar (representative plants are shown in Fig. 2). Plants were sampled destructively six times: an initial 0-day baseline at transplanting (26 January 2026) and at 2, 6, 8, 10, and 14 days after transplanting (DAT), the final harvest occurring on 10 February 2026. Sampling was confined to the early seedling-to-pre-heading stage (0-14 DAT), the developmental window for which cultivar-specific parameters are scarce and which is the focus of this study; head formation occurs later and was outside the intended scope. A single temperature regime (daily mean 24.0°C) and a single light intensity (about 500 µmol m-2 s-1) were imposed to isolate cultivar effects; accordingly, temperature- and light-response functions were not derived in this study.
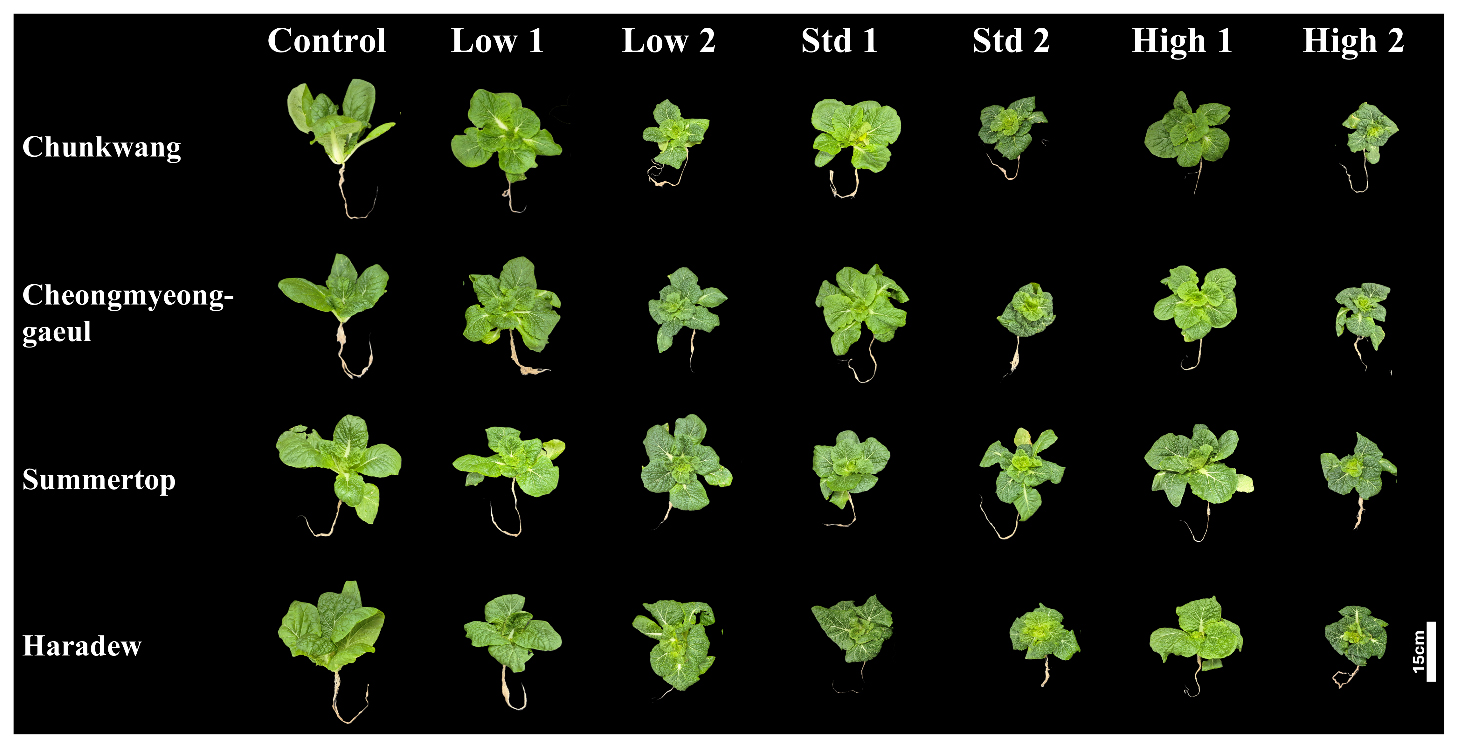
Fig. 2
Representative plants of the four Kimchi cabbage cultivars (Chunkwang, Cheongmyeong-gaeul, Summertop, Haradew) at final harvest under seven seedling growth-retardant treatments applied with the commercial plant growth retardant Binnari: Control, untreated; Low 1 and Low 2, 10 mL per 20 L water (0.5× the label rate) applied once at 15 days after sowing (DAS) or twice at 15 and 22 DAS, respectively; Std 1 and Std 2, 20 mL per 20 L water (1.0× the label rate) applied once or twice; and High 1 and High 2, 40 mL per 20 L water (2.0× the label rate) applied once or twice. Scale bar = 15 cm
3. Measurements and derived variables
At each sampling, shoot and root fresh weight (SFW, RFW), shoot and root dry weight (SDW, RDW; dried to constant weight), the length and width of the largest leaf (LL, LW), total leaf area (LA), leaf number (LN) and leaf SPAD were recorded. Shoot dry weight (SDW) comprised leaf blades including midribs, petioles and the short stem. The dry-weight-based shoot-to-root ratio (T/R = SDW/RDW), specific leaf area (SLA = LA/SDW) and shoot dry-matter fraction (SDW/(SDW+RDW)) were derived. Thermal time was expressed as growing degree-days accumulated from transplanting using a base temperature of 0℃; under the constant daily mean of 24.0℃ this yielded GDD values of 0, 48, 144, 192, 240, and 336℃ d at the six samplings. The choice of base temperature is an assumption and is noted as such. Because a single daily mean temperature (24.0°C) was imposed, GDD is a linear rescaling of days after transplanting (GDD = 24 x DAT for a base temperature of 0°C); adopting a literature value near 5°C rescales the axis by (24-Tbase)/24 without changing model fit, and estimating temperature-response parameters would require multiple temperature treatments.
4. Data quality control
Before analysis, two recording errors were identified from internal consistency checks and corrected: one root-dry-weight value inconsistent with its replicates and with the RDW-SDW relationship (a decimal-point error) was corrected, and one cell of shoot-dry-weight values whose dry-matter content (0.3%) was incompatible with the normal range (about 5-6%) while the corresponding fresh weights were normal was reconstructed from fresh weight and the cultivar-and-date mean dry-matter content. Both corrections affected only intermediate samplings and not the final harvest.
5. Statistical analysis
Logistic, Gompertz and exponential functions were fitted by non-linear least squares to cultivar-mean SDW and LA against GDD and compared by RMSE, AICc and residual patterns; the logistic function (Eq. 1) was selected as the primary model. The fitted coefficients - the asymptote (Wmax), the rate/time-scale coefficient (k) and the inflection point (ti) - are reported with standard errors, and because sampling ended at or before the inflection, Wmax and ti are treated as extrapolated Allometric relationships (LA vs LL × LW; SDW vs LA; SFW vs SDW) were described by linear regression per cultivar. Cultivar differences at final harvest were tested by one-way ANOVA followed by Duncan's multiple range test (p = 0.05, n = 21 per cultivar, pooled across growth-retardant treatments). To confirm that pooling was appropriate, a two-way ANOVA (cultivar x growth-retardant regime) was applied at final harvest; the cultivar x treatment interaction was non-significant for SDW, RDW and T/R (p = 0.60-0.91) but significant for LA and LN (p = 0.003 and 0.030), so cultivar differences in LA and LN are interpreted with corresponding caution. Analyses were performed in Python (SciPy, statsmodels). Because the cultivar comparison pooled the growth-retardant treatments, the within-cultivar error includes treatment variance; this is acknowledged in interpretation.
Results and Discussion
1. Growth trajectories over thermal time
Shoot and root biomass, leaf area and leaf number increased with thermal time in all cultivars, with the steepest increase after about 150℃ d (Fig. 3, Fig. 4). Cultivar-mean SDW was described best by the logistic function among the tested growth functions (R2 = 0.998-0.9995), with fitted asymptotes of 2.13, 2.79, 3.07, and 1.97 g plant-1 and rate coefficients of 0.0146, 0.0122, 0.0128, and 0.0144 for Chunkwang, Cheongmyeong-gaeul, Summertop and Haradew, respectively (Fig. 3b). However, both SDW and LA were still in the near-exponential phase at the final sampling (inflection points at or beyond the observed GDD range), so the asymptotic parameters are extrapolations and should be treated as provisional rather than as mature-plant values; the experiment ended before head formation and does not support inference about final head weight. Across all cultivars the logistic function gave lower AICc and RMSE than the Gompertz and exponential functions (Table 1); the Gompertz asymptote exceeded the final observed SDW by 2.4-4.6-fold with inflection points beyond the sampled range, whereas the logistic asymptote (1.3-1.5-fold) and inflection (within or near the sampled range) were more plausible.
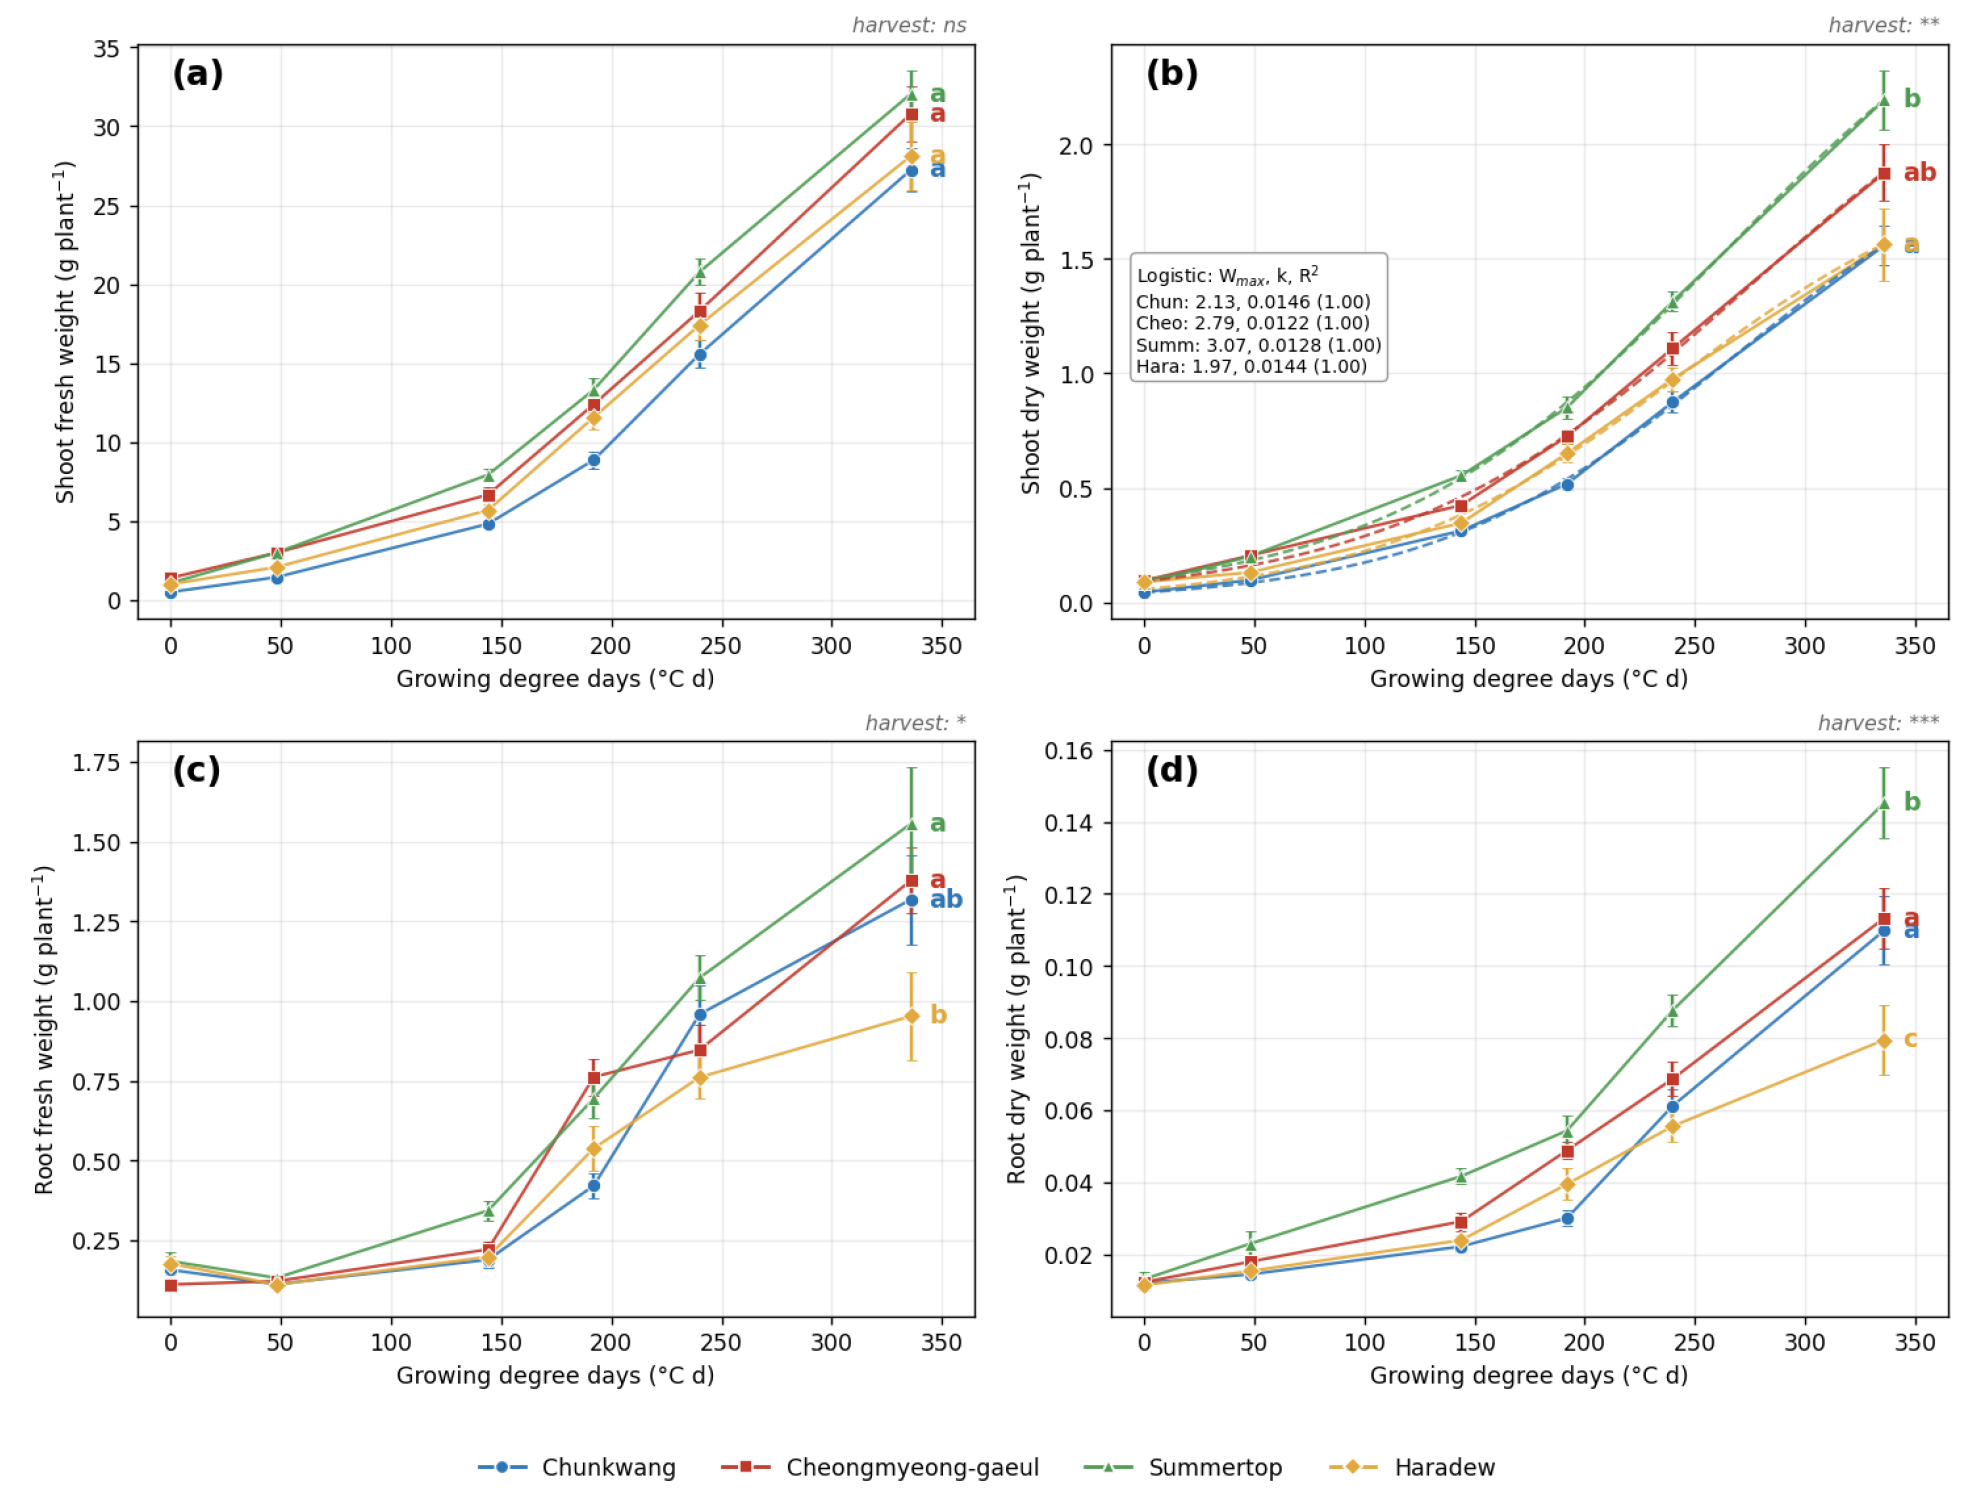
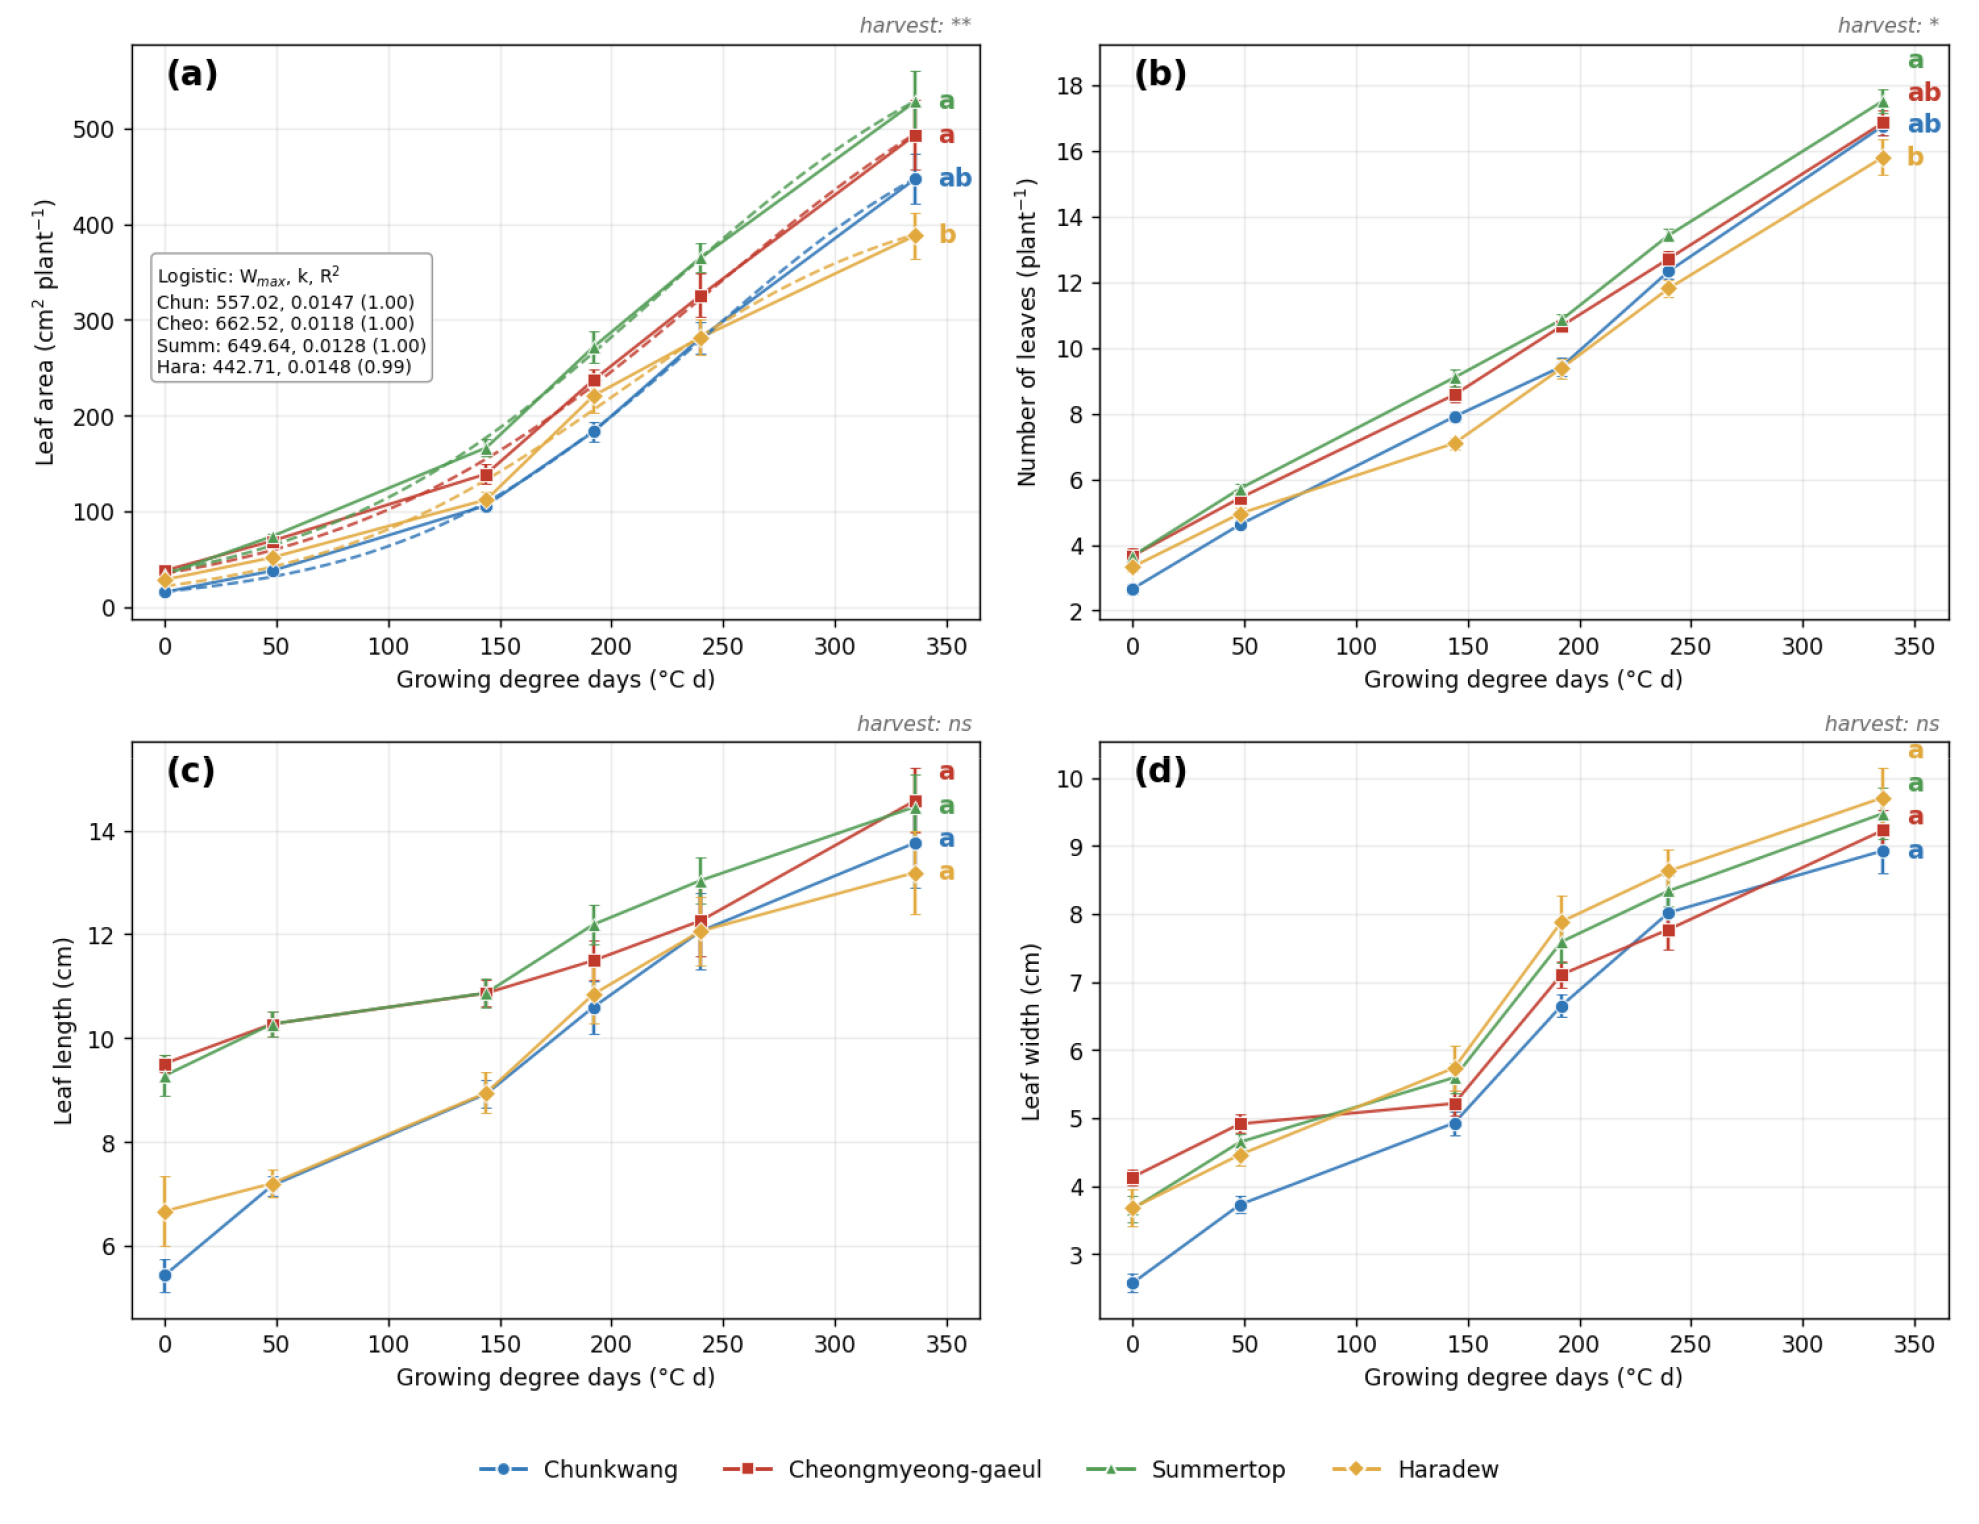
Table 1
Role-based mapping of the derived growth, allometric and partitioning parameters (Figs. 3, 4, 5, 6) to the inputs of existing cabbage models
| Role | Quantity (figure) | Source | Use in a model |
| Initial condition |
SDW0, RDW0, LA0, LN0 at transplanting (baseline) | This study |
Model initialization (per-plant; density needed for LAI) |
| Calibration / validation target |
Logistic Wmax, k, ti for SDW and LA vs GDD (Fig. 3b, 4a) | This study |
Empirical trajectory summaries; not direct process parameters |
| Observation equation |
Allometric LA=f(LL x LW, LN); SDW=f(LA); SFW=f(SDW) (Fig. 6) | This study | Measurement-to-model conversion for non-destructive monitoring |
| Time index | GDD axis (single temperature) | This study |
Growth-stage normalization only; not a validated thermal response |
| Allocation target (approx.) |
Dry-matter partitioning / final T/R, shoot DMF (Fig. 5b, c) | This study |
Approximate allocation; final T/R is a cumulative ratio, not an instantaneous coefficient |
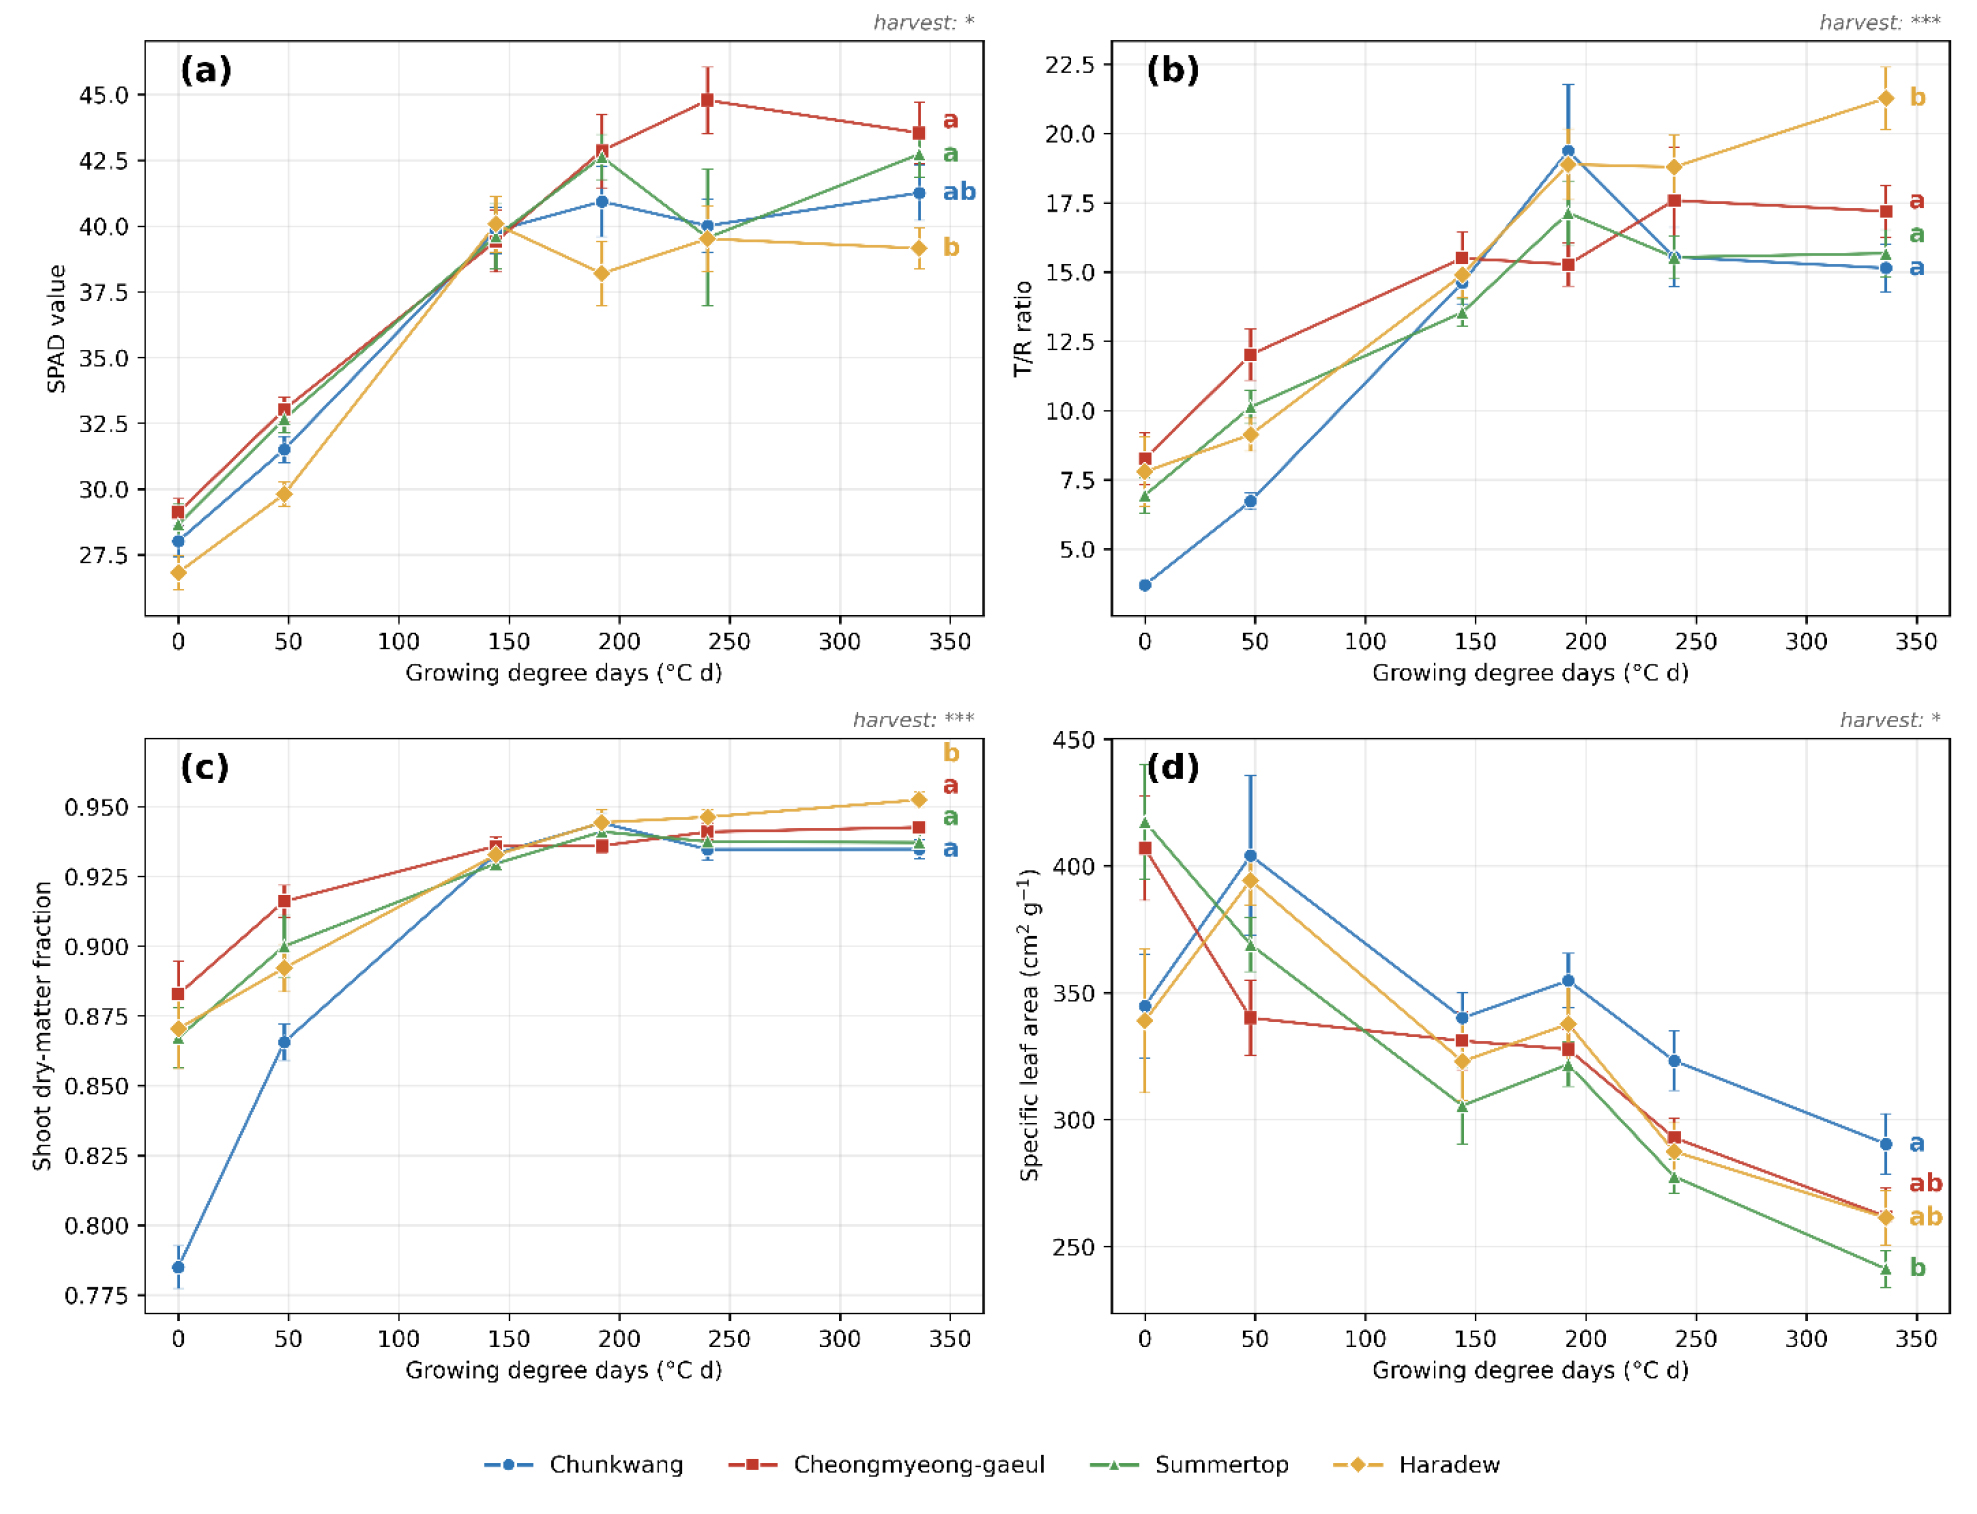
Leaf SPAD rose and then plateaued near 40, while the shoot dry-matter fraction increased and stabilized at 0.93-0.95, consistent with the leafy, pre-heading stage (Fig. 5a, c). Specific leaf area declined over thermal time (Fig. 5d), indicating progressive leaf thickening as dry matter accumulated. That growth aligned consistently on the GDD axis and that the fitted growth functions were closely supporting the use of thermal time as a scheduling axis for this crop under the controlled environment tested; we note this conclusion is specific to the single temperature regime studied. The close fit of the logistic function on the thermal-time axis is consistent with previous descriptions of Kimchi cabbage growth using logistic or sigmoidal functions driven by heat units (Feike et al. 2010; Ahn et al. 2014).
2. Cultivar differentiation at final harvest
At final harvest, cultivars differed significantly in shoot dry weight (p < 0.01), root dry weight (p < 0.001), leaf area (p < 0.01) and leaf number (p < 0.05), but not in shoot fresh weight or in the length and width of the largest leaf (Fig. 3, Fig. 4). This pattern indicates that cultivar differentiation at this stage was expressed in dry-matter accumulation and canopy area rather than in gross organ size. The cultivar means reported throughout are averages across the seven growth-retardant regimes and are not presented as untreated-cultivar characteristics. Summertop attained the highest SDW (2.19 g plant-1), root dry weight and leaf number, whereas Haradew had among the lowest SDW (1.56 g plant-1) and the lowest root dry weight (Table 3).
Dry-matter partitioning also differed among cultivars (p < 0.001). Haradew showed the highest T/R ratio (21.3) and the highest shoot dry-matter fraction (0.952), that is, the smallest proportional allocation to roots, whereas the other cultivars ranged from 15 to 17 (Fig. 5b). Specific leaf area was highest in Chunkwang (290 cm2 g-1) and lowest in Summertop (241 cm2 g-1) (Fig. 5d); the cultivar with the densest leaves (lowest SLA) also accumulated the most shoot dry matter, suggesting an association between leaf density and dry-matter accumulation at this stage. These are observational associations from a single environment and are not presented as causal or as generalisable across environments.
3. Allometric relationships
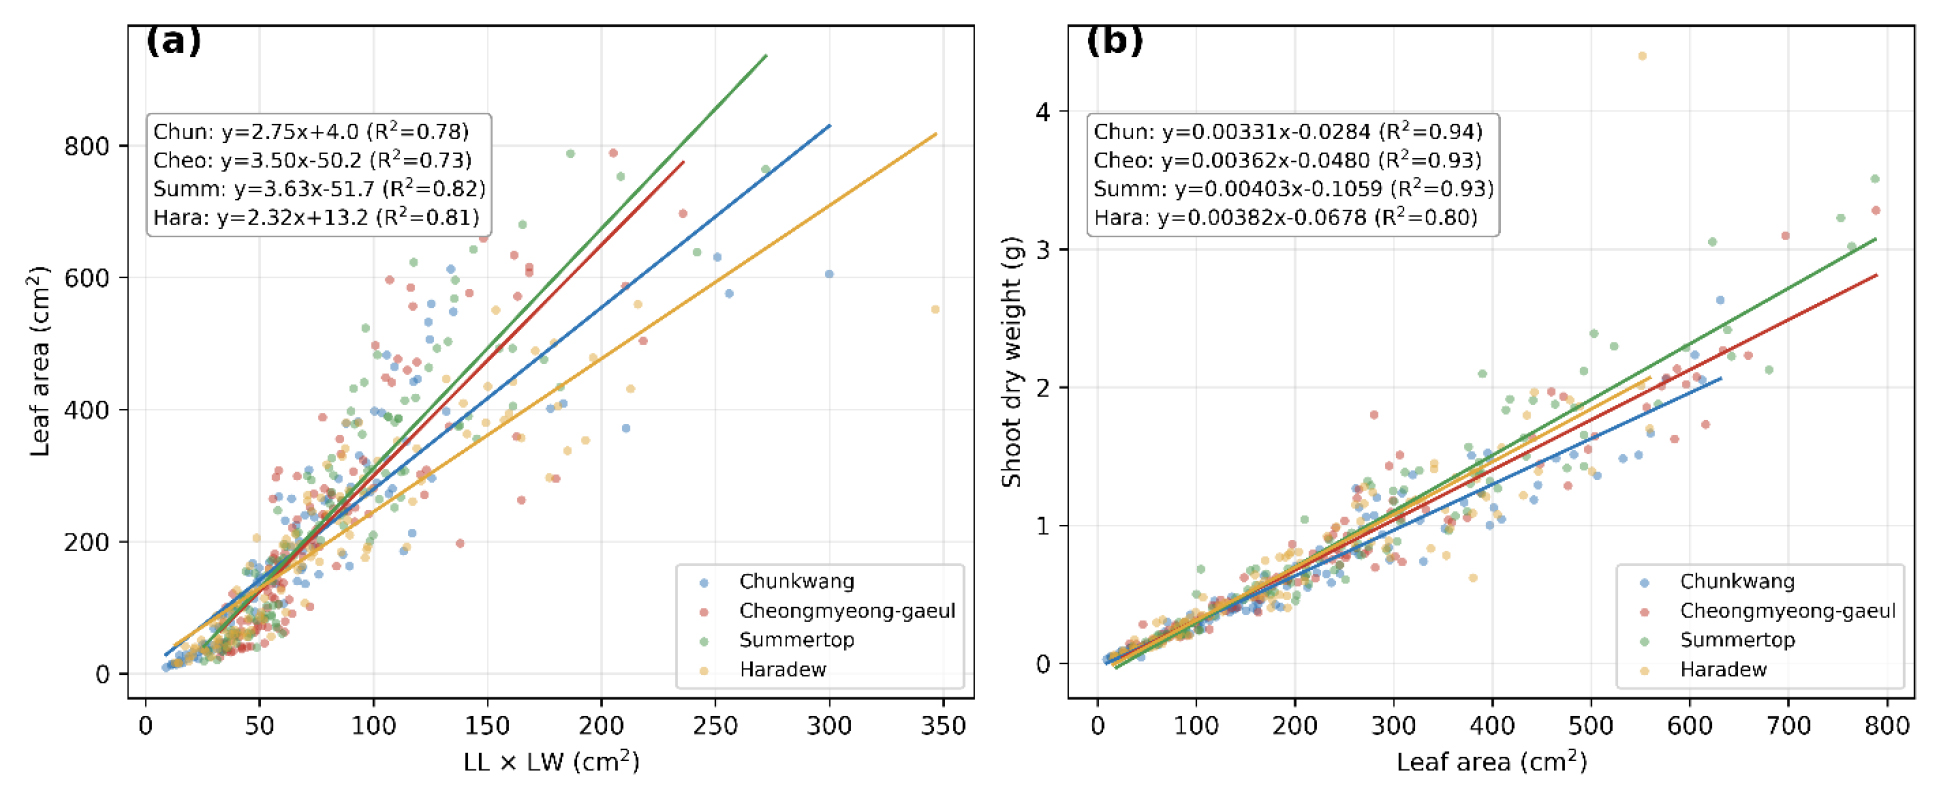
Leaf area was a strong linear predictor of shoot dry weight, with cultivar-specific coefficients of determination of 0.92-0.93 for three cultivars and 0.78 for Haradew (Fig. 6b), and shoot fresh weight was closely related to shoot dry weight (R2 = 0.95). Estimation of leaf area from the product of length and width of the largest leaf was weaker (R2 = 0.71-0.80) with cultivar-dependent slopes (Fig. 6a), reflecting the limitation of representing whole-plant leaf area by a single leaf. Adding leaf number to the largest-leaf dimensions substantially improved leaf-area prediction (LA = a(LL x LW) + cLN + b; R2 = 0.85-0.93 versus 0.73-0.82 for the single-leaf model), and models were compared by RMSE and residual behaviour rather than R2 alone. The strong LA-SDW relationship indicates that leaf area can serve as a non-destructive proxy for shoot dry matter across these cultivars, which is relevant for non-destructive monitoring and for supplying model inputs without destructive sampling; realising this in practice would require an independent, non-destructive estimate of leaf area.
4. Parameters for crop growth model input
The quantities derived here relate to the inputs of existing cabbage models in distinct roles - initial conditions, calibration or validation targets, observation equations and a time index - as summarised in Table 2. The logistic growth coefficients and the leaf-area expansion trajectory correspond to the dry-matter accumulation and canopy-development components of process-based models such as Moon et al. (2018); the allometric equations and the GDD axis correspond to the non-destructive growth regression and growth-stage normalisation used by Kim et al. (2015) and the alpine empirical model of Ahn et al. (2014), and can be transferred to generic process-based frameworks such as CROPGRO through cultivar-specific calibration (Feike et al. 2010; Pflugfelder et al. 2015); and the partitioning ratios provide approximate allocation targets (final T/R is a cumulative ratio rather than an instantaneous allocation coefficient). Two inputs cannot be provided from the present data: absolute leaf area index and radiation-use efficiency require planting density, which was not measured, so all parameters are expressed on a per-plant basis; and temperature and light-intensity response functions cannot be derived because a single temperature and a single light intensity were used. These gaps define the additional experiments needed to complete a transferable parameter set.
Table 2
Growth-function comparison (logistic vs Gompertz vs exponential) for cultivar-mean SDW and LA against GDD
Table 3
Consolidated cultivar parameter summary: final-harvest traits (14 DAT, n=21; means across the seven growth-retardant regimes) and fitted logistic growth-curve parameters (Wmax, k, ti +/- SE) for SDW and LA
Compared with open-field highland Kimchi cabbage, the parameters derived here reflect the controlled vertical-farm environment. Kim et al. (2015) modelled marketable head weight of field-grown highland cabbage (including the cultivar Chunkwang) from growing degree-days and non- destructive head dimensions, using a base temperature of 5℃ (Sim et al. 2021) and a growth optimum near 22℃, whereas the stable 24 ℃, continuous ~500 µmol m-2 s-1 lighting and fixed planting density used here remove the weather, temperature and radiation fluctuations of the field. Two consequences follow. First, those field models operate at the heading stage and describe head weight, so they do not provide the early seedling-to-pre-heading logistic growth-rate, allometric and partitioning coefficients quantified here; the present dataset therefore complements rather than duplicates them. Second, because base temperature and growth optimum differ between studies, thermal-time values are not directly interchangeable: the 0 C base used here was chosen for compatibility, and rescaling to the 5 C base of highland studies (Kim et al. 2015) would shift k and ti accordingly. Consistent with Ahn et al. (2014), who described alpine summer cabbage with logistic leaf-area expansion driven by heat units, the logistic form was also the best descriptor of early growth here, supporting its use across production systems while indicating that the coefficients themselves are environment-specific and should be re-estimated before transfer to open-field conditions.
Conclusion
Under a single controlled vertical-farm environment, we derived cultivar-specific, thermal-time-based parameters for four Kimchi cabbage cultivars: logistic growth-curve coefficients for shoot dry weight and leaf area (R2 = 0.998-0.9995), allometric conversion equations (LA-SDW R2= 0.92-0.93), and dry-matter partitioning coefficients. Cultivar differences were concentrated in dry-matter accumulation and partitioning rather than in gross leaf size, and leaf area was a strong non-destructive proxy for shoot dry weight. These parameters provide initialization values and calibration or validation targets for process-based and regression cabbage models, rather than validated, directly transferable process parameters. The study is explicitly limited to one temperature and one light intensity and to the seedling-to-pre-heading stage, so it does not resolve temperature or light-intensity responses, does not provide leaf area index or radiation-use efficiency, and yields asymptotic parameters that are extrapolated. Completing a transferable parameter set will require experiments across a temperature gradient and light intensities, with recorded planting density, extended to the heading stage, and could be combined with non-destructive imaging for leaf-area estimation.