

Introduction
Materials and Methods
1. Plant Growth Environments
2. Measurements
3. Comparison of Observed and Estimated Responses to Different Light Intensity and Temperature
Results and Discussion
Introduction
The cultivation areas of vegetables were 171,429ha for the open field and 54,443ha for the greenhouse. Most of the fruit vegetables (85.6%) were grown in the greenhouse. Vegetable production in greenhouses has been continuously declining since reaching 3.13 million tons in 2009 (MAFRA, 2019). It is well known that increasing CO2 concentration positively improves leaf photosynthesis and thus productivity. The concentration of CO2 in the greenhouse can be lower than the concentration in the atmosphere when the greenhouse is not ventilated during winter, resulting in a considerable yield decrease. Therefore, a proper CO2 control system that reflects the variation of growth environments depending on greenhouse types and crop growth stages needs to be developed. A previous study suggested optimal setpoints for indoor CO2 concentration (Peet and Willits, 1987); however, the estimated optimal CO2 concentration varies depending on ventilation, wind speed, or window aperture (Nederhoff, 1987; Sanchez-Guerrero et al., 2005). Also, cost-efficient control of CO2 supplies is necessary since pure CO2 is expensive. A proper CO2 control system may need to replenish CO2 concentration to maintain leaf photosynthesis effectively under different temperatures and radiation.
There is a model that describes leaf photosynthesis efficiency enhanced by the increased CO2 concentration (Farquhar et al., 1980). The rate of CO2 assimilation in plants depends on biochemical processes, light intensity, temperature, and CO2 concentration in the cytoplasm, thylakoid membrane, stroma, mitochondria. The most common methods used to understand C3 photosynthesis reactions are models of photosynthesis developed by Farquhar et al. (1980). In this model, the rate of photosynthesis may vary depending on the state of ribulose 1,5-bisphosphate carboxylase/oxygenase (Rubisco) that supplies sufficient ribulose 1,5-bisphosphate (RuBP), known as the Rubisco-limited photosynthesis rate, and occurs in low CO2 concentrations. The photosynthesis rate can also depend on the regeneration rate of RuBP, which occurs under high CO2 conditions. Rubisco and RuBP restrictions typically occur at <20Pa (-200ppm) CO2 and at >30Pa CO2, respectively. The triose phosphate use (TPU) limiting factor can set the maximum photosynthesis rate (Amax) by increasing the CO2 rate or oxygen concentration (Sharkey, 1985). Plant photosynthetic capacity is, therefore, determined by the maximum rate of Rubisco carboxylation (Vcmax) and the maximum rate of electron transport (Jmax) at a reference temperature (generally 25°C) using the response of An to intercellular CO2 concentration (A-Ci response curves). The parameters estimated from the analysis of an A-Ci curve respond to measurement temperature; thus, comparisons between two treatments are often made at a single temperature. Representative temperature responses of the fitted parameters are used to adjust these values to a single temperature, in this case, at 25°C (Sharkey et al., 2007). The C3 photosynthesis model proposed by Farquhar et al. (1980) has been applied to estimate leaf photosynthesis- dependent temperature (Medlyn et al., 2002a; Kattge and Knorr, 2007) since the biochemical processes are temperature- dependent (Harley et al., 1992; Leuning, 2002; Medlyn et al., 2002b). Net CO2 uptake for photosynthesis depends on growth temperature (Hikosaka et al., 2006; Sage and Kubien, 2007). Recently, Kim et al. (2020) estimate heat stress reduction of cucumber plants by solar shading in a greenhouse by measuring and analyzing physiological conditions, such as leaf temperature, leaf-air temperature, Vcmax, Jmax, thermal breakdown, and leaf respiration.
This study aimed to estimate photosynthetic capacity for tomato plants grown in a semi-closed greenhouse using temperature response models of plant photosynthesis by calculating Vcmax, Jmax, thermal breakdown, and leaf respiration to predict optimal conditions of the CO2-controlled greenhouse to maximize photosynthetic rate.
Materials and Methods
1. Plant Growth Environments
This study was conducted by growing tomatoes in a semi-closed greenhouse with hydroponics under integrated solar radiation (ISR)-automated irrigation. The tomatoes (Solanum lycopericum L. 'Dafnis') were transplanted onto coconut coir substrates ((Chip:Dust, 7:3), DY GS, Korea) on March 23, 2021. One dripper per plant was installed to supply a uniform feeding amount for each crop, and the tomato nutrient solution developed by RDA was provided to the automatic feeding system ((Macro-nutrients (me L-1): NO3-N (8.2), NH4-N (1.4), P (2.0), K (5.0), Ca (4.0), Mg (2.0), SO4-S (2.0), Micro-nutrients (ppm): Fe (3.0), Cu (0.02), B (0.5), Mn (0.5), Zn (0.05), Mn (0.01)). The electrical conductivity and pH were controlled at 2.0–2.5dS·m-1 and 5.3–6.8, respectively. The tomatoes were trained into a one-stem vine. The shading screen was closed between 11 a.m. and 2 p.m. when the light intensity reached 700W·m-2 in the greenhouse and the air temperature was more than 30°C. During the experimental period, the minimum night temperature was set to 18°C, and the day temperature was set to 23°C. The internal and external environments of the greenhouse (e.g., temperature, humidity, solar radiation, and CO2) were measured beginning May 7, 2021 using a greenhouse environmental control system (Magma 3.0, GreenCS, Jeonnam, Korea). The ISR was set to 100J·cm-2 from the first irrigation to the end, and the water volume per plant in a day was 1.5–2.0L. Tomato harvesting was carried out beginning May 23, two months after the transplant, and a 12 to 18 leaf number was maintained by removing the old leaves once a week. The apical shoot was placed approximately 2.5 to 3.0 meters above the gutter.
In this experiment, all the measurements were conducted with the plants that its plant height was 271 (±8.20)cm, 343 (±6.51)cm and 416 (±5.74)cm at June 22, July 14, and August 3, 2021, respectively with the 7.8 (±0.37), 10.8 (±0.20) and 13.4 (±0.40) of cluster number, the 39.0 (±1.05), 43.9 (±1.51) and 42.0 (±2.30) of leaf length and 33.2 (±5.06), 39.3 (±2.42) and 36.9 (±5.12) of leaf width of fifth leaves from the apical region at June 22, July 14, and August 3, 2021, respectively.
2. Measurements
Total 16 replications of gas exchange measurements were conducted with a portable infrared gas analyzer system (LI-6400XT; Li-Cor, Inc., Lincoln, NE, USA) during the June 22 to August 9, 2021. One of the youngest fully expanded leaflets on the fifth leaf of the apical shoot was placed in the leaf chamber of gas analyzer. For the A-Ci curve response to CO2 level, the reference CO2 for the A-Ci curves was changed in the following order: 50, 100, 200, 300, 600, 800, 1000, 1500, and 1800µmol·mol-1 at the PAR values of 200, 400, 600, 800, 1000, 1200, and 1500µmol·m-2·s-1 with the 34.54℃ average air temperature. For the A-Ci curve response to different leaf temperatures, the leaf temperature was increased from 20°C to 35°C with 5°C increments, and A-Ci response curves were recorded at each temperature and the reference CO2 levels and a 700µmol·m-2·s-1 PAR value. The significance between environmental factors was analyzed with variable selection stepwise using the SAS 9.2 software package (SAS Institute, Cary, NC, USA).
3. Comparison of Observed and Estimated Responses to Different Light Intensity and Temperature
We used the Arrhenius equation to describe the kinetic temperature responses of Vcmax and Jmax. Arrhenius function, Vcmax, Jmax, thermal breakdown, Rd were calculated using the selected model. The program was developed using SAS (SAS Institute Inc 9.1, Cary, NC, USA). Relationships among Vcmax, Jmax, and other environmental factors were analyzed stepwise.
The Arrhenius function is as follows:
where 𝑇𝑙 is leaf temperature, R is the universal gas constant (8.314J·K-1·mol-1), and ΔHa is the activation energy (J·mol-1). Parameter values for Vcmax and Jmax are presented in Table 2 (Farquhar et al., 1980; Leuning, 2002; Caemmerer, 2000).
The Vcmax is calculated as follows:
where, is the carboxylation rate at 25°C (µmol·m-2·s-1), 0.088 is temperature coefficient for that parameter at 25°C and 0.29 is temperature coefficient for that parameter at 41°C (Campbell and Norman, 1998).
The Jmax is calculated as follows:
where, is the deactivation energy[J·mol-1]
where Medlyn et al. (2002b) derived this equation at 25°C using Bernacchi et al. (2001).
The thermal breakdown is calculated as follows:
where,ΔS is the entropy (JK-1·mol-1) and Δ is the energy of deactivation (J·mol-1).
The leaf Rd is calculated as follows:
where, is the leaf respiration at 25°C (µmol·m-2·s-1), and leaf respiration is typically 1%-2% of Vcmax (Caemmerer, 2000).
An is calculated as follows;
where is considered as the Vcmax, at 25°C (frequently used for C3 plants (Collatz et al., 1991), Vcmax,25 = 78.2µmol·m-2·s-1 for C3 plant, herbaceous Ci = 245µmol·mol-1 for C3 plant, and , .
Results and Discussion
The average air temperature was 22.7°C, 24.8°C, and 25.2°C for June, July, and August, respectively, and the average leaf temperature was slightly lower than the air temperature in July and August. The maximum and average levels of solar irradiance were 1,175 and 323W·m-2·s-1, respectively. The maximum level of CO2 ranged between 576 and 825ppm, and the extremely higher concentration, 2,000ppm, was found only on a single day (Table 1).
Table 1.
Maximum (Max), minimum (Min), and average (Av) of air temperature, relative humidity, leaf temperature, solar radiation, and CO2 concentration in a semi-closed greenhouse for tomato cultivation from June 22 to August 9, 2021.
Table 2.
Photosynthetic parameter values for equations for the mean Vcmax and Jmax.
| Outputs | Vcmax | Jmax | Unit |
| ΔHa | 58,520 | 37,000 | J·mol-1 |
| ΔHd | 149,250 | 152,040 | J·mol-1 |
| ΔS | 485 | 495 | J·mol-1·K-1 |
Vcmax and Jmax normalized to 25°C of the gas exchange measurement for the A-Ci curve response to CO2 level from June to July was 87.51 and 115µmol·m-2·s-1, respectively with a similar value for the calculated Vcmax at 84.29µmol·m-2·s-1, and a higher calculated Jmax at 133µmol·m-2·s-1 (Table 3). The thermal breakdown was 0.940 (relative value; R.V.), and the Rd was 1.338, which was 3-fold lower than that normalized at 25°C from the gas exchange measurements, 4.228. The Arrhenius function [f(Tl)] value was 1.09.
Table 3.
Comparison of Rubisco maximum carboxylation rate (Vcmax), maximum electron transport rate (Jmax), leaf respiration under daylight (Rd) from gas exchange measurements and calculations and calculated Arrhenius function [f(Tl)], and thermal breakdown [fH(Tl)] in a semi-closed greenhouse for tomato cultivation at the June 22 and July 14, 2021.
| Outputs | At leaf temperature (n=5) | Normalized to 25°C (n=5) | Calculated at 25°C (n=51) |
| Vcmaxz(µmol·m−2·s−1) | 102 (±14)x | 87.51 (±7.485) | 84.29 (±0.864) |
| Jy(µmol·m−2·s−1) | 126 (±10) | 115 (±6.178) | 133 (±0.423) |
| TPU (µmol·m−2·s−1) | 9.163 (±0.722) | 8.423 (±0.488) | |
| Rd (µmolCO2·m−2·s−1) | 4.658 (±0.563) | 4.228 (±0.448) | 1.338 (±0.021) |
| f (Tl) (relative value) | 1.090 (±0.012) | ||
| fH (Tl) (relative value) | 0.940 (±0.008) |
While 25°C-normalized Vcmax, J and Rd from gas exchange measurements and calculation increased according to the PAR values of 600, 800, 1000, and 1200µmol·m-2·s-1, both values declined at the PAR 1500 level, which may be due to the increased leaf temperature (34.18°C) during the measurement, of which the estimated thermal breakdown [fH(Tl)] value was the lowest at 0.584 (Table 4). The estimated Arrhenius function f(Tl) value was 1.33 at PAR 600 (30.78°C), 1.32 at PAR 800 (30.82°C), 1.32 at PAR 1000 (30.75°C), 1.44 at PAR 1200 (32.87°C), and 1.55 at PAR 1500 (34.18°C). The Arrhenius function value indicates the growth response according to temperature, meaning there is a positive correlation between the values and sensitivity to temperature. The estimated Jmax declined from the PAR 1200 level, where the leaf temperature was measured at 32.87°C.
The photosynthetic rates of the fifth leaves from the apical region were saturated at a light intensity of 1200µmol·m-2·s-1 and reached the saturation point at a CO2 concentration of 1500ppm (Fig. 1). The CO2 saturation point was reached at CO2 600ppm for 200 and 400µmol·m-2·s-1 PAR, CO2 800ppm for 600 and 800µmol·m-2·s-1 PAR, CO2 1,000ppm for 1000µmol·m-2·s-1 PAR, and CO2 1500ppm for 1200 and 1500µmol·m-2·s-1 PAR levels (Fig. 1). In the semi-closed greenhouse, average PAR level ranged about 400 and maximized 1060µmol·m-2·s-1 during the day of August, indicating that supplementatal level for CO2 can be raised by the range between 600 and 1000ppm to maximize photosynthesis rate in the light intensity of semi-closed greenhouse.
Table 4.
Comparison of Rubisco maximum carboxylation rate (Vcmax), maximum electron transport rate (Jmax), leaf respiration under daylight (Rd) from gas exchange measurements and calculations and calculated Arrhenius function [f(Tl)], and thermal breakdown [fH(Tl)] with light intensity in a semi-closed greenhouse for tomato cultivation.
| Outputs | At leaf temperature | Normalized to 25°C | Calculated at 25°C |
| 30.78 | PAR 600 | ||
| Vcmaxz | 128 | 77.39 | 95 (±0.113) |
| Jy | 131 | 93.59 | 132 (±0.304) |
| TPU | 9.53 | 7.23 | - |
| Rd | 5.44 | 3.80 | 1.76 (±0.013) |
| f (TL) | - | - | 1.33 (±0.007) |
| fH (TL) | - | - | 0.760 (±0.005) |
| 30.82 | PAR 800 | ||
| Vcmax | 127 | 77 | 95 (±0.030) |
| J | 139 | 99 | 132 (±0.057) |
| TPU | 9.70 | 7.4 | - |
| Rd | 4.30 | 3.00 | 1.75 (±0.003) |
| f (Tl) | - | - | 1.32 (±0.001) |
| fH (Tl) | - | - | 0.770 (±0.001) |
| 30.75 | PAR 1000 | ||
| Vcmax | 148 | 89.43 | 95 (±0.112) |
| J | 159 | 114 | 133 (±0.196) |
| TPU | 11.21 | 8.50 | - |
| Rd | 5.15 | 3.60 | 1.74 (±0.009) |
| f (Tl) | - | - | 1.32 (±0.005) |
| fH (Tl) | - | - | 0.770 (±0.004) |
| 32.87 | PAR 1200 | ||
| Vcmax | 180.3 | 108.9 | 96 (±0.058) |
| J | 179.6 | 128.0 | 126 (±1.014) |
| TPU | 12.5 | 9.5 | - |
| Rd | 5.9 | 4.1 | 1.99 (±0.031) |
| f (Tl) | - | - | 1.44 (±0.016) |
| fH (Tl) | - | - | 0.670 (±0.013) |
| 34.18 | PAR 1500 | ||
| Vcmax | 216 | 98 | 95 (±0.049) |
| J | 176 | 104 | 118 (±0.205) |
| TPU | 12.1 | 8.9 | - |
| Rd | 5.49 | 3.14 | 2.20 (±0.005) |
| f (Tl) | - | - | 1.55 (±0.003) |
| fH (Tl) | - | - | 0.584 (±0.002) |
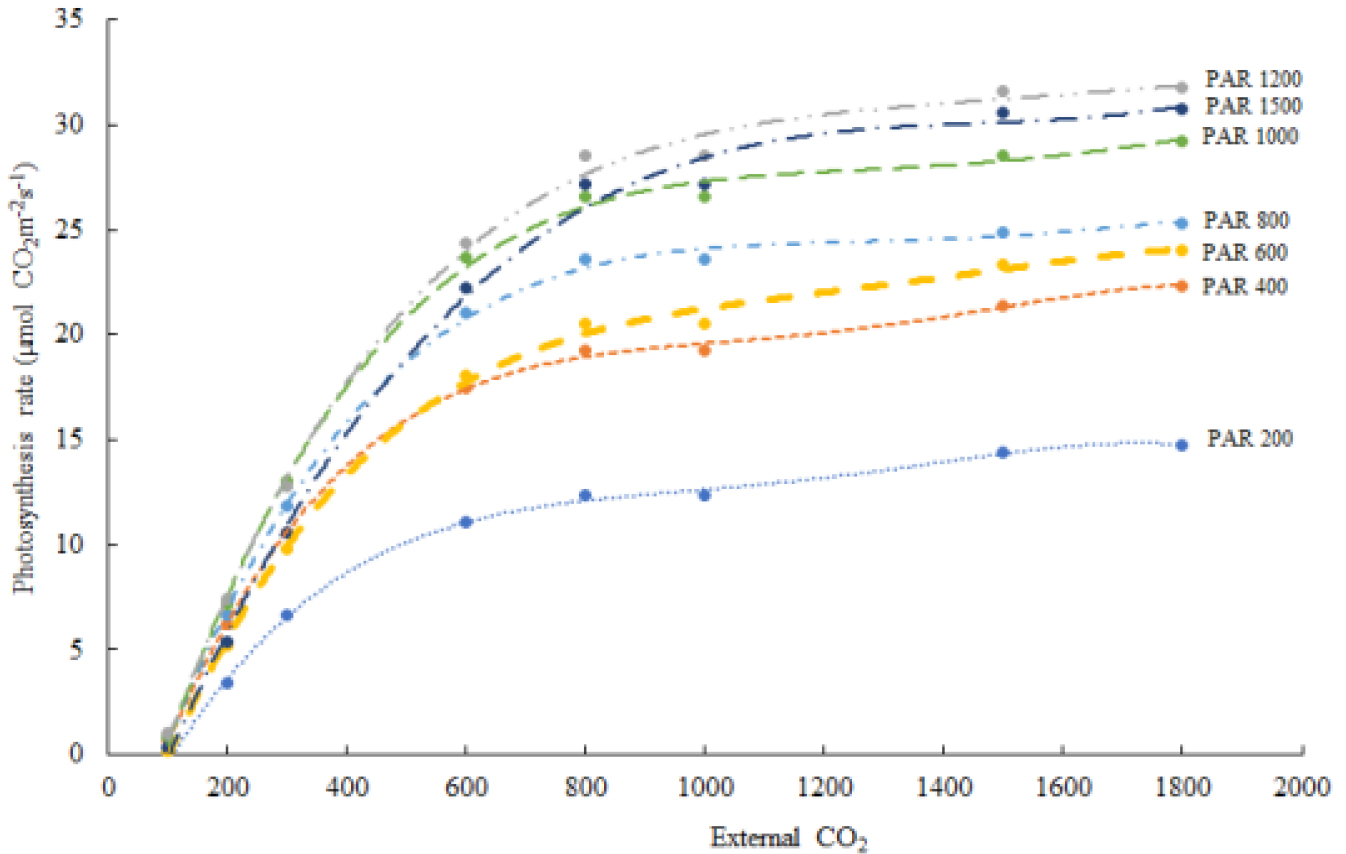
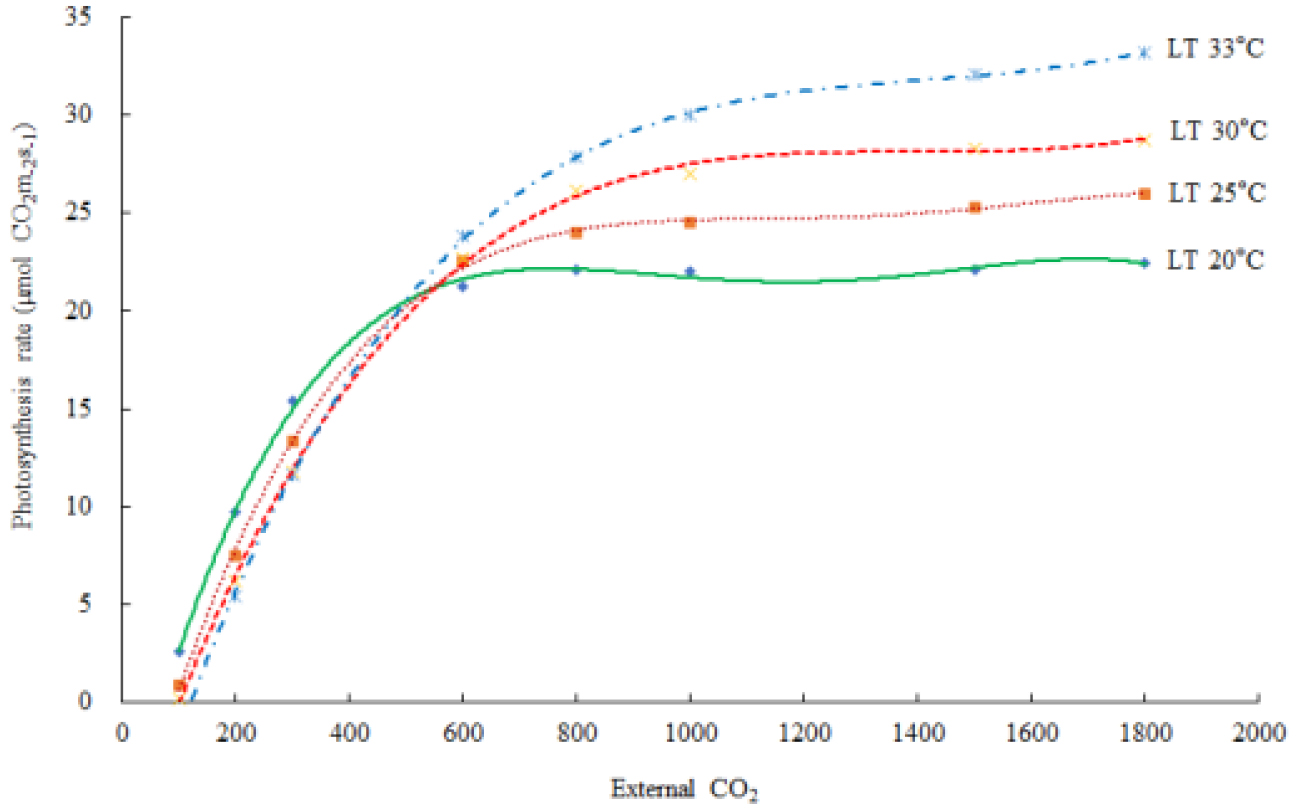
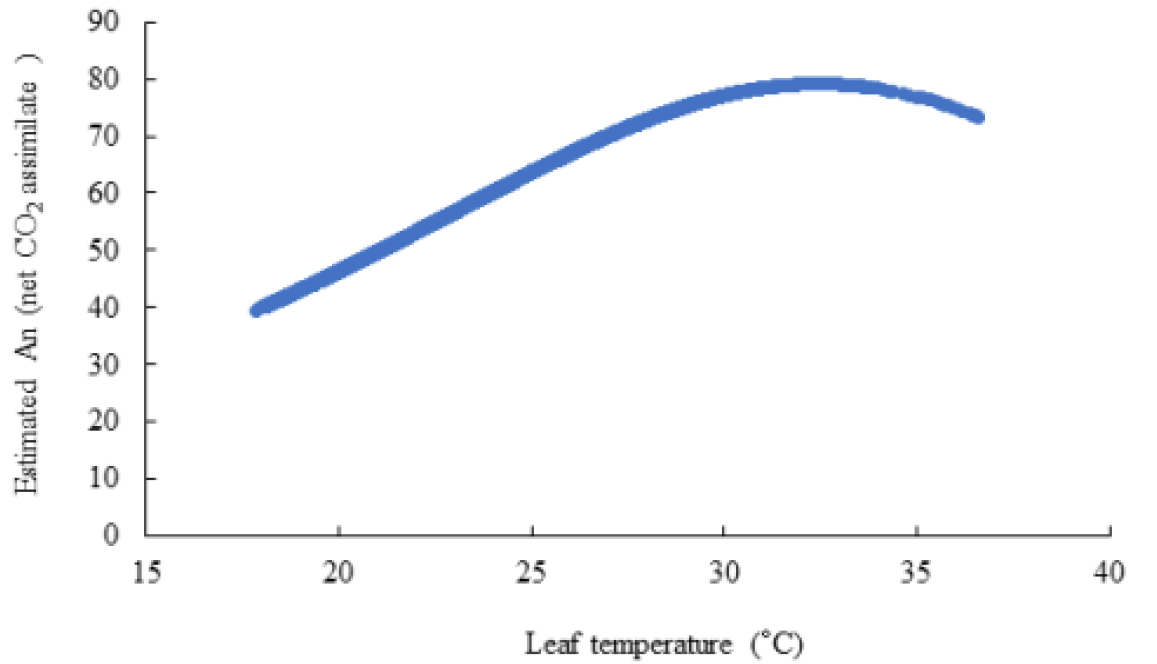
Table 5. shows the leaf temperature dependence of Vcmax and Jmax. While 25°C-normalized Vcmax increased with leaf temperature from 20 to 33°C, the J declined at the 33°C leaf temperature. Our estimates of Vcmax and Jmax were close to the measurements with the declined Jmax at the leaf temperature higher than 30°C, and a leaf temperature optimum for the estimated Jmax was 30°C (Table 5). Leuning (2002) examined the temperature-dependent Vcmax and Jmax using published datasets and showed a high variability of Jmax/Vcmax between and within species at leaf temperature > 30°C with Jmax0/Vcmax0 = 2·00±0·60 (SD, n=43), at leaf temperature = 25°C with a temperature optimum near 40°C for Vcmax, and 35°C for Jmax of cotton plant (Harley et al., 1992). The Arrhenius function [f(Tl)] value was in the order of 0.772 at 20°C, < 0.984 at 25°C, < 1.219 at 30°C, and < 1.466 at 33°C of leaf temperature. The thermal breakdown [fH(Tl)] value was in the order of 1.102 at 20°C > 1.008 at 25°C > 0.847 at 30°C > 0.651 at 33°C of leaf temperature. The calculated Rd increased according to the leaf temperature. In this experiment, the leaf temperature was increased from 20°C to 35°C with 5°C increment and A-Ci response curves were recorded at each temperature; however, at least 10 min of steady state at the reference CO2 levels should not have, resulting to maximum 33°C of leaf temperature (Fig. 2). The estimated An decreased at the high leaf temperature. The extimated photosynthetic rates were saturated at al leaf temperature of 32.4°C (Fig. 3)
Table 5.
Comparison of Rubisco maximum carboxylation rate (Vcmax), maximum electron transport rate (Jmax), leaf respiration under daylight (Rd) from gas exchange measurements and calculations and calculated Arrhenius function [f(Tl)], and thermal breakdown [fH(Tl)] with different leaf temperatures in a semi-closed greenhouse for tomato cultivation.
| Outputs | At Leaf Temperature | Normalized to 25°C | Calculated at 25°C |
| 20°C | |||
| Vcmaxz | 72 | 113 | 56.86 (±0.061) |
| Jy | 128 | 174 | 111 (±0.067) |
| TPU | 9.3 | 13.0 | |
| Rd | 5.6 | 7.7 | 0.836 (±0.001) |
| f (Tl) | 0.772 (±0.001) | ||
| fH (Tl) | 1.102 (±0.000) | ||
| 25°C | |||
| Vcmax | 124 | 126 | 76.80 (±1.210) |
| J | 159 | 160 | 129 (±0.971) |
| TPU | 11.1 | 11.3 | |
| Rd | 8.1 | 8.2 | 1.16 (±0.021) |
| f (Tl) | 0.984 (±0.014) | ||
| fH (Tl) | 1.008 (±0.007) | ||
| 30°C | |||
| Vcmax | 213 | 149 | 91.39 (±1.489) |
| J | 195 | 153 | 134 (±0.320) |
| TPU | 13.0 | 10.5 | |
| Rd | 11.1 | 8.6 | 1.565 (±0.052) |
| f (Tl) | 1.219 (±0.029) | ||
| fH (Tl) | 0.847 (±0.022) | ||
| 33°C | |||
| Vcmax | 318 | 161 | 95.76 (±0.202) |
| J | 231 | 146 | 124 (±1.847) |
| TPU | 15.8 | 11.6 | |
| Rd | 15.6 | 9.6 | 2.03 (±0.058) |
| f (Tl) | 1.466 (±0.029) | ||
| fH (Tl) | 0.651 (±0.024) | ||
zy: Rubisco maximum carboxylation rate (Vcmax) and electrical transport rate (J) from the A-Ci curve response to different leaf temperatures, the leaf temperature was increased from 20°C to 35°C with 5°C increment and A-Ci response curves were recorded at each temperature with 700µmol·m-2·s-1 PAR value.
According to the multiple regression analysis by the stepwise variable selection method, the partial R-square for the Vcmax, a dependent variable, was larger with the leaf temperature (0.9860) than the other factors, Jmax (0.0123) or air temperature (0.0001) (Table 6). When the An, net photosynthesis rate, was set as a dependent variable, the partial R-square was also larger with the leaf temperature (0.9860), followed by calculated leaf respiration (0.011) (Table 7). The dependence of Vcmax on temperature has been described by an Arrhenius function since it increases over a wide range of temperatures and does not deactivate until very high, near-lethal temperatures (> 50°C) (Leuning, 2002). Medlyn et al. (2002a) showed apparent species differences in comparing the responses of Jmax to temperature from different studies. Further study is necessary to determine whether Jmax temperature responses differ by elevated growth CO2 levels. Estimated Jmax, An, and thermal breakdown decreased due to increased leaf temperature (> 30°C). The photosynthetic rates of the fifth leaves from the apical region were saturated at a light intensity of 1200 µmol·m-2·s-1 and reached the saturation point at a CO2 concentration of 1000 µmol from June to August. Jung et al. (2015) developed two-variable leaf photosynthetic models of Irwin mango to determine adequate light intensity levels and CO2 concentrations for mango grown in greenhouses. In that study, results showed that photosynthetic rates of top leaves were saturated at a light intensity of 400µmol·m-2·s-1, while those of middle and bottom leaves saturated at 200µmol·m-2·s-1, indicating photosynthetic rates can be estimated differently for validation of the model. Scarascia- Mugnozza et al. (1996) suggest that the long-term acclimation to high CO2 could result a down-regulation of photosynthesis by reducing rubisco activity, stomatal aperture and density. The present study suggests that optimal conditions of CO2 concentration could be determined for improving photosynthetic rates of fruit vegetables grown in greenhouses by using the photosynthetic model equation.
