

Introduction
Open hydroponic system is the most widely used hydroponic system in Korea (Seo, 1999). Crops grown on a substrate in open hydroponic system are usually over-irrigated with nutrient solution by 20-40% to avoid accumulation of salts in the medium (Fricke, 1998; Giuffrida et al., 2003). However, drainage from this practice causes significant environmental pollution with loss of water and nutrients. A recirculating irrigation system has been applied to hydroponic systems to overcome these problems, but this causes a significant change in the ratio of certain ions as well as the accumulation of undesirable ions in the root zone (Ehret et al., 2005; Zekki et al., 1996). Environmental and economic concerns regarding nutrient contamination are growing (Giuffrida et al., 2003), and the leaching of drain water with high concentrations of agrochemicals from greenhouses to soil in the Netherlands has been prohibited to protect groundwater quality (Runia and Amsing, 2001). Thus, there is a need to develop a minimum-drainage or -free open hydroponic system suitable for a particular substrate, for which irrigation volume and timing must be managed depending on the water requirements of the crop to avoid leaching of nutrient-rich solution. Many studies of cultivating plants in soil have approached efficient irrigation scheduling based on threshold values of volumetric soil water content using soil moisture sensors (Cardenas-Lailhacar et al., 2010; Jaimez et al., 1999; Romero et al., 2009), crop water requirement (Allen et al., 1998), canopy temperature (Ben- Asher et al., 1992), sap flow (Fernandez et al., 2008), or a combination of soil water content and weather data (Zhu and Li, 2011). However, there are practical difficulties applying commercial automatic irrigation controllers using plant-based measurements for farmers (Jones, 2004; Romero et al., 2012). Irrigation schedules based on soil moisture monitoring (Fares and Polyakov, 2006; Papadopoulos et al., 2008; Thompson et al., 2007) and irrigation timing (Warren and Bilderback, 2004) were automated by using water content sensors, such as time domain reflectometry (TDR) and frequency domain reflectometry (FDR) sensors. In our previous studies (Choi et al., 2013a; 2013b; 2014, 2015), a FDR-automated irrigation (FAI) system was developed, suggesting the thresholds for irrigation scheduling with least water waste and fertilizer loss. The thresholds are useful information to determine the irrigation amount and frequency. The aim of this study was to determine optimal length of time between irrigation cycles to improve irrigation efficiency using the FAI system.
Materials and Methods
1 Plant growth and conditions
Two experimental cultivations were carried out in a polyethylene film greenhouse of the University of Seoul. The first experiment was started on the 11th of October, 2013 and lasted until the 21th of January, 2014 (defined as P1), and the second one started on the 13th of March and lasted until the 2nd of July, 2014 (defined as P2). For the both cultivations, total of 24 seedlings of 60-day old tomato (Solanum lycopersicum L. ‘Dabok’) were planted for each treatment at density of three plants per coir slab (100cm × 20cm × 10cm, dust:chip (v/v) = 100:0%, Sivanthi Joe, Tamil Nadu, India). Prior to the transplant, the coir slabs were washed off by tap water in about pH 6.2 and EC 0.15dS·m-1 till its EC value of the slabs reached to 0.30dS·m-1. Eight coir slabs per treatment were placed in a heated polyethylene film greenhouse. A FDR sensor (WT1000N, Mirae-Sensor®, Korea) with a three-rod probe, 65mm in length was vertically located in a representative slab per treatment. Nutrient solution with pH 5.8 and EC 2.0dS·m-1 was supplied with a drip irrigation system after transplant. The plants were grown vertically with one stem, and pruned above the third flower cluster during the autumn to winter cultivation and above the forth flower cluster during the spring to summer cultivation. Only 3 fruits were left after fruit setting in one flower cluster. A nutrient solution was supplied with a drip irrigation system. The nutrient solution composed by the Glasshouse Crops Research and Experiment Station at Naaldwijk in the Netherlands was supplied from a 125 L of tank containing a water pump (55W, Hyupsin®, Korea). The nutrient solution composition was in the following: Nitrate nitrogen (NO3-N) 13.75 milliequivalent L-1 (me L-1); ammonium nitrogen (NH4-N) 1.25me L-1; P 3.75me L-1; potassium (K) 8.75me L-1; calcium (Ca) 8.5me L-1; magnesium (Mg) 4.0me L-1; sulfur (S) 7.5me L-1; Fe 0.84 ppm, Mn 0.55ppm, Zn 0.33ppm, Cu 0.05ppm, B 0.33ppm, Mo 0.05ppm. The amount of water irrigated and drained was daily measured until the 12th of July, 2011. During the study, the temperature, relative humidity, carbon dioxide (CO2) concentration and photosynthetically active radiation (PAR) were recorded every 30 minutes using the ALMEMO® 2890-9 device (AHLBORN, Holzkirchen, Germany), which has data processing and compiler systems. Some data gathered in a Universal Serial Bus (USB) by the ALMEMO data compiler were transferred to a computer.
2 Automated irrigation system using a FDR sensor
When the volumetric water content in the coir substrate reached experimentally set trigger points, irrigation was automatically initiated, and the water sensor stopped irrigation when the stop set point of substrate moisture was reached. Irrigation-on and -off hours were modified depending on daily times of sunrise and sunset. Irrigation was started one hour after sunrise, and ended three hours before sunset. The volumetric water content levels used in this experiment were pre-determined from our previous studies by taking account for the volumetric water content at field capacity (Park et al., 2014). The data of volumetric water content, EC and temperature in the root zone of substrate were saved every 10 minutes in a data-logger (WT600, Mirae-Sensor®, Seoul, Korea) connected to the sensors. The data was then downloaded and analyzed along with excel spread sheet. The water content of the substrate monitored by the FDR sensor was quantified as internal capacitance of the substrate using high-frequency pulses, while the EC value was quantified as both of the internal capacitance and resistance value using low-frequency multiple pulses, which allows measurement of both the water content and ion concentration in the substrate at the same time. The voltage values for the water content and ion concentration were calculated by assessing different numbers of high-frequency pulses returned after converting the high-frequency pulse into the direct current (DC) in a current conversion circuit by a matching transmitter set between antennas and oscillators of high-frequency pulse. In addition, the conductivity sensor was temperature corrected. The probes were calibrated in the laboratory using a mixture of water in glass beads in 43.8% of water saturated volume (TRIME, Ettlingen, Germany) to provide well defined water content.
3 Treatments for minimum length of time between irrigation cycles
When any irrigation event and the subsequent water dis tribution within the substrate did not reach the set point, a subsequent irrigation event was conducted after a 5-, 10-, or 15 minute off-time. For treatments, the 5-minute offtime length between 3-minute run-times (defined as 3R5F), 10-minutes off-time length between 3-minute run-times (defined as 3R10F), or 15-minute off-time length between 5-minute run-times (defined as 5R15F) were set. During the 3-minute or 5-minute run-time, a 60mL or 80mL of nutrient solution was irrigated to each plant, respectively.
4 Measurement of daily irrigated, drained and retained water volumes
Daily irrigated water volume per plant was determined by measuring collected nutrient solution emitted from a spare dripper. Daily drained water volume was determined by measuring collected water daily draining out of the drainage hole at the middle of the bed. Drainage ratio was calculated as follows:
Drainage ratio (%) = {100 × (daily drained water volume per plant ÷ daily irrigated water volume per plant)}.
5 Measurements of plant parameters, marketable fruit yield and soluble solids content
For the both cultivations, the fresh weights of leaves and stems of 16 plants per treatment were measured at the final harvest. Marketable fruit yield and soluble solid content were determined in fruit harvested from the first to third truss during the autumn to winter cultivation, and from the first to forth truss during the spring to summer cultivation. Observations were made between the 4th of November, 2013 and the 22nd of January, 2014 for the autumn to winter season and between the 28th of May and 4th of July, 2014 for the spring to summer season. The data of fruit weights and soluble solid contents are presented as means of 66 replications per treatment for the autumn to winter season and as 230 replications per treatment for the spring to summer season in a completely randomized design.
6 Calculation of water use efficiency (WUE)
WUE was calculated as a function of the applied irrigation water retained in the substrate. WUE = {leaf, stem, and fruit fresh weight at harvest ÷ (applied irrigation volume leachate)}.
7 Statistical Analysis
The data from the autumn to winter cultivation were subjected to analysis of variance (ANOVA) with SAS 9.2 software package (SAS Institute, Cary, NC). The experiment was set up as a randomized complete design. Significant mean separation is indicated by Duncan’s Multiple Range Test (DMRT) at the 5% level, where the F value is significant. For the analysis of data from the spring to summer cultivation, the T-test was used as statistical analysis method using the SAS 9.2 software package (SAS Institute, Cary, NC, USA).
Results
1 Growing Environments
During autumn and winter cultivation, relatively high CO2 concentration was maintained in the greenhouse during the day time. This is associated with the heater is operated in the winter while ventilation is restricted (no data shown). The lowest temperature at the night was about 11°C. Relative humidity is maintained at a high level from the night to the dawn, maximally 100%, while at the noon it was maintained between 50 and 70% with the lowest level, 11%. During the spring and summer cultivation (March to July), a greenhouse CO2 concentration maintained the range of 870 ppm at least 136 ppm. The highest temperature was 37°C and the lowest level was 9.5°C. Relative humidity was maintained at least 16% up to 100%. The PAR ranged up to 1122μmol·m-2·s-1 (no data shown). CO2 concentration was maintained higher from evening to morning than in the morning and noon time.
2 Daily average irrigation volume and drainage ratio
While the water set point was amended depending on the growing stage, daily irrigation volume (mL/plant/day) and the drainage ratio (%) was observed (Table 1). Until 62 days after transplant (DAT) during the autumn to winter cultivation, both daily irrigation volume and its drainage ratio were in the order of 3R5F > 5R15F > 3R10F treatment. Until 62 days after transplant during the autumn to winter cultivation, daily irrigation volume per plant in the 3R5F treatment was 2.8-fold higher, 858 mL (±64), than that in the 3R10F treatment, 306 mL (±25), and 2.1-fold higher than in the 5R15F treatment, 409 mL (18±). The drainage ratios were in the order of 3R5F > 5R15F > 3R10F. The drainage ratios of 3R5F, 5R15F and 3R10F treatments were about 44% (±2.4), 23% (±2.0), and 14% (±2.4), respectively. Between 63 and 102 DAT, daily irrigated volume was higher in the 3R5F, 695mL (±33), than that in the 3R10F, 524mL (±24), while no significant difference in the drainage ratio between the 3R5F (11%) and 3R10F (13%) was found. At the period, the highest irrigation volume and drainage ratio were in the 5R15F treatment, 888mL (±63) and 19% (±2.6), respectively.
Table 1.
Set point of water content (SPW, %), average irrigation volume (Irri., mL/plant/day) and average drainage ratio (drain., %) days after transplanting (DAT) during the autumn to winter cultivation (P1, 11thOctober 2013 to 21st January 2014) and spring to summer (P2, 13thMarch 2014 to 2ndJuly 2014). For the treatments, the 5-minute off-time between 3-minute run-times (defined as 3R5F), 10- minutes off-time between 3-minute run-times (defined as 3R10F), or 15-minute off-time between 5-minute run-times (defined as 5R15F) were set.
| Period | DAT | SPW | 3R5F | 3R10F | 5R15F | |||
|---|---|---|---|---|---|---|---|---|
| Irri. | Drain. | Irri. | Drain. | Irri. | Drain. | |||
| P1 | 13-62 | 65 | 858(64) | 44(2.4) | 306(25) | 14(2.4) | 409(18) | 23(2.0) |
| 63-102 | 60 | 695(33) | 11(1.6) | 524(24) | 13(1.7) | 888(63) | 19(2.6) | |
| P2 | 15~23 | 68-70 | 610(137)z | 8.7(4.0) | 333(65) | 0.0(0.0) | ||
| 24~41 | 68-66 | 1049(114) | 2.9(1.4) | 948(96) | 1.4(1.0) | |||
| 42~50 | 62-61 | 1226(164) | 0.7(0.3) | 1127(194) | 1.0(0.9) | |||
| 51~65 | 65-64 | 2069(115) | 0.3(0.2) | 2263(130) | 3.4(0.6) | |||
| 66~72 | 66-67 | 2593(143) | 0.0(0.0) | 2598(173) | 0.7(0.0) | |||
| 73~80 | 69-68 | 2686(195) | 0.2(0.2) | 2644(115) | 0.3(0.3) | |||
| 81~110 | 70-72 | 3315(195) | 0.7(0.2) | 2277(134) | 0.07(0.03) | |||
Until 23 DAT during the spring to summer cultivation, daily irrigation volume per plant was 610 (± 137) mL in the 3R5F treatment, which was 2-fold higher than that of the 3R10F treatment, 333 (± 65) mL. At the same time, the drainage ratio in the 3R5F was about 8.7%, while there was no drainage in the 3R10F. Later growth stage than 80 DAT, daily irrigation volume was higher in the 3R5F than the 3R10F, which showed the same result during the autumn to winter cultivation.
3 Changes in substrate volumetric water content, EC concentration and mineral contents
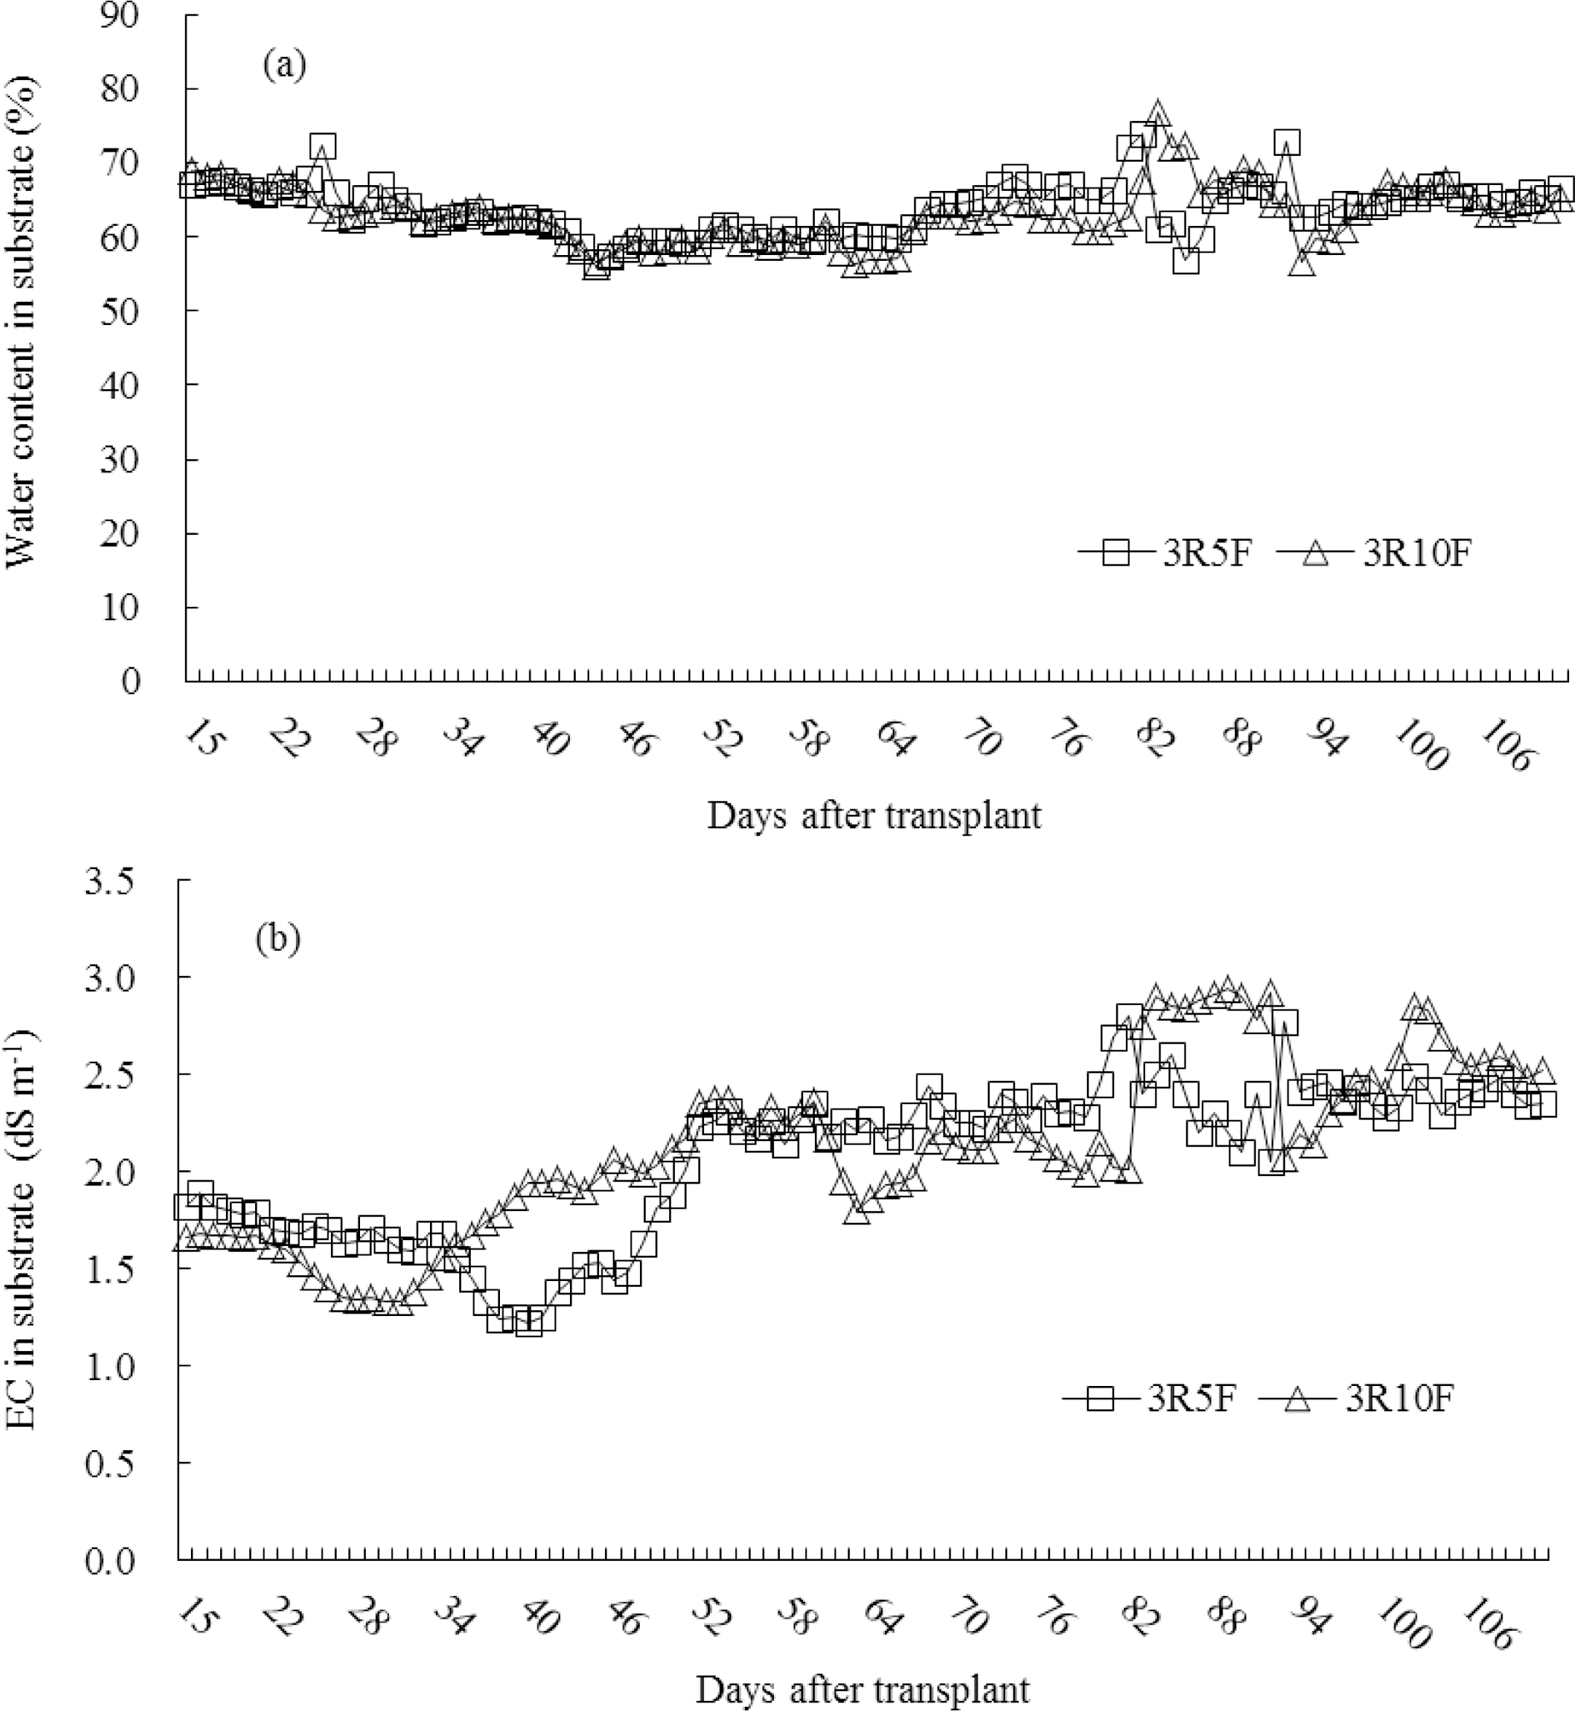
There were no significant differences in the average water content (WC) between the treatments during both cultivations. The substrate water content ranged between 56 and 75% for both treatments during both cultivations (Fig. 1a, Fig. 2a). During the autumn to winter cultivation the substrate EC level ranged between 1.22 and 3.5dS m-1 in the 3R5F treatment, between 1.72 and 2.97dS m-1 in the 3R10F and between 0.7 and 2.45dS m-1 in the 5R15F when the nutrient solution with the EC 2.0dS m-1 was supplied (Fig. 1b). During two months after transplanting, the lowest EC concentration was observed in the 5R15F treatment; however, at the later growth stage, the substrate EC level for all the treatments ranged between 2.5 and 3.0dS m-1. During the spring to summer cultivation the substrate EC level ranged between 1.2 and 2.6dS m-1 in the 3R5F treatment and between 1.3 and 2.9dS m-1 in the 3R10F treatment (Fig. 2b). Slightly higher contents of total nitrogen (N), boron (B) and calcium (Ca) were found in the substrate under the 3R5F treatment than those under the 3R10F during the spring to summer cultivation (Table 3). Compared to the washed new substrates prior to transplant (PT), higher contents of potassium (K) and magnesium (Mg) were observed in the substrates used in the experiment.
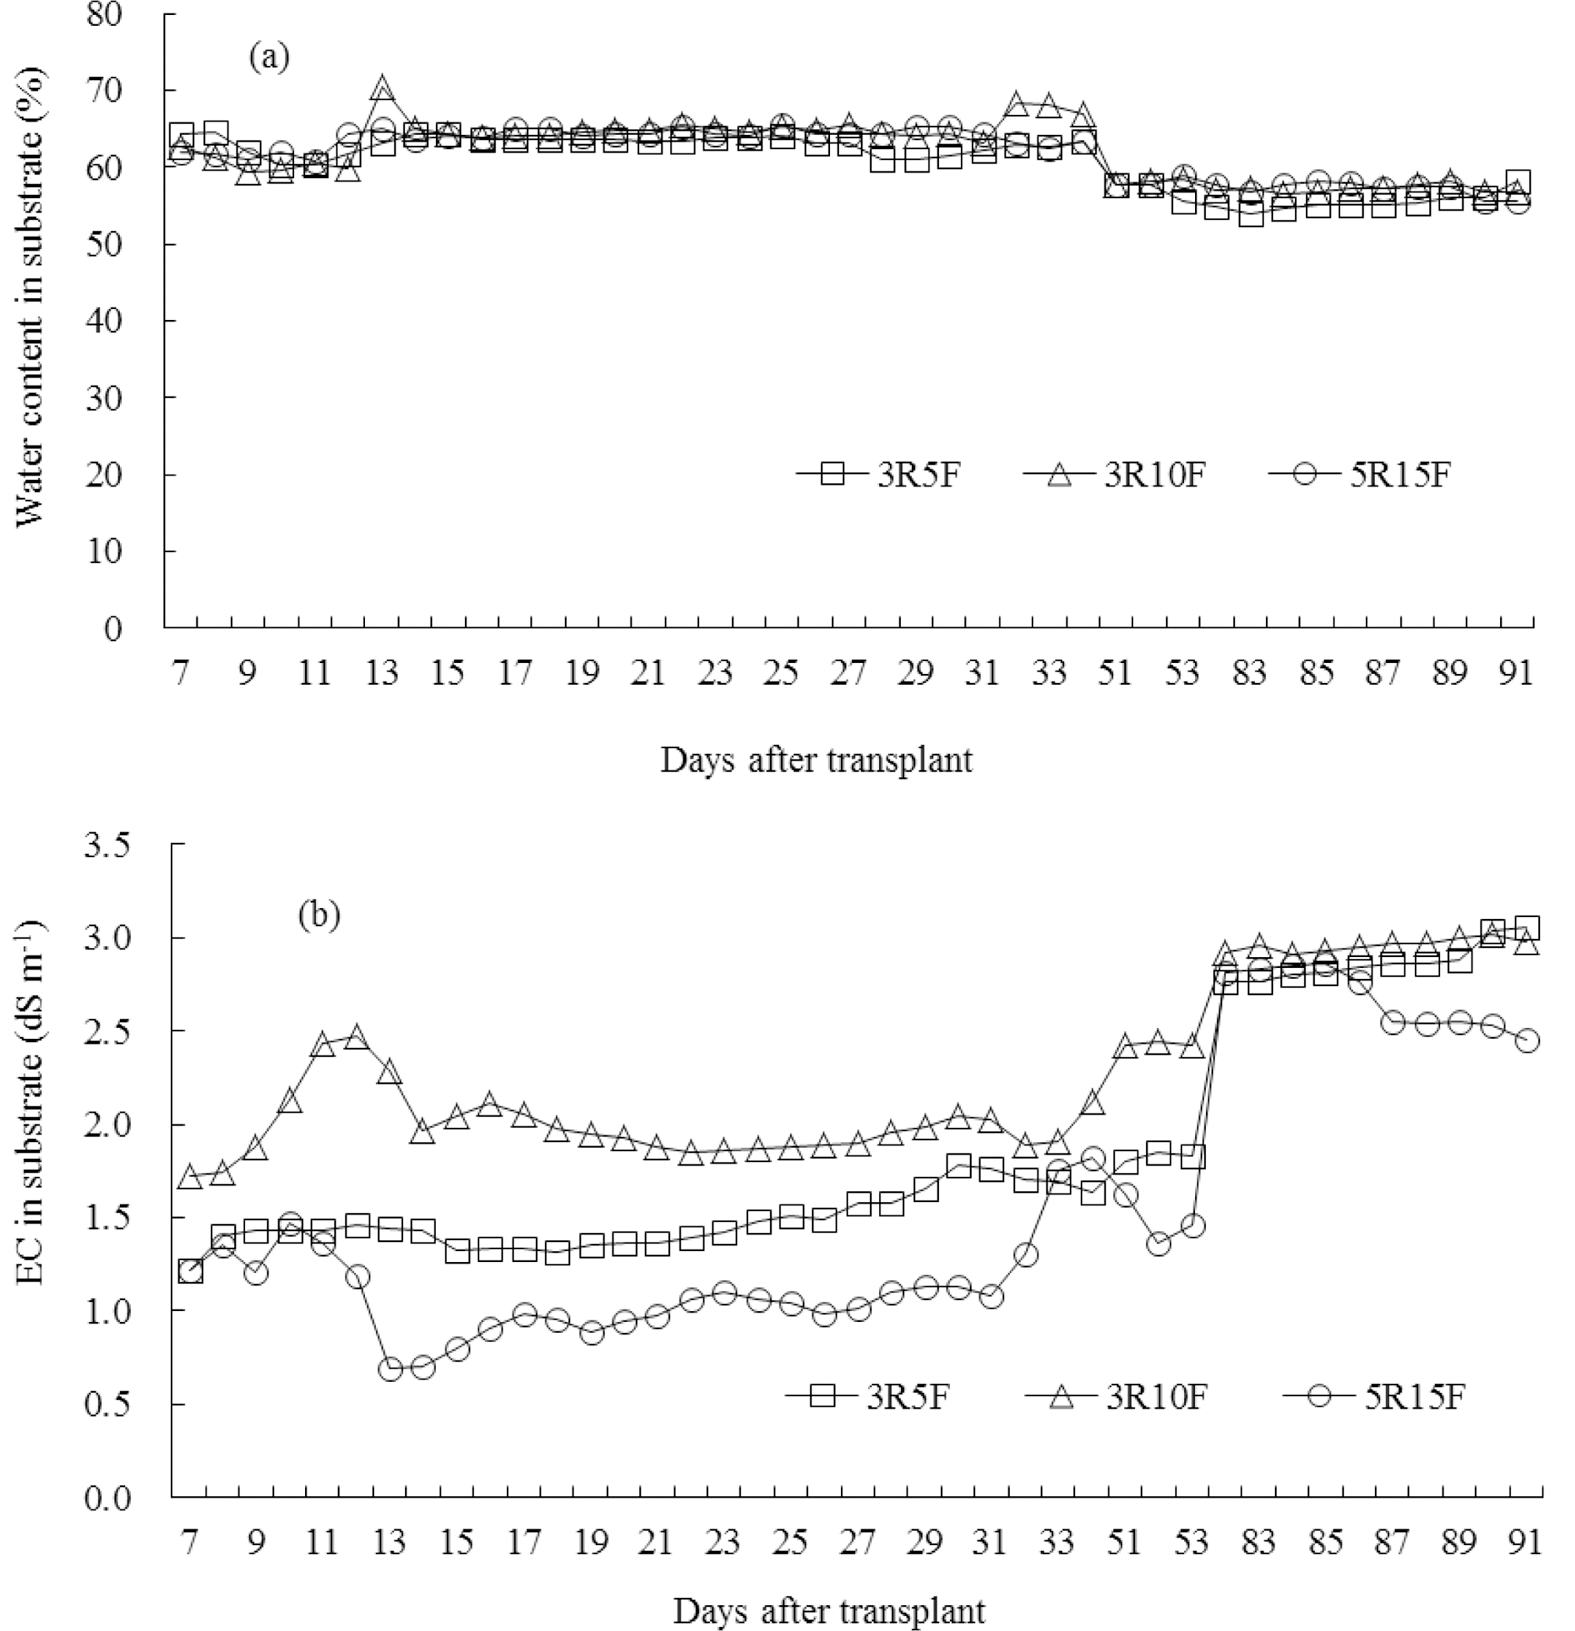
Fig. 1.
Variations in water content (a) and EC concentration (b) in substrate during October 2013 to January 2014 when the 5-minute offtime between 3-minute run-times (defined as 3R5F), 10-minutes off-time between 3-minute run-times (defined as 3R10F), or 15-minute off-time between 5-minute run-times (defined as 5R15F) were set. During the 3-minute or 5-minute run-time, a 60 mL or 80ml of nutrient solution was irrigated to each plant, respectively.
Table 3.
Contents of mineral nutrition(available P2O5 and boron(B), exchangeable potassium (K), calcium (Ca), magnesium (Mg), and manganese (Mn)) in washed new substrates prior to transplant (PT) and after finishing experiment as affected by the off-time length treatments, 3R5F(5-minute off-time between 3-minute run-times) and 3R10F(10-minutes off-time between 3-minute run-times) during spring to summer (13thMarch 2014 to 2ndJuly 2014).
| Treatment | Total N (%) | Available (mg kg-1) | Exchangeable (cmol kg-1) | Exchangeable (mg kg-1 ) | |||
|---|---|---|---|---|---|---|---|
| P2O5 | B | K | Ca | Mg | Mn | ||
| 3R5F | 0.55*z | 43.0 | 7.37* | 15.6 | 35.9* | 22.5 | 7.48 |
| 3R10F | 0.45 | 45.0 | 6.40 | 14.9 | 29.9 | 21.6 | 7.27 |
| PT | 0.41(0.06)y | 47.5(8.4) | 5.49(0.33) | 3.01(0.08) | 37.7(0.4) | 13.2(0.03) | 10.5(0.15) |
4 Plant growth, yield, soluble solid content and water use efficiency
During both cultivations, higher water use efficiency (WUE) was in the 3R10F treatment (Table 2), which was associated with no difference in the plant growth and yield, but with significant lower irrigation volume in the 3R10F treatment, about 48.8% for the autumn to winter cultivation and 18% for the spring to summer cultivation. Also, during the spring to summer cultivation, higher soluble solid content was observed in the 3R10F treatment.
Discussion
A significant decrease in drainage volume was found when tomato plants were cultivated in the treatment 3R10F by minimizing the drainage ratio, whereas irrigation using the treatment 3R5F consumed a large amount of nutrient solution (Table 1). Although the irrigation quantity increased with increasing the preset volumetric water content, there was least leaching under the 3R10F treatment (Table 1). The 3R10F treatment significantly reduced water loss that other treatments, which was to approach zero leaching fractions (Mathers et al., 2005). For irrigation efficiency, it is necessary to slow water movement into the substrate for increase in water retention (Bilderback et al., 2005; Warren and Bilderback, 2005). The length of offtime between irrigation cycles is the time for subsequent water distribution within substrate after irrigation event, through which the FDR sensor can have right amount of information. Schröder and Lieth (2002) suggested that implementation of a sensor-based irrigation controller would include the following additional safety checks: maximum irrigation duration, minimum irrigation duration, minimum length of time between irrigation events, maximum length of time between irrigation events, and tension readings that trigger alarms. Normally, the leaching fraction in open hydroponics ranges between 20 and 40% of supplied nutrient solution to maintain the EC in the substrate at the recommended level (Fricke, 1998; Giuffrida et al., 2003). However, our previous studies suggested that the FAI system produced the least-drainage fraction by closely monitoring daily patterns of the water content and the substrate EC concentration avoiding large amount of salt accumulation in the substrate. The 5R15F treatment produced the highest drainage ratio, 19% (±2.6) between 63 and 102 DAT during the autumn to winter cultivation (Table 1). The result suggests that a 3-minute run-time for a 60mL of irrigation volume reduced water loss much more than a 5- minute run-time for an 80mL of irrigation volume because not as much water would leach from the substrate.
Slightly higher contents of total N, B and Ca were found in the substrate under the 3R5F treatment than those under the 3R10F during the spring to summer cultivation (Table 3) may be due to higher irrigation volume in the 3R5F than those under the 3R10F treatment. However, the substrate EC concentration was not very high, ranging between 1.2 and 2.6dS m-1 (Fig. 2b). For both cultivations, higher water use efficiency (WUE) was under the 3R10F treatment (Table 2). In general, the WUE varies with species and environmental factors (Burnett and van Iersel, 2008). The environmental factors in the present study may have been the frequency of irrigation determined by crop demand under the FAI, which resulted in higher retention of most of the applied nutrient solution in the substrate. Integrated all the data suggest that the optimal off-time length is 10 minutes to improve irrigation efficiency in the FAI system. To date, only a few of hydroponic growers in Korea utilize these water content sensors because of no time for understanding and applying the information from the sensor. Therefore, it is necessary to develop accurate water content sensors and practical irrigation scheduling method using the sensors for the growers that improve irrigation efficiency (Starr and Paltineanu, 1998).
Table 2.
Fresh weights (FW) of leaf, stem, and marketable fruit, soluble solid content (SSC), total irrigated volume per plant, and water use efficiency (WUE) during the autumn to winter cultivation (P1, 11thOctober 2013 to 21st January 2014) and spring to summer (P2, 13thMarch 2014 to 2ndJuly 2014). For the treatments, the 5-minute off-time between 3-minute run-times (defined as 3R5F), 10-minutes off-time between 3-minute run-times (defined as 3R10F), or 15-minute off-time between 5-minute run-times (defined as 5R15F) were set.
| Period | Treat-ment | Leaf FW (g·plant-1) | Stem FW (g·plant-1) | Fruit FW (g·plant-1) | SSC (oBrix) | Irrigation volume (L·plant-1) | Retainedz volume (L·plant-1) | WUEy |
|---|---|---|---|---|---|---|---|---|
| P1 | 3R5F | 684 x | 324 | 2009 | 5.5 | 67.6a | 44.7a | 68.2b |
| 3R10F | 629 | 383 | 2127 | 6.0 | 34.6c | 30.0c | 100a | |
| 5R15F | 777 | 320 | 2019 | 5.2 | 52.7b | 40.8b | 73.3b | |
| P2 | 3R5F | 1080 | 500 | 5028v | 5.6 | 200*u | 189* | 34.6 |
| 1200 | 3R10F | 510 | 5195 | 6.2* | 164 | 160 | 43.5* | |
Acknowledgement. This study was supported through funds provided by The University of Seoul.
