

Introduction
Materials and Methods
Results
1. Tomato cultivation in the greenhouse
2. Paprika cultivation in the greenhouse
Discussion
Conclusion
Introduction
Greenhouse is being considered as useful and widely adopted cultivation system that provides and maintains a controlled environment suitable for better crop growth (Chopda et al., 2018). To control the environmental factors in greenhouse is a complex task, the use of agricultural Internet of Thing (IoT) to monitor the factors within the system is an advanced option, to improve of quality and quantity of crop production with less utilization of water, fertilizer and pesticide especially irrigation scheduling to reduce wasted water and improve water use efficiency by monitoring crop water requirement (CWR) which depends mainly on evapotranspiration, ET (Perera et al., 2015).
ET is the combination of two separate processes whereby water is lost from the soil surface by evaporation and from the crop by transpiration. Evaporation and transpiration occur simultaneously and there is no easy way of distinguishing between the two processes (Allen et al., 1998). In greenhouse, transpiration is the main process to release the water that absorbed by crops to the atmosphere (Bakker et al., 1995). Thus, ET in greenhouse is dominated by transpiration from the plant while the evaporation value is very small due to very small or no open area exists (Fazlil llahi, 2009; Pamungkas et al. 2013; ). In addition, a conceptual approach to estimate crop-ET (ETc) is using reference evapotranspiration (ETo) and a crop coefficient (Kc), where ETo is ETc from the reference surface and Kc is the ratio between actual ETc and ETo (Perera et al., 2015). In another word, the amount of water required to compensate ETc loss from the cropped is defined CWR. As a reason, ETc assessment is necessary to correctly quantify crop irrigation water needs, playing a crucial role in greenhouse and water balance calculations (Choi et al., 2018; Nikolaou et al. 2019).
The most reliable and accurate method to determine ETc is Lysimeters. The difficult, expensive and longtime requirement of the lysimeter method plays an important constraint in the preference of the equations based on climate to determine ETc (Perera et al., 2015). There are various methods available to determine the rate of ETc in greenhouses. These methods calculate for the total amount of water lost through transpiration and evaporation which depends on specific interactions among soil, crops and atmospheric conditions (solar radiation, air temperature, humidity and wind speed) in a greenhouse (Fazlil llahi, 2009). A main condition of the protected system is utilizing the plastic cover on the greenhouse. The plastic significant changes the internal radiation balance and the external environmental conditions, especially absorption and reflection of incident solar radiation (Fernandez et al., 2010).
There was no standard method in order to determine ETc for greenhouse crops. However, the model which was the worldwide most widely used and accepted as a standard for determining crop water requirement was FAO adaptation of the Penman-Monteith equation: P-M (Costa, Poças and Cunha, 2019). For example, Sharma et al. (2017), using P-M equation to compute ETa for drip-irrigated for three water treatments in chili pepper greenhouse: (1) control where water was applied near the surface using two drip emitters, (2) partial root zone drying vertical (PRDv) where subsurface irrigation was applied at 20 cm depth from soil surface, and (3) partial root zone drying compartment (PRDc). The result showed there was no significant difference of ETa in three treatments. Moazed, Ghaemi and Rafiee (2014) reported the results of 13 different common daily ETo estimation methods, namely FAO56 P-M, Hargreaves-Samanι, FAO-24 Blaney- Criddle, FAO-24 Radiation, Priestley-Taylor, Makkink, Turc, Linacre, Jensen-Haise, Copais, Pan Evaporation, Rn- radiation and Rs-radiation were compared with lysimetric measurements in a plastic greenhouse to provide helpful information for selecting the appropriate ETo equation to use. The results indicate that the FAO P-M methods was the most accurate methods for estimating daily ETo in greenhouse conditions. Whereas, the least appropriate method was Linacre. For outdoor conditions, the best and worst results were obtained from FAO24-Radiation and Copias methods, respectively. Next, Alagha and Sangodoyin, 2013 applied P-M model estimating the irrigation water scheduling for tomato. Tomato cultivation was grown on six different soilless media inside a greenhouse in Nigeria. Villarreal- guerrero et al. (2012) compared three ETo models (Stanghellini, P-M and Takakura) for pepper and tomato in the greenhouse. The results showed there were no statistically significant differences among ETo predictions of the three models. Baptista et al. (2005) compared measured ETo using a lysimeter and estimated ETo model using P-M model for tomato crop in a Mediterranean greenhouse. The result presented that estimated ETo values was similar with the measured ETo indicating that the experimental data and model performance agree reasonably well. Moreover, Rahil and Qanadillo (2015) examined four irrigation regimes as follows: farmer irrigation (FI), tensiometer based irrigation (TI), irrigation at full ETc data (ETc), and irrigation at 70% of ETc (70% ETc). The results that the 70% ETc treatment obtained the highest crop yield of 59.52 t ha−1, while the yield for ETc, FI, and TI treatments were 57.27, 55.81 and 45.10 t ha−1, respectively. There was no significant difference in yield between FI, ETc and 70% ETc treatments. While the yield obtained under TI treatment was significantly less than the other treatments. On average, cucumber yield under 70% ETc treatment was 24%, 6% and 4% higher than that under TI, FI and ETc treatments, respectively. At the end of harvesting stage plant height, above-ground dry matter obtained by 70% ETc treatment was higher than the other treatments. Moreover, several researches utilized crop models as essential tool in order to improve productivity, farm management, and yield and growth prediction (Karaca, et al. 2017; Woo, et al., 2000; Papadakis et al, 1994; Yang et al., 1989). Harmato et al. (2005) calculated ETc, based on PM method. Four different levels irrigation: 100, 75, 50 and 25% of ETc were irrigated to tomato. To examine levels of irrigation that affect tomato growth and yield within a poly-net greenhouse in Thailand. Two modes of irrigation application namely continuous and intermittent were used. The experiment showed that drip irrigation at 75% of ETc provided the maximum crop yields and irrigation water productivity.
However, basic obstacle to widely applying the P-M formula requires knowledge of the numerous variables that are not easily available and lack of some variables in many areas (Moazed et al, 2014; Katsoulas and Stanghellini, 2019; ). To complete the formula, more sensors need to implement to measure microclimatic parameters i.e. air temperature, relative humidity, wind speed, global solar radiation, soil temperature as well as specific crop parameter such as the aerodynamic, stomata conductance and leaf temperature. As a result, the most irrigation of greenhouse crops is mainly controlled on the basis of solar radiation due to unavailability of sensing devices and cost consideration (Harman et al., 2005; Sharma et al., 2017). Furthermore, sensors are defined as any instrument, using sensors to collect some types of physical or chemical characteristic and converts that measurement into a signal. It can be read by an observer or automated data collection system. Thus, it is important to understand the different limitations of sensors that affect measurements. Lastly, three qualifications of sensor to be considered: accuracy, precision and resolution to be implement for a particular purpose (van Iersel, Chappell and Lea-cox. 2013).
The main objectives of the study were 1) to assess whether ACW was adequate CWR of tomato and paprika in greenhouse and 2) how much amount of water should be managed for tomato and paprika in the future cultivation.
Materials and Methods
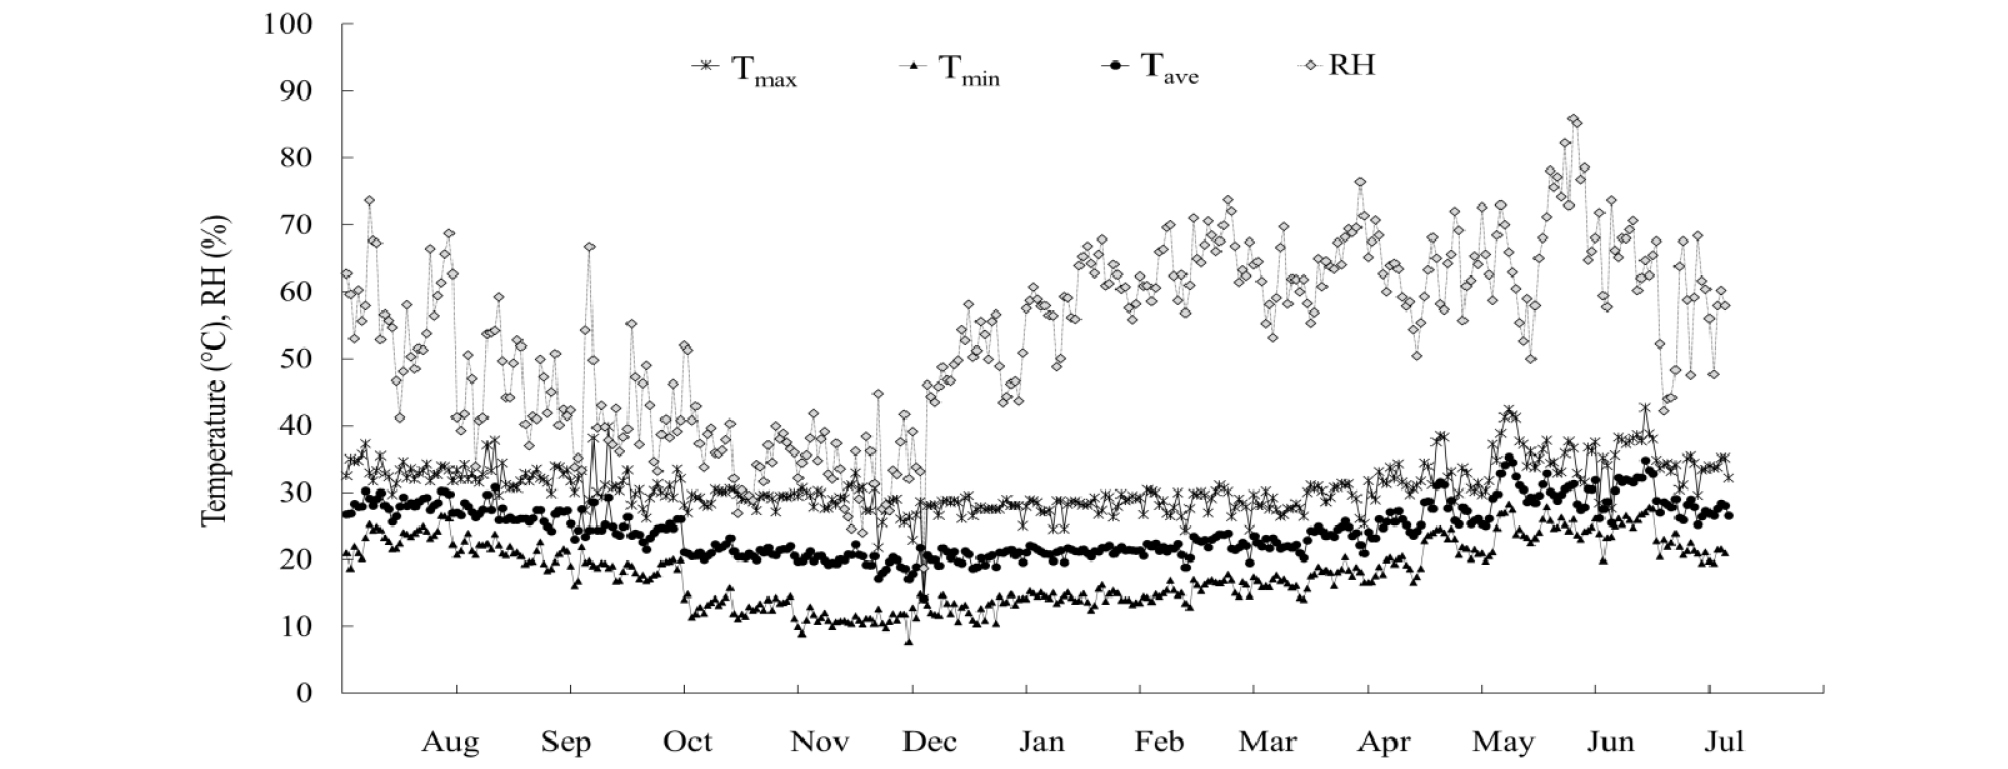
In this study, the cultivation of tomato (Solanum lycopersicum cv. dafnis) was cultivated twice, the first cropping was conducted in November 2017 to May 2018 and the second cultivation was in August 2018 to May 2019 and three paprika varieties (Capsicum annuum cv. sirocco, volante and orandino). Paprika was cultivated during September 2018 to May 2019. The crops were carried out in the greenhouse of the Division of Smart Farm Development located at National Institute of Agricultural Sciences (35°48¢N latitude, 127°44¢E longitude and 37 m altitude). The greenhouse has a dimension of 7 m x 75 m x 4 m (W x L x H) covered with 1.0 mm polyethylene vinyl as cladding material. All climatic data outside and inside the greenhouse were automatically collected by sensors. For the outside greenhouse conditions, air temperature and humidity were measured every 5 minutes using a sensor (WJ-TH0101, Naretrend (Xspark), Bucheon-si, Korea). Precipitation data was measured every 5 minutes using a sensor (DRC3000, Woosung Tech, Yangsan-si, Korea). Wind speed was measured every 5 minutes using a sensor (Davis7911, Davis, USA). Inside the greenhouse, air temperature was measured by a sensor (NTC 10K, Naretrend (Xspark), Bucheon-si, Korea) in every 5 minutes and humidity was measured placed 2 m above the plants using a sensor (FS-220H, Naretrend (Xspark), Bucheon-si, Korea) in every 5 minutes. The averaged data from January 2017 to May 2019 are stored in the Cloud-database system (Baek et al., 2018). The air temperature of the greenhouse has a maximum range of 15ºC to 43ºC and minimum range from 8ºC to 28ºC. RH ranged 20% to 90% (Fig. 1).
Weather data from 2017-2019 were used to calculate the daily reference evapotranspiration (ETo) by P-M equation (FAO, 2005) defined by equation (1) below:
| $$ET_o=\frac{0.408\triangle(R_n-G)+\gamma{\displaystyle\frac{900}{T+273}}u_2(e_s-e_a)}{\triangle+\gamma(1+0.34u_2)}$$ | (1) |
where: ETo is reference evapotranspiration (mm/day), Rn is net radiation at the crop surface (MJ/m2/day), G is soil heat flux density (MJ/m2/day), T is the mean daily air temperature at 2 m height (°C), u2 is wind speed at 2 m height (m/s), es is saturation vapor pressure (kPa), ea is actual vapor pressure (kPa), es – ea is saturation vapor pressure deficit (kPa), D is slope vapor pressure curve (kP/ °C), g is psychrometric constant (kPa/°C).
In this study, daily Tmax, Tmin and Tave. were computed ET using the P-M equation (1) which was calculated into an Excel Spreadsheet. Rn was calculated follow as the equations of Allen et al. (1998). After calculating ETo, the reference evapotranspiration of the grass will be adjusted by the crop specific Kc factor. Kc is called the crop coefficient to the crop evapotranspiration, ETc:
| $${\mathrm{ET}}_{\mathrm c}\;=\;{\mathrm{ET}}_{\mathrm o}\;\ast\;{\mathrm K}_{\mathrm c}\;$$ | (2) |
where: ETc is crop evapotranspiration (mm/day), ETo is reference evapotranspiration (mm/day), and Kc is crop coefficient, Kc of tomato and paprika is 1.15 and 1.05 (Allen et al., 1998).
Next, CWR is the amount of water in milliliter (ml) that should be irrigated to each crop inside the greenhouse derived from ETc (millimeter, mm/day). The conversion from mm to ml followed Tan (1990). ACW was calculated from the difference of amount of nutrient supply water and amount of nutrient drainage water. In addition, nutrition solution that irrigated to tomato was EC values ranged 2.5 to 2.8, pH was 5.5 to 6.5 and defoliation was keeping leave around 11 to 14. For paprika, EC was 2.5 to 3.0, pH was 5.5 to 6.5. While, keeping leave of paprika as possible. Finally, the theoretical model of CWR and ACW were compared and assessed. However, this study was the estimation of ETc or CWR, it will not be actual CWR of each crop in this greenhouse, the estimation could be a guideline of the water control model of each crop for the next cultivation.
Results
1. Tomato cultivation in the greenhouse
1.1. ETo and ETc of tomato
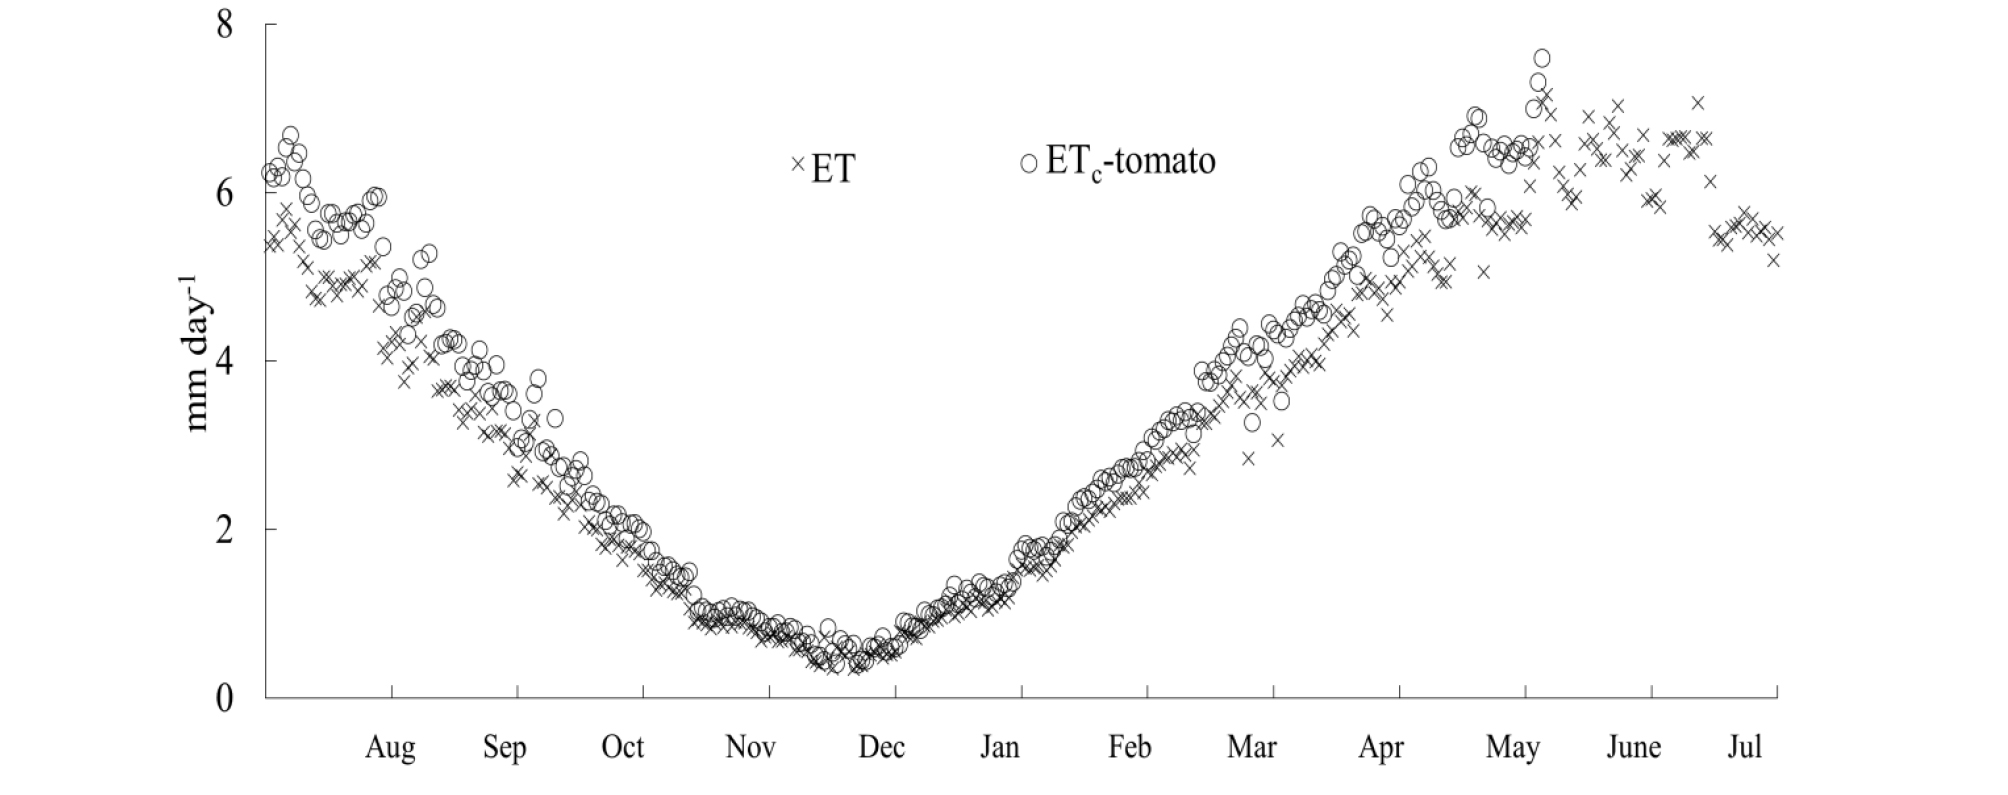
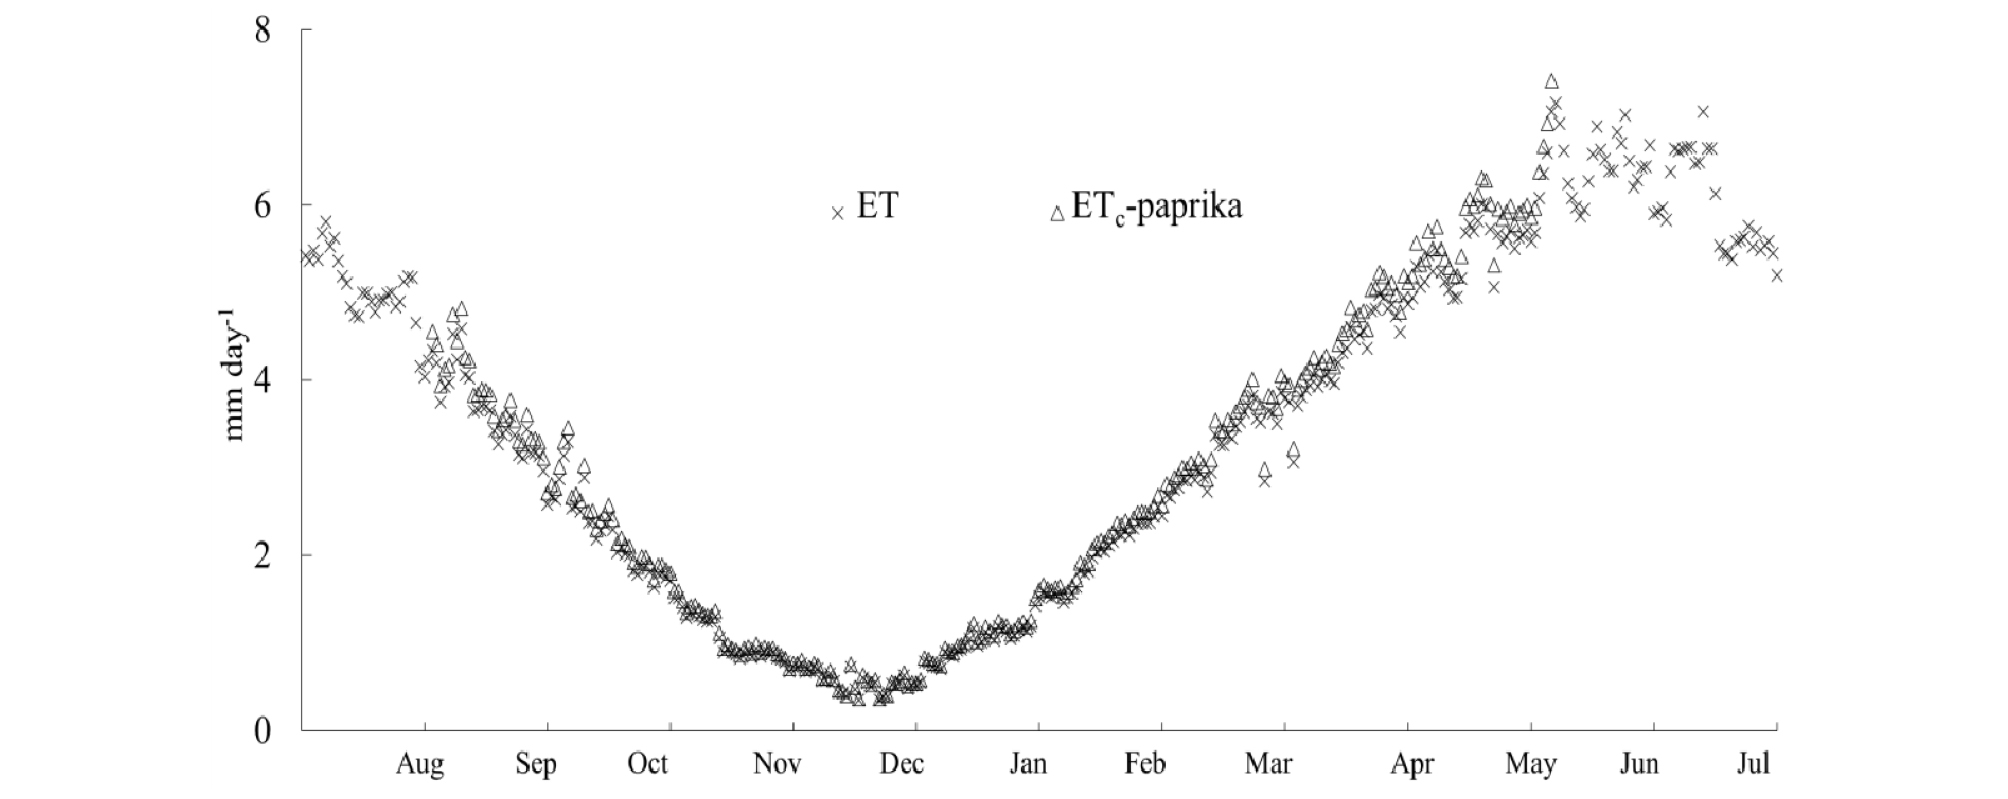
Temperature inside the greenhouse are higher than outside temperature throughout the season while average relative humidity outside is higher than inside of the structure (data not shown). Tomato cultivation in the greenhouse started in August to May. ETo for inside greenhouse were calculated using climatic data. ETo (cross dots) ranges at 0.5 mm/day to 7 mm/day. The highest estimation of ETo was from June to August at 6 mm/day to 7 mm/day while ETo was the lowest from November to February at 0.5 mm/day to 2 mm/day. ETc of tomato is multiplying ETo and Kc tomato is 1.15 (Fig. 2).
1.2 ETc and CWR in developmental stages of first tomato cultivation
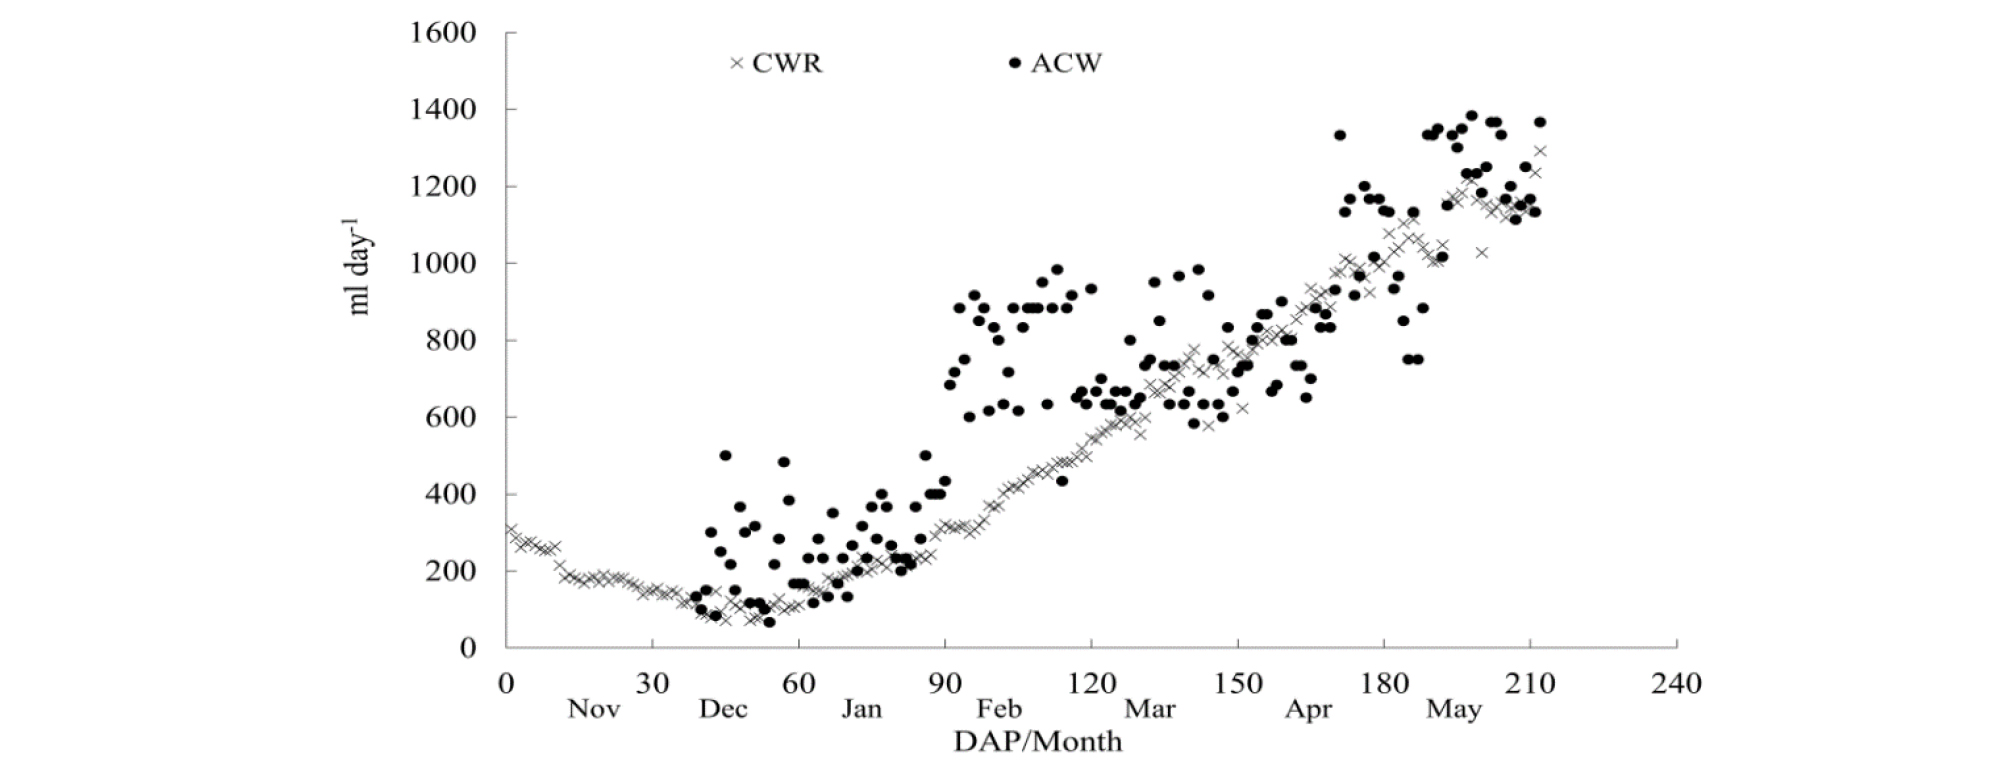
This study has experimented twice cultivations for tomato. The first tomato cultivation was conducted on November 1, 2017 to May 31, 2018 (213 days). ETc of first tomato cropping is shown in Fig. 2. ETc of the initial stage (November) is around 1 mm/day. ETc decreases to reach the lowest values around 0.5 mm/day in December (30-40 Days of planting, DAP) and ETc increases to 6 mm/ day in May. CWR is the amount of water that should be irrigated to tomato. CWR ranges from 100 ml/day to 300 ml/day (90 DAP) and increases from 300 ml/day to 1,300 ml/day until 210 DAP (Fig.3).
The comparison of ACW (round dots) and CWR (cross dots) in different stages is shown in Fig.3. The graph illustrates that ACW is fluctuated. There are days of ACW are greater than estimated CWR from 117 ml/day to 983 ml/day or 21% to 84%. The average of excess water is approximately 570 ml/ day or 45%, from 40 DAP to 130 DAP. While, there are days of actual crop watering are less than CWR from 67 ml/day to 1,133 ml/day or 17% to 95%. The average of less water is around 650 ml/ day or 32% after 130 DAP.
1.3 ETc and CWR in developmental stages of the second tomato cultivation
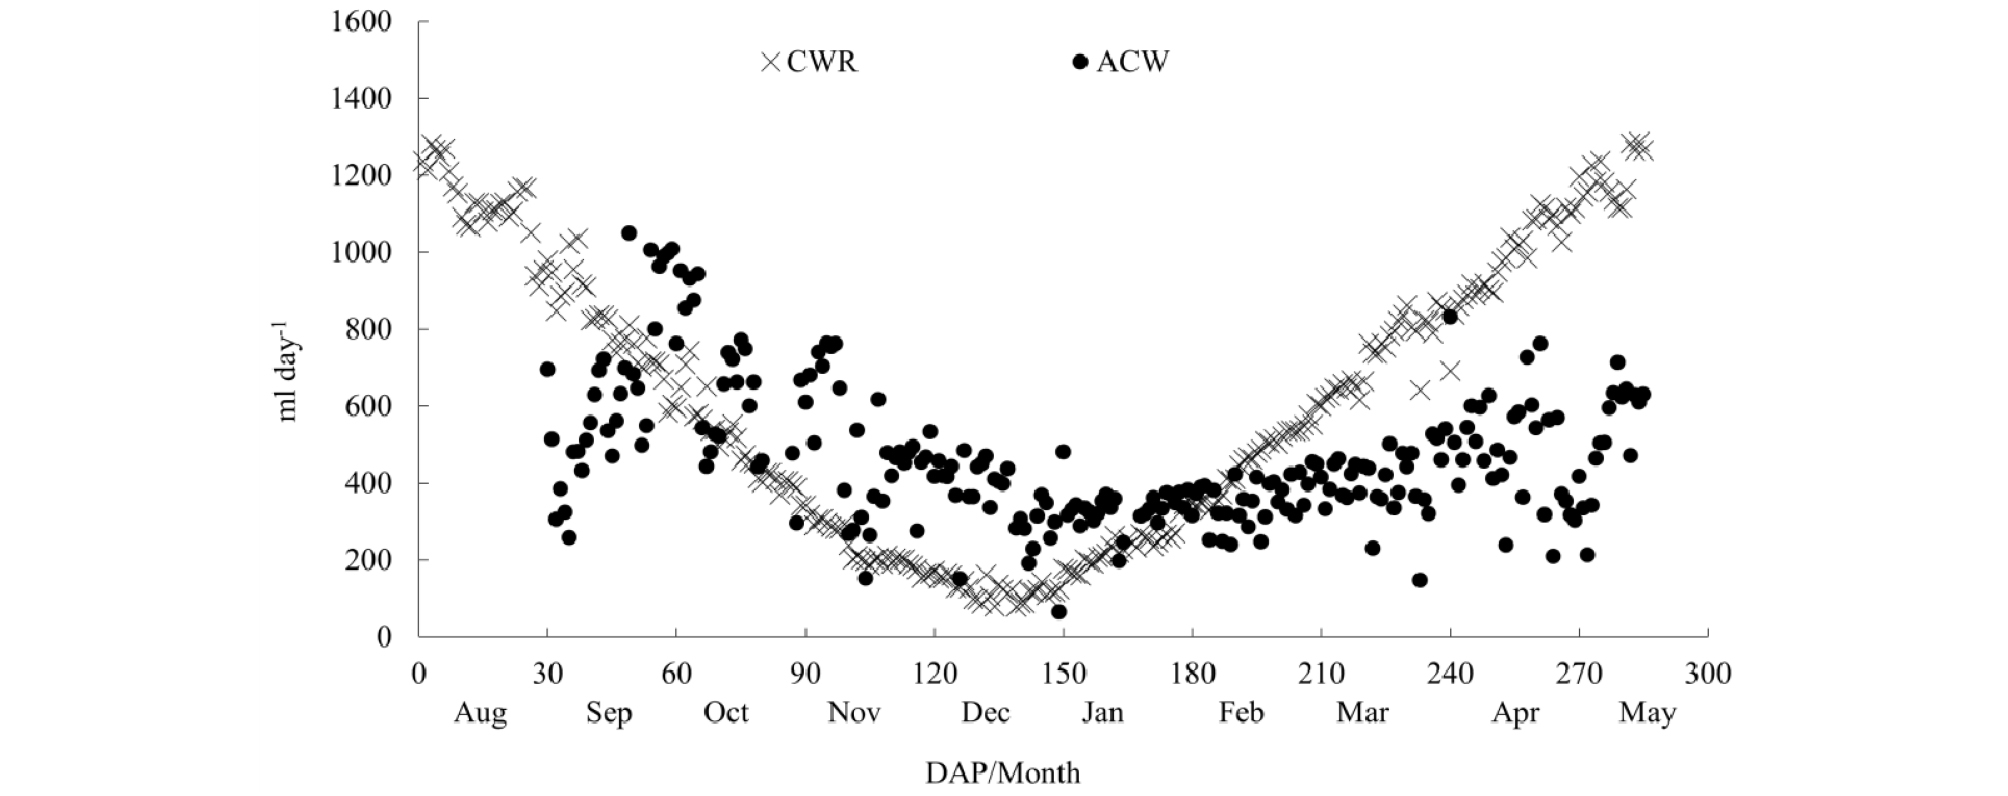
The second cultivation was August 1, 2018 to May 12, 2019 (286 days). As shown in Fig. 2, ETc in August started from 5 mm/day and declined to mm/day in December. ETc continuously increased to 5 mm/day in May. In Fig. 4, during the initial stage, the crop would need water at around 1,200 ml/day. November to January (90 DAP to 150 DAP), CWR is about 100 mm/day to 200 ml/da1. Then, CWR increases from 300 ml/day to 1,200 ml/day (until 286 DAP). ACW was calculated as the 1st tomato cultivation, from September 30, 2018 to May 31, 2019. In Fig. 4, the comparison of CWR and ACW. At the beginning of the cultivation (53 DAP), ACW is less than CWR from 91 ml/day to 764 ml/day or 16% to 300%. The average of the less water is around 335 ml or 80%. From 54 DAP to 190 Day, the graph illustrates that ACW is greater than CWR from 73 ml to 480 ml or 22% to 81%. The average of the excess water is around 236 ml/day or 50%. After 190 DAP until 286 DAP, ACW is less than CWR from 78 ml/day to 944 ml/day or 21% to 443%. The average of the less water is around 402 ml/day or 103%.
2. Paprika cultivation in the greenhouse
2.1. ETo and ETc of paprika
ETo for inside greenhouse were calculated using climatic data. ETo (cross dots) ranges at 0.5 mm/day to 7 mm/day. ETc of paprika by multiplying ETo with Kc-paprika is 1.05. The paprika cultivation started in September 2018 to May 2019 (273 days). ETc of paprika is around 4 mm/day in the initial cultivation (September). ETc decreases to 1 mm/day during November to January then increases to 5 mm/day in April to May (Fig. 5).
2.2 ETc and CWR in developmental stages of the paprika cultivation
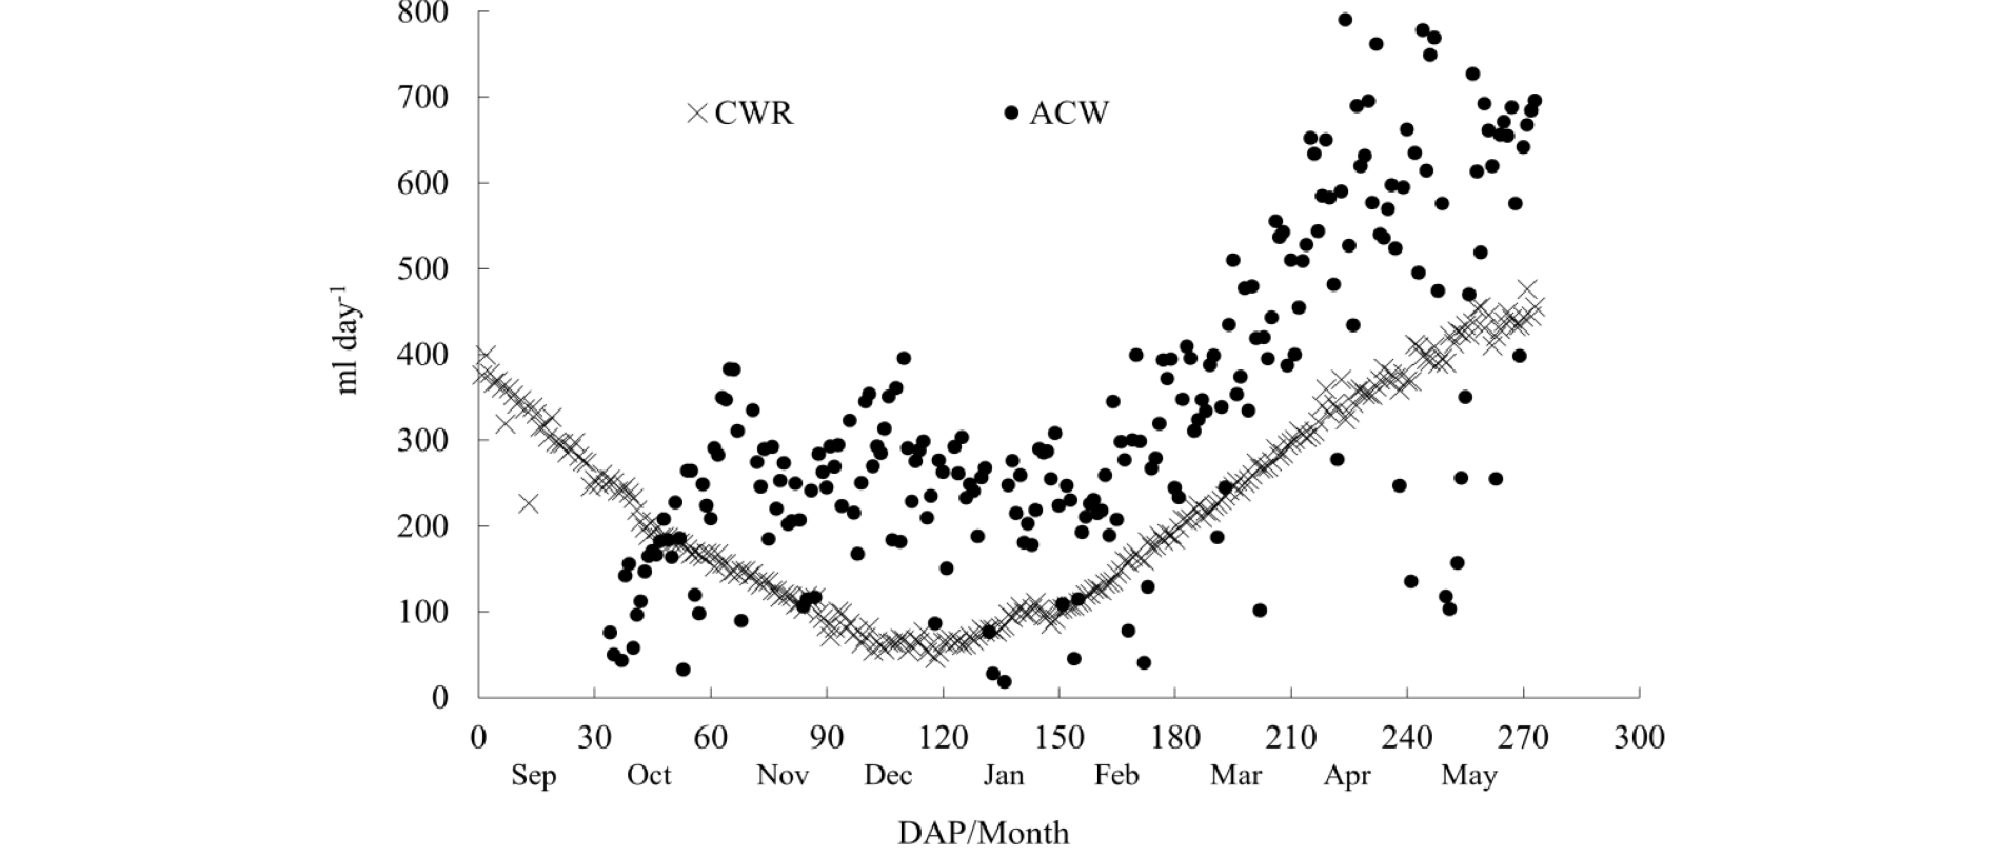
CWR of Paprika is around 100 ml/day to 400 ml/day during September to January. CWR from January to May ranges from 100 ml/day to 500 ml/day. The comparison of CWR and ACW found that at the beginning to 57 DAP, ACW is applied to paprika lower than CWR around 25 ml/day to 200 ml/day or 15% to 460%. The average of less water is 91 ml/day or 150%. After that most of ACW is greater than CWR applied until harvesting around 35 ml/day to 466 ml/day or 15% or 83%. The average of excess water is 178 ml/day or 50% (Fig. 6).
Discussion
From the results ETc of the crops were high due to high temperature of the summer period (September). Later on, ETc started to decline from October to December from 5 mm/day to 0.5 mm/day. During the final phase, ETc increased until reaching high values in May from 0.5 to 7 mm/day. Jayasekara et al. (2018) mentioned the relationship between greenhouse type, greenhouse cover, greenhouse climate, ventilation conditions in the greenhouse, and plant should be examined in detail in greenhouse conditions because these changes are directly related to ETc. Harmanto et al. (2005) explained that ETc for tomato in the tropical country is fluctated according to the microclimate on the respective day and crop development stages. The irrigation of crops will depend on daily climatic data from inside greenhouse directly. Aiswarya et al. (2019) reported ETc value for green chilli inside a greenhouse was found to be less when compared to the open field for all the cultivation due to the less demand for evaporation. However, ETc in the greenhouse and outside in the last period were high due to the full growth period of chilli. Kitta et al. (2014) calculated ETo of sweet pepper in different screenhouses using the P-M model. The screenhouses differed by their shading factors (SF), defined as the complement of the solar radiation transmittance. The result showed different values of ETc in the screenhouse had changed following in the different shading factors in August and September. As a reason, ETc can be influenced by climatic data, DAP, cultivated timing and farming management and types and materials of greenhouses.
In Fig. 3, 4 and 6, in the initial phase, tomato and paprika received ACW and were less than CWR. However, the crop still grew well (data not shown) because even there were insufficient water irrigation, the levels of water shortage of the crops have not reached the permanent wilting point and the irrigation scheduling in the greenhouse was applied every day. The days that received excess water could compensate the days receives less water. As Snyder (1992) reported an important point is that plants should receive enough water that they do not wilt, if plants reach the “permanent wilting point,” tissue is permanently damaged and they will not recover, even with plenty of water. Moreover, in Fig. 3 and 4 found CWR is high at the beginning of the planting, however, in the initial planting as the tomato seedling is still small, it needs less water as Snyder (1992) recommended that newly transplanted plants only need about 50 ml/plant/day. Harmanto et al. (2005) reported tomato (Troy 489 variety) in tropical zone was applied water 100, 75, 50 and 25% of ETc, based on PM model, were tested for their effect on crop growth and crop yield. The results showed that tomato was applied water as 75% of ETc or 4.1 to 5.6 mm/day or 300 to 400 ml/plant/day had a high LAI value 4.8, the highest height was 1.5 m after 75 days planting and the highest yields was 0.44 kg m-2 compared with other treatments.
In addition, this study measured ACW for tomato and paprika as the difference between the amount of nutrient supply water and the amount of drained water. We found some days percentage of the drained water was higher than 20% of both crops as Snyder (1992) mentioned in case of tomato the drainage in the greenhouse should be around 10% to 20%. Thus, reducing ACW for tomato and paprika is recommended in term of saving water. Furthermore, Lizarraga et al. (2003) mentioned that water and fertilizers can be saved, greenhouse systems are not profitable because disinfection of irrigation is expensive. Moreover, some days the crops received ACW than CWR because the irrigation in the greenhouse is measured by the substrate moisture content. When it is less than 20% ACW increase to maintain a range of the moisture of substrate around 20% to 30%. As we mentioned above that there were researchers about ETc in greenhouse using the P-M model to monitor CWR. In contrast, the commercial irrigation in the greenhouse is mainly controlled on the basis of solar radiation as PRIVA system from the Netherlands as implementing in Korean farmers’ greenhouse. The farmers applied this system due to after service of the company and more convenience (field visiting). Nikolaou et al. (2019) stated the level irrigation will depend on either the greenhouse microclimate or on substrate moisture status and irrigation scheduling bases on direct or indirect measurement of plant water status and plant physiology that respond to water deficit. Pérez-Castro et al. (2017) suggested that the substrate moisture content and ETc from climatic data and the constructed decision condition for irrigation scheduling on tomatoes grown directly in soil and soilless systems will be a suitable management in the greenhouse.
Conclusion
We assessed the water control model of tomato and paprika cultivation in the greenhouse using the P-M model to estimate ETc of each crop which as defines as CWR. ACW was calculated from the difference of amount of nutrient supply water and amount of nutrient drainage water. Then, comparisons of ACW and CWR of each crop to assess whether ACW could compensate CWR or not. The comparison of ACW and CWR in each crop shows that ACW of tomato and paprika are less than CWR in the initial phase (60 DAP) around 500 ml/day and 91 ml/day, respectively. However, ACWs of each crop is greater than CWR after 60 DAP until the end of cultivation around 400 ml/day and 178 ml/day. It means ACW can compensate CWR but the amounts of ACW were excessive especially in paprika. As ETc is the optimal method to quantify the amount of irrigation in greenhouse. Thus, reducing ACW will be a recommendation for each crop. The suggestion of ACW for tomato is 100 to 1,200 ml/day and paprika is 100 to 500 ml/day.
To improve the existing irrigation system in terms of water use efficiency and having more precision of ETc in the greenhouse, measurement of ETc directly is needed with the use of class A pan setup is recommended. However, the estimated ETc is ETo x Kc, for this study, Kc values were applied fromAllen et al. (1998); Albuquerque et al. (2012) . for bell pepper crop in Recife, PE, Brazil, and Lozano et al. (2017) for the melon crop in Maringá, PR, Brazil, differed from those suggested in the literature. This further study that Kc must be adjusted for each region. In addition, monitoring volumetric water content using dielectric sensors e.g., time domain reflectometry, frequency domain is suggested. However, ETc was converted to CWR for comparison with ACW. CWR could be overestimated due to the use of fixed maximum value of plant growth for the estimation especially in the initial phase of planting as the seedling is small. As a result, CWR should be less. For future research, applying simulation programs to investigate CWR in real time is needed.
