

Introduction
Materials and Methods
1. A Capacitance-Based Water Measurement Circuit
2. Flat Condenser-Type Sensor
3. Arrangement of Experimental Equipment for Quantification of Water Content of Substrate
4. Quantification of Water Content
Results and Discussion
Introduction
Water movement in plant is regulated by both the water absorbed through the roots and the level of transpiration. If water uptake due to scarcity of water in the root zone does not occur, stomatal conductance decreases as the water potential of the leaves decreases, transpiration is inhibited, and stomata closed, resulting in poor photosynthetic efficiency (Lee et al., 1997; Kim et al., 2017). Water deficit inhibits cell growth, cell wall synthesis, and protein synthesis, thus negatively affecting the growth, shape, productivity, and quality of crops (Hsiao, et al., 1976). Contrast, excessive water in the root zone reduces the vitality of the root and inhibits the supply of oxygen to the plant, thereby reducing photosynthesis and respiration, leading to development of plant metabolic disorders and decreased growth (Kwon et al., 2016). Thus, irrigation timing and quantity need to be determined based on the real-time measurement of the water status of the plant using bio-sensor, or by monitoring of the root zone water using a soil water sensor. title>Introduction
The most important factor for irrigation management is the ability to measure soil water in real time. There are several soil water sensors. For example, a tensiometer measures the metric potential of soil (Smajstria and Locascio, 1997; Erika et al., 1999; Hoppula and Salo, 2006), and the Time Domain Reflectometry (TDR) and Frequency Domain Reflectometry (FDR) sensors measure the change in permittivity according to soil water content (Brandelik and Hubner, 1996; Sim et al., 2006a; Park et al., 2010). Measurement errors in the tensiometer occur easily when the sensor is not placed close contact with the measuring surface of soil (Woo et al., 2000; Sim et al., 2006b; Nemali et al., 2007). Both the TDR and FDR sensors measure the permittivity according to the changes in soil water. The dielectric constant of dry soil is about 2.7, and pure water is over 80 (Topp et al., 1980). Soil water measurement is based on the concept that the dielectric constant in a dry material consisting soil particles and air is relatively small (1.5 to 4) whereas the dielectric water constant is greater (80 at room temperature) (Atkins et al., 1998). TDR determines the dielectric constant and consequently permittivity and water content (directly related) of the medium, which is soil, via analysis of wave propagation transmitted by two parallel embedded metal probes with the utmost accuracy (Baas and Straver, 2001). This method is advantageous because it can quickly and accurately measure a relatively wide range of water content using the relative dielectric constant, but its accuracy decreases when the depth of the substrate is low, such as in bag cultivation, as shorter electrode lengths are associated with lower reliability (Murray et al., 2004). In the FDR sensor, the change in the permittivity according to the water content in the soil manifests as a change in the sensor capacitance. Accordingly, the sensor structure is simple, and the measurement device can be organized in a more simple and cost-effective manner than that considered for TDR device (Rial and Han, 2000). However, when the sensor is not installed in a suitable location, the error value may increase; thus, the selection of the measurement location is important (Park et al., 2010).
The capacitance measuring device is to measure the capacitance over a wide area of the substrate by fixing the insulated condenser electrode plates on either side of the substrate, orienting them to face each other. Permittivity (ε) increases as substrate water and capacitance increases, and this is proportional to the area, and inversely proportional to the distance [C = (ε/D)*A (C: capacitance, ε: permittivity, D: distance, A: area)] (Han et al., 2019). When a pair of electrode plates are fixed on either sides of the substrate and an alternate signal is provided using the electronic device, the impedance varies depending on the water content and water distribution in the substrate. The capacitance is calculated based on the measurement of the impedance and phase values. If there is water in the soil, the permittivity increases, and if a capacitor is designed by considering the soil as a dielectric substance, the permittivity of the dielectric substance changes according to the water content of the soil, thus changing the capacitor capacity. A hydroponic cultivation substrate can be considered as a dielectric mixture of artificial soil and nutrient solution. When the substrate contains more water, the permittivity increases and thus the capacitor capacity increases. Accordingly, by measuring the capacity of the condenser, the water content of the substrate and its change can be determined. The flat capacitance measurement system consists of a pair of waterproof insulated electrode plates, which act as condenser-type water sensors, electronic devices that measure capacitance, and a portable computer that runs the associated software and store and provide output of the measured data. Thus, this experiment was conducted to identify the correction factor to establish the relationship between the capacitance and the water content of the substrate by comparing the change in capacitance according to the water content of a rockwool substrate without a plant.
Materials and Methods
1. A Capacitance-Based Water Measurement Circuit
Fig. 1(A) shows the system configuration of the developed capacitance-based water content measurement and irrigation control system. The software for this system consists of two components; the first is an embedded software (SW) used to operate the manufactured electronic device, and it is controlled by an Arduino Central Processing Unit (CPU) installed in the developed electronic device. The second is a software that allows sensor data to be stored and displayed on the laptop via the Arduino CPU (Fig. 1B); it is used to perform laptop-based control of irrigation based on the measured data. The first software is stored on the electronic device and the second software is stored on the laptop. The measurement device is composed of a frequency generation unit (PLL, phase-locked loop), an amplification unit, an impedance measurement unit, a multiplexer (MUX), a communication unit, and a control unit. The overall system operation conducted was as follows; the PLL determines the frequency of the sine wave to measure impedance, amplifies the signal from PLL at the amplification unit and applied it to the impedance measurement unit. There was also a control unit that could control each part of the measuring device according to the command generated from the program executed on the PC such that the measurement could be performed according to the user’s intention. The control unit adopted the Arduino module, which is widely used in the Internet of Things (IoT) field. The LoRA (Long Range) module was used such that the information measured from the electronic device could be transmitted wirelessly to the irrigation control device.
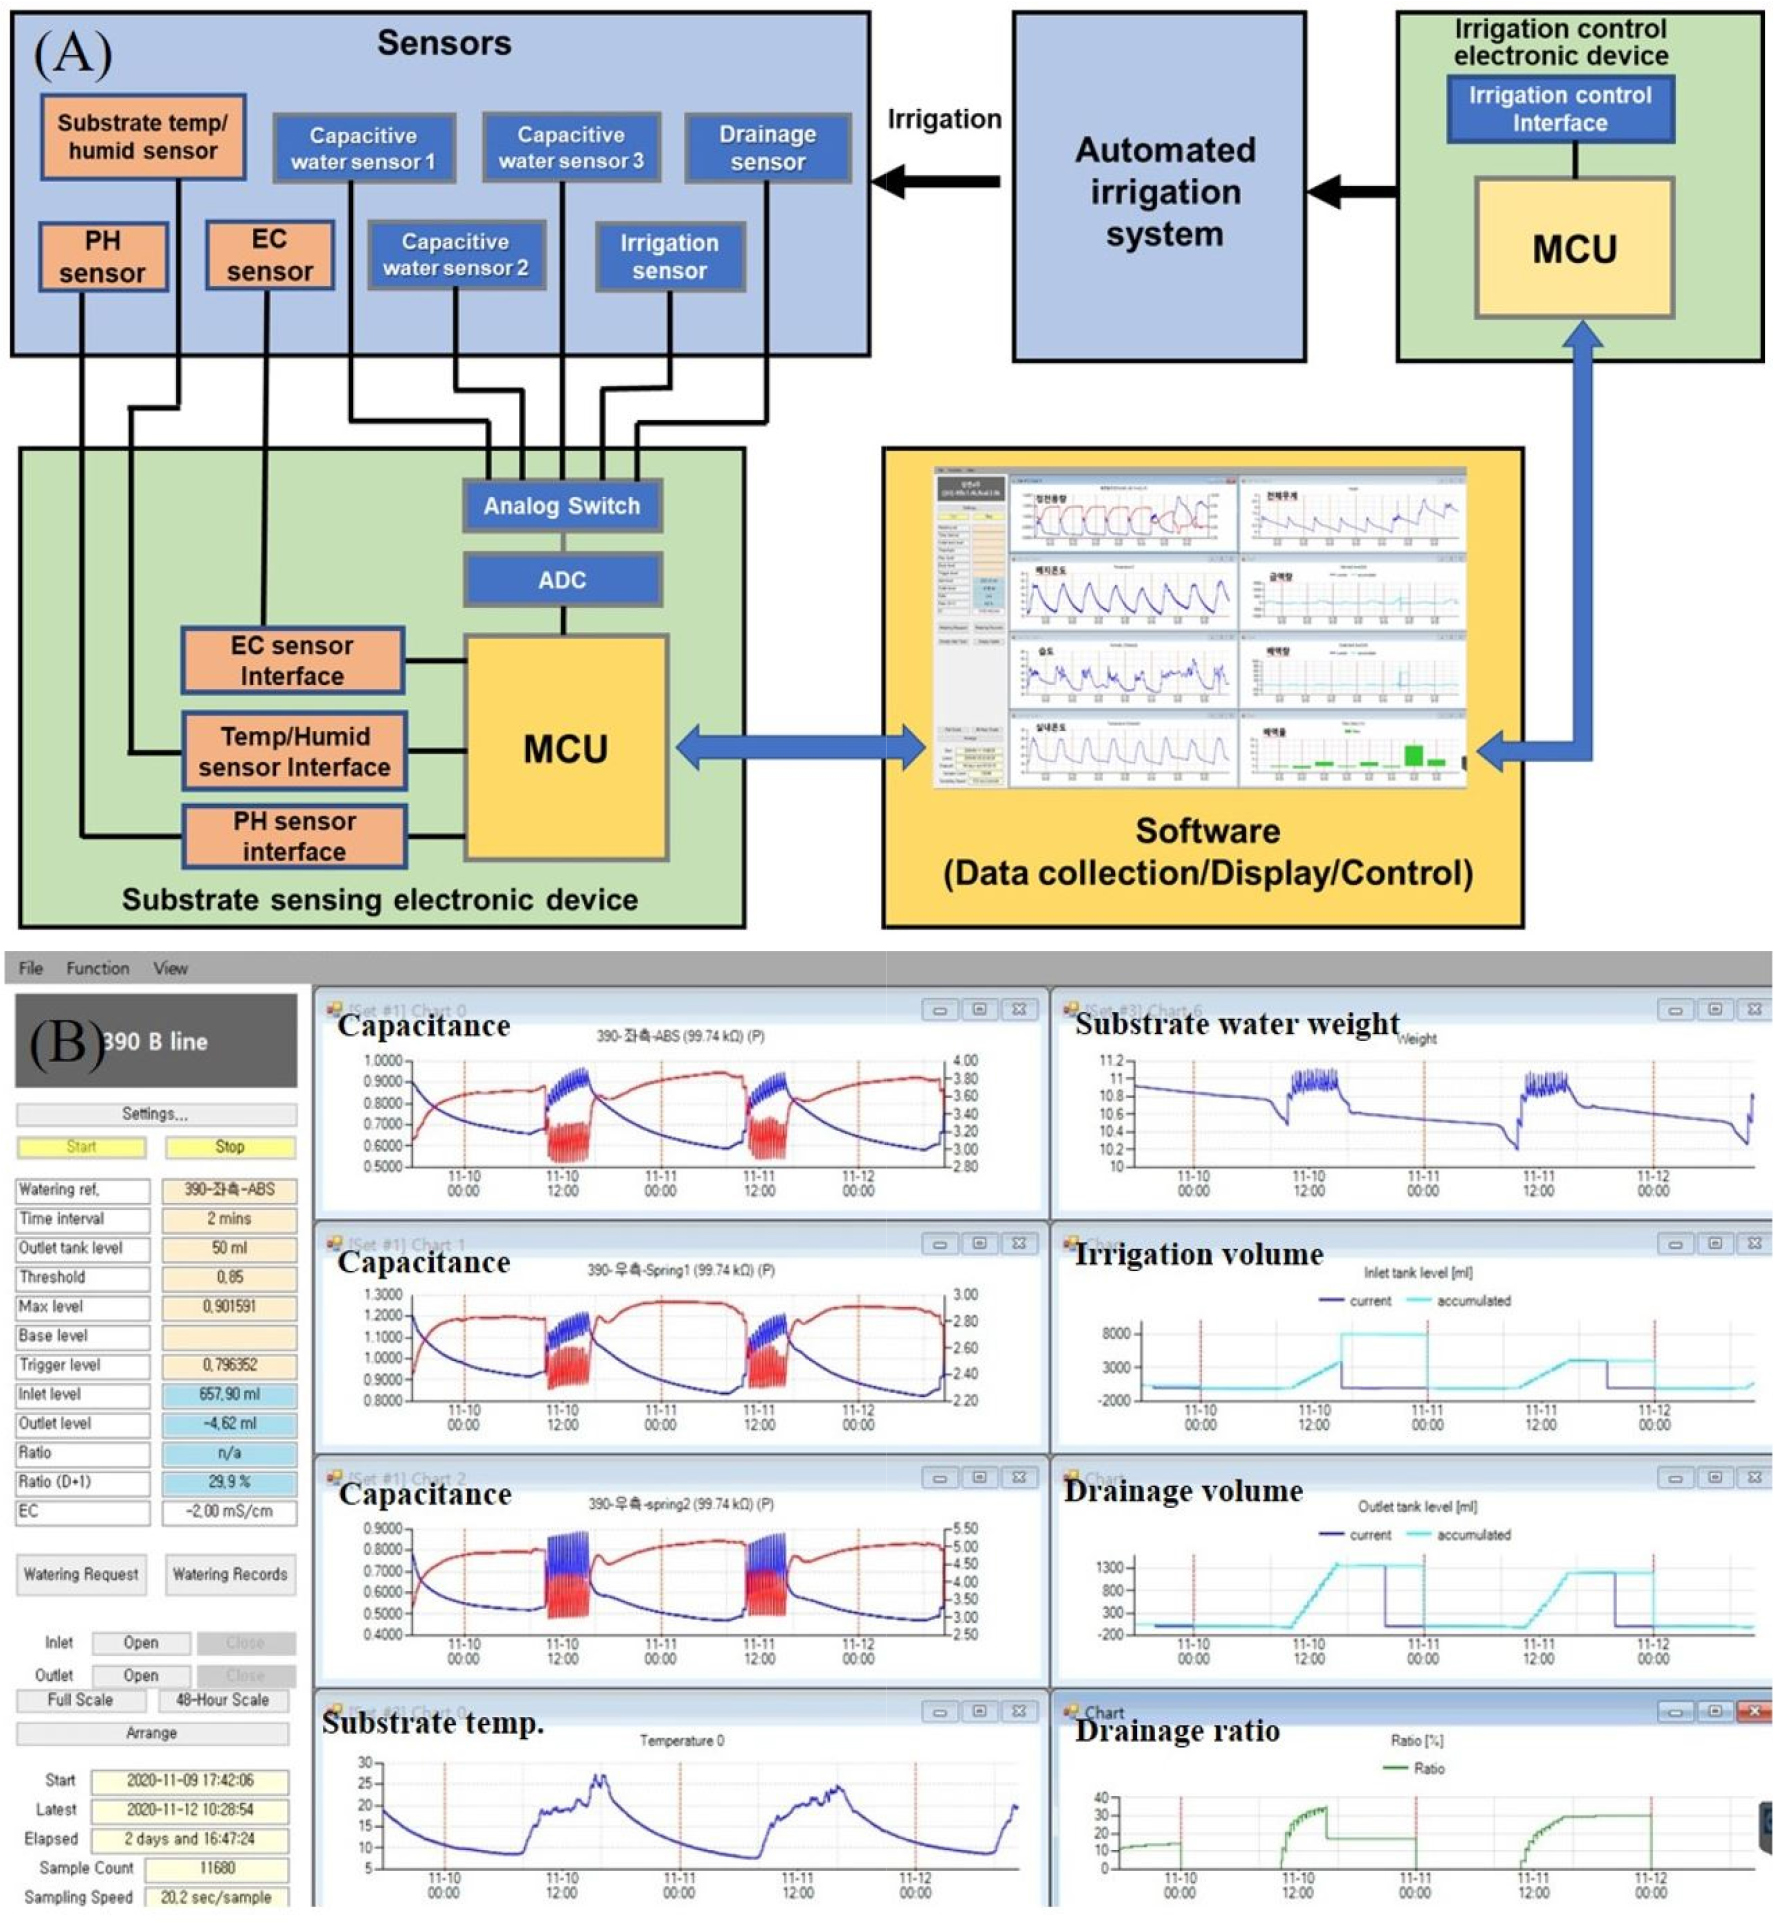
The PLL generates a sine wave alternating current, which is to be applied to the first and second electrode plates, while the amplification unit amplifies this current to a predetermined magnitude. The MUX selects an electrode sensor to measure the impedance generated from among several electrode sensors in accordance with the control of the control unit. An analog MUX was used to measure the 16-channel sensor signals using one impedance measuring unit. The impedance measuring unit applies a sine wave alternating current to the first and second electrode plates of the electrode sensor selected through MUX, and measures the impedance generated between the first and second electrode plates. If necessary, the impedance measuring unit can measure the impedance generated from multiple interconnected electrode sensors. In this case, MUX may not be used. The control unit measures the water content or its change, and the electrical conductivity or its change based on the results of the impedance measurements. The communication unit transmits the measurement results of water content and electrical conductivity to another device such as a host computer or irrigation control device, which can subsequently be used to manage the farm via transmission through a wired or wireless communication network. The control unit can measure the change in the water content of the substrate from the magnitude of the impedance generated, the resistance (R) converted from the impedance, or the change in capacitance that is the control unit can measure an increase or decrease in water content according to an increase or decrease in capacitance, or a decrease or increase in water content according to an increase or decrease in the magnitude of the impedance or the converted resistance (R).
2. Flat Condenser-Type Sensor
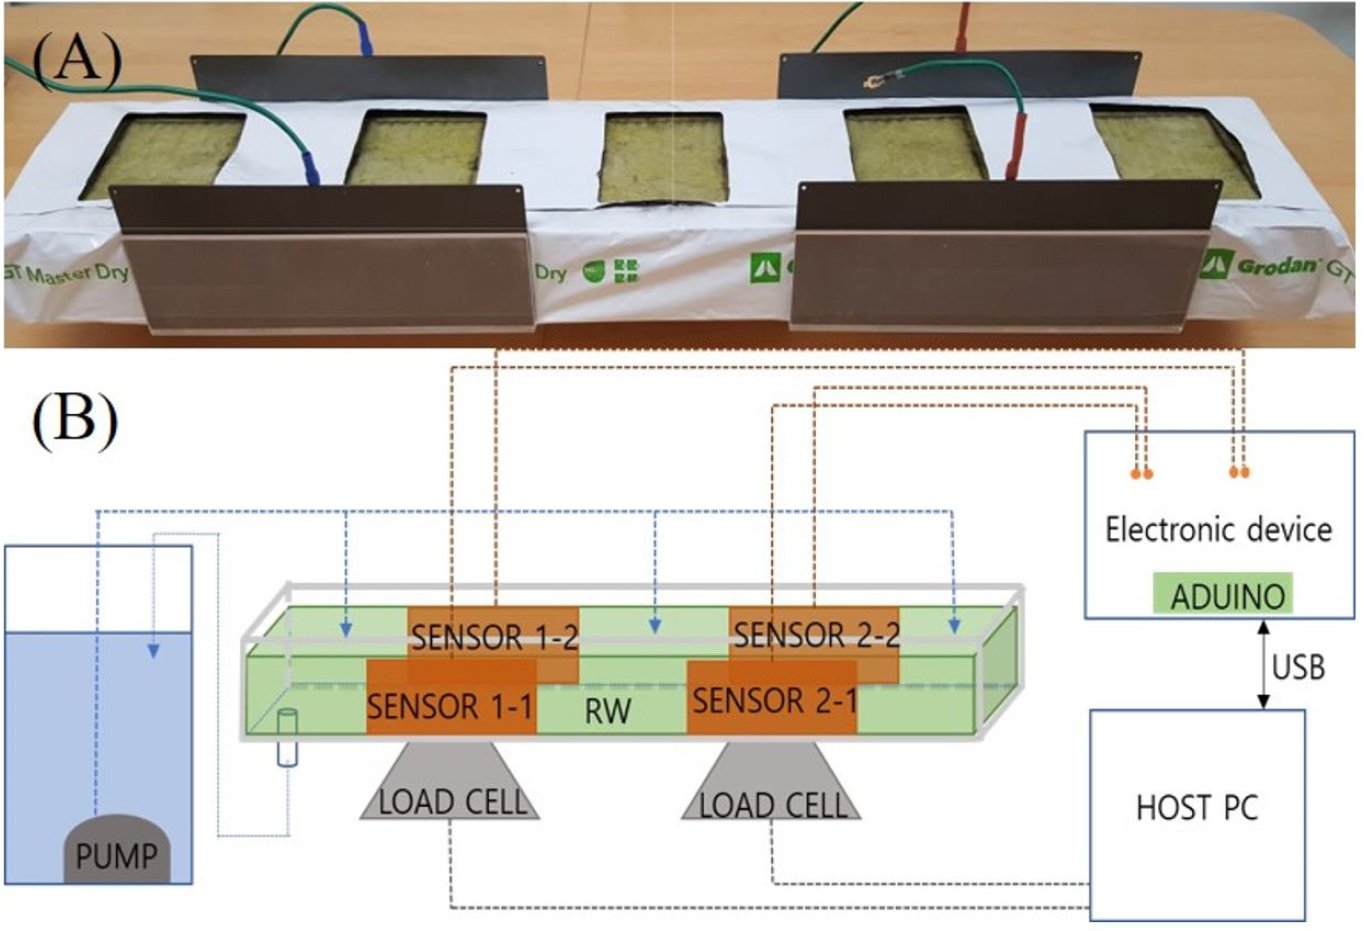
Fig. 2(A) shows two pairs of electrode sensors, including condenser-type water sensors insulated with copper and coated with Teflon (30 cm × 10 cm) adhering to the rockwool substrate (100 cm × 15 cm × 7 cm, Grotop GT Master Dry, Grodan, Roermond, Netherlands). For a pair of electrode sensor, the first electrode plate was attached to the first side (longitudinal side) of the film on the rockwool substrate and the second electrode plate to the opposite side of the substrate. Several pairs of electrode plates were installed along the longitudinal direction of the substrate. The electrode plates form a capacitor that surrounds the substrate, which acts as a dielectric material. The water content measurement device measures the impedance generated between the electrode plates by applying the sine wave alternating current to the first and second electrode plates. Based on the measured impedance, the water content of the substrate or its change was determined.
3. Arrangement of Experimental Equipment for Quantification of Water Content of Substrate
The capacitance measurement system consists of a pair of waterproof insulated electrode plates, which act as condenser- type water sensors, an electronic device that measures capacitance, and a portable computer that runs software to store and provide output of the measured data (Fig. 2B). Values of capacitance, water weight, and temperature were logged and stored in a portable computer by connecting with an electronic device using a data cable. The electronic device unit measures the capacitance according to the water content of the substrate by measuring the impedance (resistance) changes. To prevent bending due to tension from the placement of the electrode plates on both sides of the substrate, a ‘⊔’-shaped acrylic plate (5T, 100 cm × 15 cm) was used to support the electrode plate by pushing the plates toward the rockwool substrate placed in a box-shaped acrylic cultivation bed (5T, 105 cm × 25 cm × 7 cm) (A-typed sky bed, Hwasung Industrial, Korea) slightly larger than the substrate. For the same purpose as the acryl panel, three springs were placed between each of the acryl panels and the side of the cultivation bed closely contacted to the substrate. The drainage from the substrate flowed out to the outlet of the cultivation bed. A drain hole was drilled in one edge of the bed, and a drain hose was connected to the drainage container. After the drainage is collected in the drainage container, it is removed, based on a signal provided by the electronic device. The weight of the cultivation bed was measured using a load cell (TAL220 -10 kg, SparkFun Electronics, U.S.A.), and the temperature of the substrate was measured using an external 2-channel temperature sensor (RCW-600, Elitech, China). The drainage from the substrate was discharged into the drain hole in the center of the sky bed. The drainage was sent to the nutrient solution container through a tube. Thus, design and performance of the circular irrigation system was deemed complete. The electrical noise was removed by directly grounding the electronic device using a grounding rod. The resistance was measured after calibration using a software.
4. Quantification of Water Content
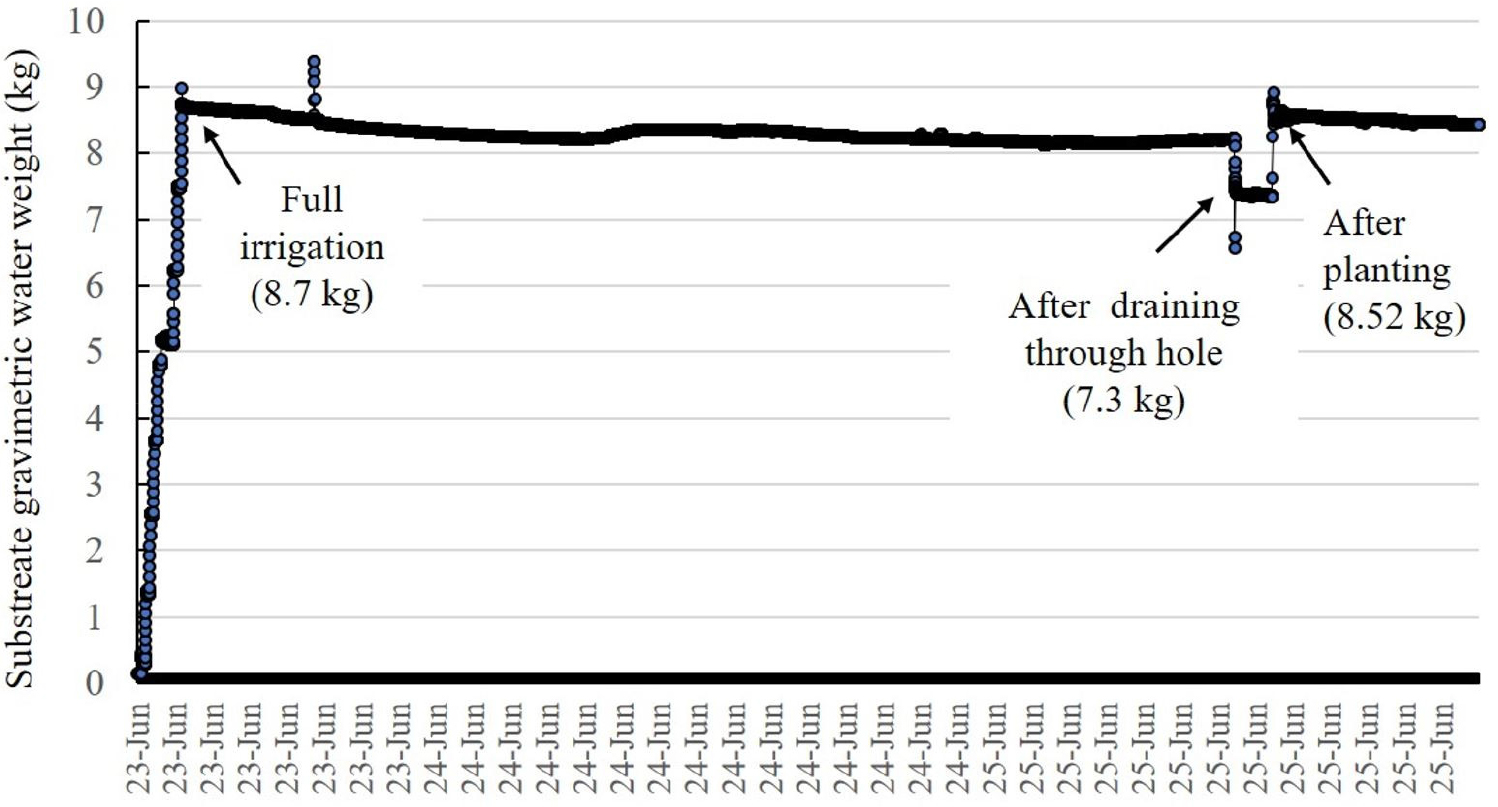
An automatic irrigation system was constructed to understand the relationship between the capacitance and water weight in substrate while providing nutrient solution to the substrate. Regarding the culture solution (1.8 dS·m-1, Yamazaki), a soft hose was connected to the submersible pump (IPS-225 [1/6HP], Hanil, Korea) and was watered with a drop pin. The irrigation and stop times were adjusted using a timer (SU-105ta2, Samwon Eng., Korea) equipped with a pressure compensation drop button. After filling the substrate with water such that the weight of water reached 7.3 kg (69% of water weight in substrate (v/v)), three bottom holes of both sides of the substrate were incised, and the length of each incision was approximately 2 cm.
The substrate water content (v/v, %) was calculated by the load cell (Park et al., 2009). Then, the relationship between the capacitance and water content was analyzed using CurveExpert Professional 2.6.5 (Hyams Development). Quantitative measurements of the change in irrigation and drainage volumes and substrate weight were used to calibrate the water content. The weight was measured in real time by interfacing load cell with a computer.
A linear function was calculated by using two variables, capacitance and water weight in substrate. The relationship between the two variables was obtained by importing the capacitance, temperature, and water content data, (the data measured by using the program), into a text file, and by selecting the linear relation. The selection of fitting data is important because irrigation data volumes repeatedly increased or decreased. Weight was measured immediately after one irrigation, whereas capacitance was measured only when the program was operated once, thereby resulting in a delay of up to 20 seconds. Additionally, the water content and capacitance continuously changed during irrigation. Accordingly, it was determined that the minimal changes in capacitance and water weight in substrate were observed in approximately 8 minutes after commencement of 2 minute of irrigation every 10 minutes.
Results and Discussion
The data acquisition unit measures the capacitance generated between the electrode plates, and converts the measurement data into substrate water content (v/v, %). When the water weight in the substrate increases, the capacitance value increased because the dielectric constant of the substrate increased. The change in capacitance according to the water weight of the substrate while irrigation was conducted, and the capacitance tended to increase as the amount of water supplied increased (Fig. 3, Table 1). By comparing the capacitance and water content of the substrate after full irrigation (8.7 kg) (Fig. 4), the water content as represented by the capacitance was calculated. Using the normalized capacitance and water weight of the substrate, an equation was obtained using the curve-fitting method.
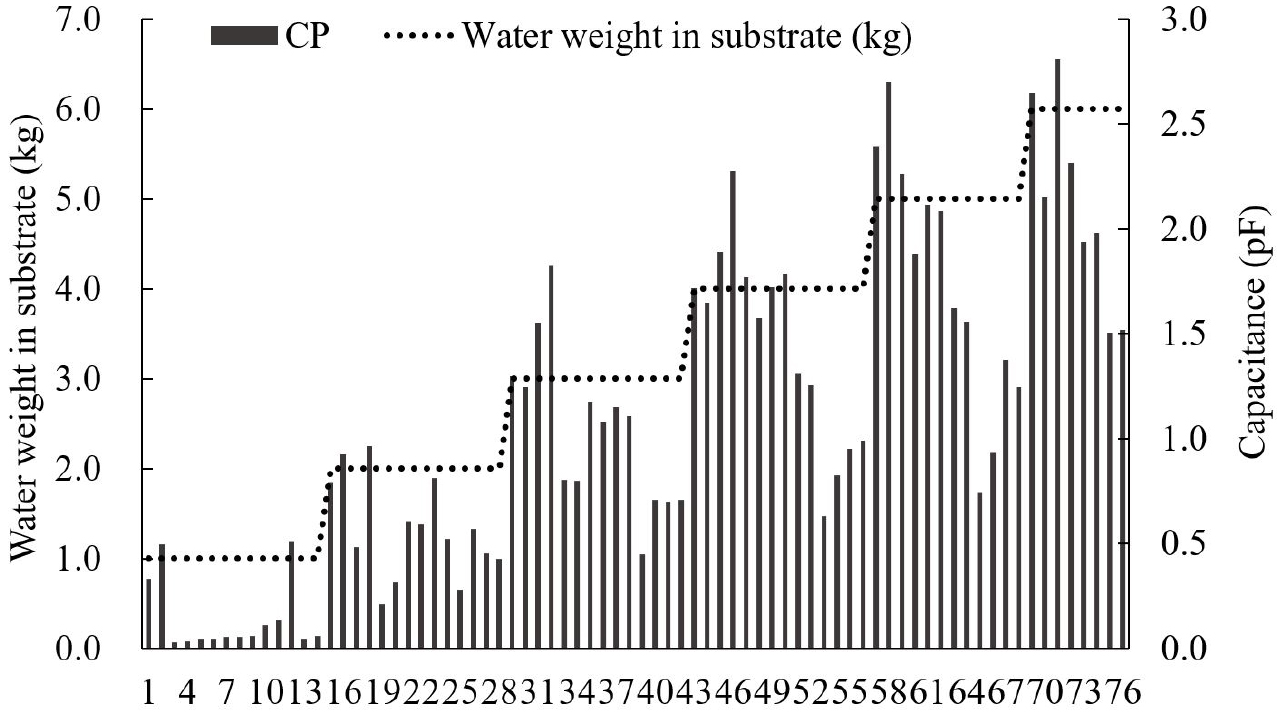
Table 1.
The standard deviation, average and coefficient of variation of capacitance according to water weight in substrate.
| Water weight in substrate (kg) | 1.0 | 2.0 | 3.0 | 4.0 | 5.0 | 6.0 |
| Standard deviation of capacitance | 0.229 | 0.307 | 0.754 | 0.470 | 0.600 | 0.476 |
| Average capacitance | 0.187z | 0.694 | 1.398 | 1.453 | 1.743 | 2.108 |
| Coefficient variation | 1.228y | 0.442 | 0.539 | 0.323 | 0.344 | 0.226 |
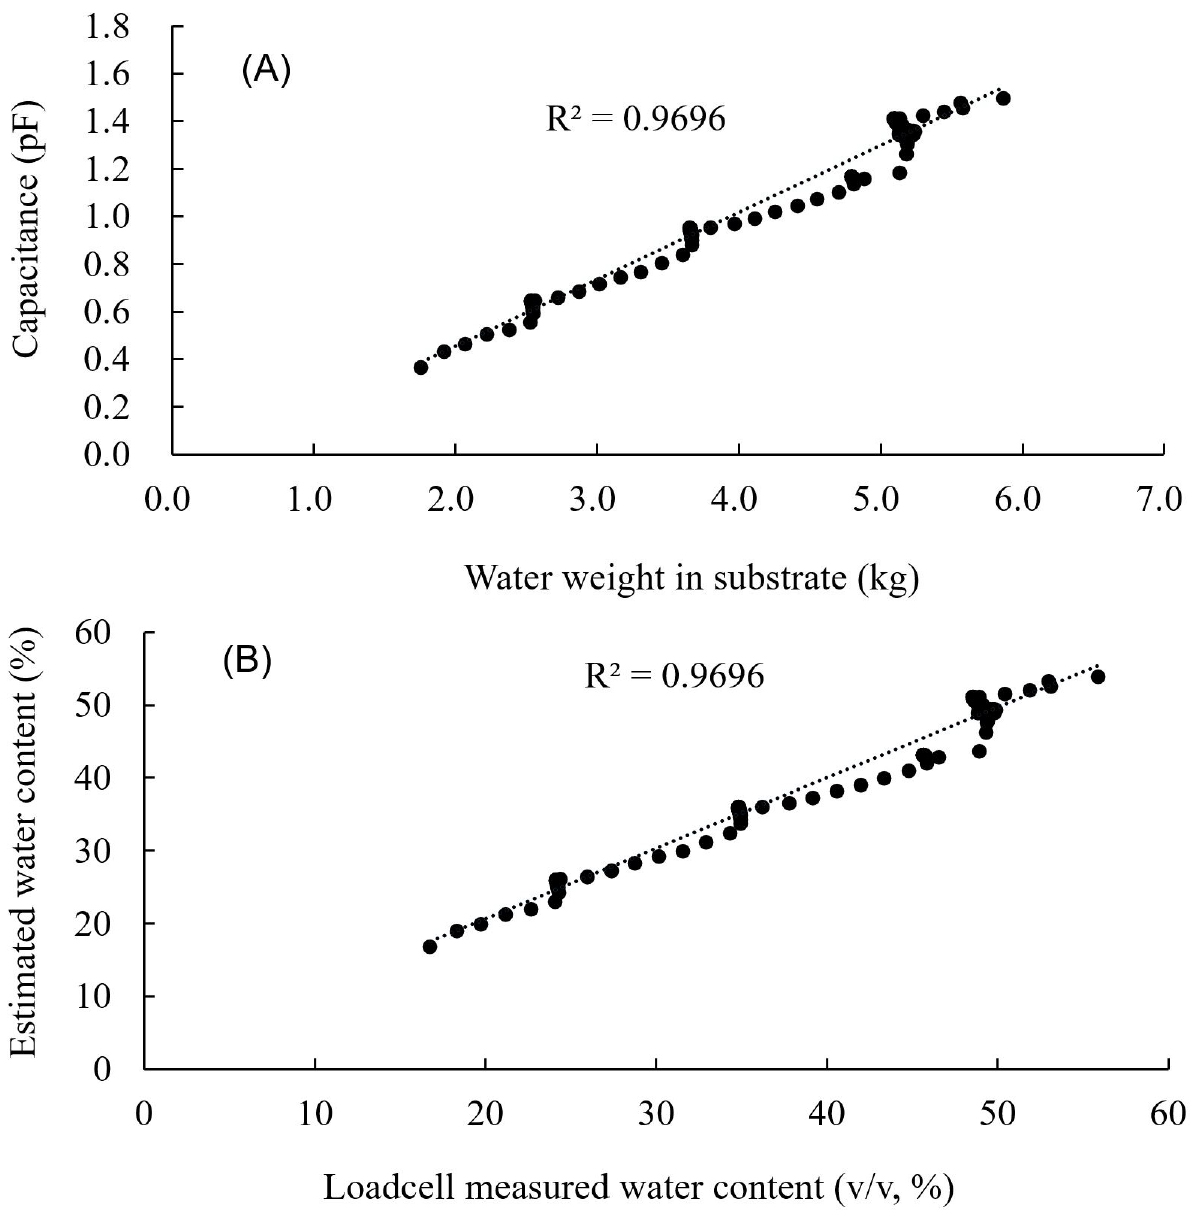
This substrate water content calibration was performed using different levels of water weight in substrate. Coefficient of variation (CV) in capacitance according to the water weight in substrate was greater with the 1.0 kg of water weight (Table 1), compared with other weights. Thus, the fitting was performed with higher than 1.0 kg, from 1.7 to 6.0 kg of water weight. The correlation coefficient between the capacitance and water weight in substrate was 0.9696 (Fig. 5). The calibration equation (Eq. (1)) estimated water content from capacitance, and it was compared with the substrate water weight measured by the load cell.
Our previous study determined the proper irrigation scheduling based on results obtained by using this flat condenser-type sensor (Han et al., 2019). In the automated irrigation system, irrigation was conducted every 10 minutes after the first irrigation was started until the first run-off occurred, and the substrate capacitance was considered to be 100%. When the capacitance threshold was reached to the target value, irrigation was re-conducted. Thereafter, when the target drainage volume was achieved, irrigation was stopped. After the experiment, it was necessary to converts capacitance into substrate water content.
In the present study, calibration equations were obtained for substrate without plants. Many previous studies have also obtained equations for development of automated irrigation system using water sensors (Burnett and van Iersel, 2008; Rhie and Kim, 2017). Calibration of the water sensor is fundamental for achieving accurate measurements (Sakaki et al., 2011). In the present study, average error obtained between the sensor reading and actual water content was 0.19% for the compensated temperature and 0.12% for the non-compensated temperature, and the maximum errors were 7.2% and 9.0%, respectively (unpublished). The results indicated that the capacitance was not significantly affected by temperature in this experiment. However, it is known that the dielectric constant of water decreases with increasing temperature (~0.4°C) (Nemali et al., 2007). Increasing the temperature of substrate from 10°C to 40°C increased the voltage output of Theta water sensor probe (which uses wave reflection, like TDR, for estimating dielectric permittivity) by 1.88 mV·°C-1, or on average 0.0022 m3·m-3 water content per °C, indicating there was no effect observed by increasing substrate temperature on the Theta probe (Nemali et al., 2007). Few studies reported that there was no change in water content measured by TDR probes with increasing temperature when the substrate water content was below 0.30 m3·m-3 (Wraith and Or, 1999; Gong et al., 2003). Additionally, when the different levels of soil moisture content such as 9.58%, 18.25%, and 27.01% were measured using FDR sensors at the temperatures of 0, 5, 10, 15, 20, 22, 25, 30, 35, 40, and 45°C, the sensor reading tended to increase with increasing temperature; however, the variation markedly depended on the level of actual soil moisture content and the type of sensor used (Chen et al., 2019). This is partially attributed the increasing temperature, which strengthens the polarization of the soil and the movement of water molecules, resulting in obtainment of a greater soil dielectric constant. Based on findings reported in the existing literatures, we postulate that the effect of substrate temperature on the dielectric constant may differ depending on the sensor and substrate type used.
Also, the resistance (R)-capacitance (C) product is a constant independent of the geometry as shown in the equation: R·C = ε/σ, where ε (Farad/m) and σ (Siemen/m) are dielectric constant and electrical conductivity (EC) (Zahn, 1979). Therefore, the capacitance of the substrate is proportional to the dielectric constant, and the resistance of the medium is inversely proportional to EC. All of the experiments conducted in the present study used nutrient solution in the EC concentration at 1.8 dS·m-1. Since the pilot experiment measured changes in capacitance increase by the EC, we plan to conduct an experiment to determine the relationship.
When the substrate is made of components in a hexahedronal form, such as rockwool, capacitance can be measured in the following two ways. When a capacitive sensor is installed above and below the substrate, even the water present at the bottom of the substrate can be accurately measured, but it can be difficult to quantify the water content, because of the considerable change in capacitance, depending on the location of water. Based on the results obtained of several experiments, we concluded that, in the case of rockwool, the method of attachment of a fixed capacitance sensor to the front and back of the substrate was appreciable.
When a wire is connected between the sensor device body (electromagnetic source) and the sensor (for generation and detection of electromagnetic waves), the movement of the electromagnetic wave assumes the form of a wavelength owing to the change in impedance (resistance), and when the sensor is placed in the soil (water), the speed of movement of the electromagnetic waves is slow due to the dipolarity of water. The time taken by the electromagnetic wave to travel back and forth between the sensors (detection rods) is related to the soil water content. Accordingly, the intensity of the reflected wave is read as capacitance, in accordance with the degree of permittivity in the soil, and is thus converted into soil water content. Both the flat condenser-type sensor and FDR sensor function in a similar manner; however, the FDR sensor is manufactured in the form of a rod, and thus measures only one localized point of the substrate. This capacitive water sensor can measure the water content of the substrate area, which includes approximately 70% of the entire substrate. In the case of the coir substrate, the pores are larger than that of rockwool, and the particles in the substrate are not denser than those in rockwool. It has been reported that there exists a difference of approximately 46% between the sensor display value and the actual water content (Shin et al., 2015). As the coir has large and coarse particles compared to those in rockwool, the weight and density of the substrate are relatively high. The physical properties vary depending on the content of the chip or fiber. Accordingly, it is important to explore and develop a suitable sensor for installation and measurement (Park et al., 2014). A weight-based sensor can be accurately measure irrigated water weight; however, external interferences, such as wind or removal of fruits and leaves for cultivation, affect the functionality of the sensor. The sensor developed in the present study can be used to measure the substrate water content in real time, and irrigation and drainage can be controlled by controlling the maximum water content of the substrate, thereby preventing the waste of nutrient solutions or excessive drainage.
