

Introduction
Materials and Methods
1. Experimental treatment
2. Nutrient uptake rate
3. Measurements of plant growth
4. Statistics
Results and Discussion
1. The changes of pH and EC
2. Mineral concentrations of solutions
3. Mineral concentrations of leaf tissues
4. Nutrient uptake rate
5. Plant growth and yield characteristics
Introduction
Future forecasts for climate change predict the global mean surface air temperature rise, and world’s population continues to grow increasing food demand. The increased atmospheric temperature and population are particularly important concerns for agricultural, horticultural and native plant production. Large amounts of fertilizer and pesticides have been used to maximize productivity per unit area. Environmentally friendly agricultural technology is needed while meeting growing food demand and ensuring freshness and safety of food (Ivanovich et al., 2023).
Aquaponics provides nutrients in fish tanks that are needed for plant cultivation, and thus it is a nutritional circulation system similar to the natural ecosystem (Francis et al., 2003). There is a survey report that the reasons for choosing aquaponics are for the production of healthy food, a sustainable environment, and educational utilization. In addition, basil, tomatoes, and leaf vegetables for salads were mainly selected for growing in aquaponics (Love et al., 2014).
As the interest of consumers in healthy and natural food has increased, the consumption for strawberry (Fragaria×ananassa) is increasing (BRI, 2024). In Korea, strawberry seedling is transplanted in September and harvested in December; however, ever-bearing strawberry varieties can be produced annually. Among the ever-bearing strawberry varieties, ‘Guanha’ has been developed as one of ornamental plants, and is continuously blooming pink flower under high temperature and long-day conditions. Because of its characteristics, the ‘Guanha’ variety is suitable for indoor landscaping plants (Lee et al., 2012), and therefore may be appropriate for aquaponics as urban farming at home and school as well as at plant factories, of which productivity is better than greenhouse cultivation in terms of resource use such as water and area (Graamans et al., 2018).
Since nutrients in the aquaponic system are only supplied as feed to increase fish weight, they may not meet the nutrients demanded for plant growth (Bittsanszky et al., 2016). However, it has been reported that it is possible to derive consistently economical production depending on the fish species, fish density, and cultivation method (Goddek et al., 2015; Pineda-Pineda, 2017; Tyson et al., 2008). Little information in available to compare nutrient uptake rate by crops between the aquaponic and hydroponic systems, although there have been comparative studies between the two systems (Delaide et al., 2017; Yang and Kim, 2020). This study therefore aimed to compare the nutrient uptake rate, growth and yield of strawberry grown under the aquaponic and hydroponic systems in a plant factory.
Materials and Methods
This experiment was conducted from March to August 2023 in a walk-in chamber, where the temperature and relative humidity are controlled at the 21±0.5°C and 60±5%, respectively. The each of 30 seedlings of strawberry (Fragaria×ananassa Duch. cv. Guanha) were planted in the bed (W 0.7 m × L 1.5 m × H 0.22 m) at the top of the aquaponics system as well as the bed of hydroponic system (W 0.7 m × L 1.5 m × H 0.22 m). The crown diameter was 7.84±0.9 mm, and length of petiole was 18.0±2.5 cm. The length and width were 4.8±0.5 cm and 4.2±0.4 cm, respectively, and leaf number was 4.50±1.54. After transplanting, the dead lower leaves, runner were removed. The intensity of white LED was 200 μmol·m-2·s-1 and the photoperiod of day/night was 12/12 hour. Oxygen was supplied using the air pump (LP-60A, Kosung Valve Co., Ltd., Korea) for 24 hours, and was maintained at 9 to 12 mg·L-1 during the entire growing period. Aquaponic solution was refilled with tap water received for more than 24 hours after measuring reduced water volume five times a week, and an external filter (Oase Filtosmart 300, Oase GmbH, Hörstel, Germany) was washed off once a week. The solution at the bottom of the aquaponics system was circulated to the plant bed using an underwater motor (GSP-100G, Gmpump Co., Ltd., Korea) whose water level was controlled by a ball top in a sump tank (Sump Tank) (Fig. 1). The 12 Fish (Cyprinus carpio cv. Koi) highly resistant to water quality changes (i.e. water temperature, pH) were grown with 367.5 L water in a tank (W 0.7 m × L 1.5 m × H 0.45 m, 472.5 L) at a density of 5.44 kg·m-3. Fish feed (Premium 1C, Woosung Inc., Seoul, Korea) was supplied about 1% of fish weight 3 times a day. The feed ingredients consisted of less than 8.8% of water, 47.21% of crude protein, 6.82% of crude fat, 1.21% of crude fiber, 10.93% of crude ash, 2.62% of calcium (Ca), 1.91% of phosphorus (P), 0.22% of magnesium (Mg), 0.08% of potassium (K), 0.04% of iron (Fe), more than 64% of mixing ratio of animal protein (fish meal, fish juice adsorption feed), more than 20% of vegetable proteins (soybean meal, corn gluten), less than 10% of grains (soy white flour), auxiliary feed (vitamins C and E), less than 5% of choline (chloride, emulsifier), and more than 1.0% of oils (fish oil).

1. Experimental treatment
The each of 30 seedlings of strawberry ‘Guanha’ were planted in the bed (W 0.7 m × L 1.5 m × H 0.22 m) at the top of the aquaponics system as well as the bed of hydroponic system (W 0.7 m × L 1.5 m × H 0.22 m). The 30 seedlings of strawberry were planted in pots filled with perlite substrate and then were placed on the bed (W 0.7 m × L 1.5 m × H 0.22 m) at the top of the aquaponics system. The other 30 seedlings were planted in net-pots and then placed on the holes of acrylic plates (140 cm × 60 cm, Ø80 mm) on the bed of hydroponic system (W 0.7 m × L 1.5 m × H 0.22 m). The Mulpure No. 1 (Dae-yu, Seoul, Korea) solution diluted 400 times was supplied for the hydroponic system. The pH of the nutrient solution supplied was 6.0, and the EC was 1.2 dS·m-1. Strawberry were cultivated after the EC concentration of aquaponic solution was reached to 0.3 dS·m-1, and the water temperature was remained in the range of 22.8°C and 19.2°C.
2. Nutrient uptake rate
Mineral concentrations of plant and aquaponic solution were analyzed, and the nutrient uptake rate was calculated as the following formula; uptake rate . Where m1 and m0 are the total content of each mineral in leaf and root tissues and DW r1 and DW r0 are the root dry weights at day t1 and t0, respectively.
3. Measurements of plant growth
Leaf number, crown diameter, length and width of the largest leaf were measured at the 42, 49, 56, 63, 70, and 77 days after transplanting, and the fresh and dry weights of shoot and root and leaf area were measured at the 59 and 81 days after transplanting. The leaf area was measured using a leaf area meter (LI-3100 area meter, LI-COR Inc., USA). After harvesting, the fresh weight was divided into the ground part and the underground part and measured with an electronic scale (HS410A, Yousheng, Shanghai, China). The dry weight was measured dried at 65°C of dryer (HB-504F-0, Hanbaek Science Inc., Buchon, Korea) for 72 hours.
4. Statistics
The average value of 3 replications for mineral contents and growth characteristics, 30 replications for fruit numbers per plant, and 137 replications of individual fresh and dry weights of fruit and length and width of fruits were verified using the SAS (Statistical Analysis System, V9.4, Cry, NC, USA) program.
Results and Discussion
1. The changes of pH and EC
The pH and EC of the aquaponic solution was ranged from 4.3 to 6.9 and 0.32 to 1.14 dS·m-1, respectively, while those of hydroponics were ranged from 5.1 to 7.5 and 1.0-1.8 dS·m-1, respectively (Fig. 2). The pH of aquaponic solution was declined to bellower than 5.0 after the 40 DAT, and then was higher than 5.0 after 52 DAT (Fig. 2). In general, the pH drop in aquaponics is due to the accumulation of H+ ions in the process of nitrification, in which organic nitrogen in fish wastes is converted into nitrite (NO3-N) by nitrifying bacteria and the accumulation of CO2 (Schreier et al., 2010). In aquaponics, pH 7.5-9.0 is appropriate for nitrification bacterial activity, and the nitrification process of organic nitrogen proceeds at pH 6.0-8.5 (Hochheimer and Wheaton, 1998). In the present study, the pH of aquaponic solution was decreased to lower than pH 6.0; however, nitrification seems to have progressed. The T-N content in the leaf was 2.58%, which is lower than the appropriate level of 3.0 to 4.0% (Table 4). The appropriate pH of the strawberry is in the range of 6.0 to 6.5 (RDA, 2019), and in the present study, the pH of hydroponic solution was at an average pH of 6.39. It was reported that when the EC concentration of the Yamazaki solution (NO3 5.0, NH4, 0.5, H2PO4, 1.5, K 3.0, Ca 2.0, Mg 1.0 me·L-1) was controlled at the 2/3S (0.5 dS·m-1), S (0.75 dS·m-1), 4/3S (1.0 dS·m-1), 5/3S (1.25 dS·m-1) for growing an ever-bearing strawberry variety, ‘Pechika’ in the highland summer cultivation, the fresh and dry weights and root activity was greater in the plants grown under the S (0.75 dS·m-1) (Lee et al., 2006). Rakocy et al. (2006) also suggested that the proper EC in aquaponics was 0.3-0.6 dS·m-1.

2. Mineral concentrations of solutions
The NO3-N and NH4-N of the aquaponic solution were higher about 3.6 and 2.2 me·L-1 than that of the standard strawberry solution (Table 1). The P, Ca, Mg, and S ions in the aquaponic solution were higher about 0.76, 3.1, 0.8, and 0.9 me·L-1 than those of standard hydroponic solution, respectively, while the K and Fe were 0.8 me·L-1 and 0.5 mg·L-1 lower, respectively (Table 1). These results indicate that although the EC of the aquaponic solution was ranged from 0.32 to 1.14 dS·m-1, the mineral nutrients in the solution were higher than the standard hydroponic solution. It is associated with the sludge (solid particles) in the aquaponic solution. Our previous study revealed that the sludge had sufficient properties as fertilizer. The organic content (OM), N, phosphorus (P), and potassium (K) of the sludge were 61.5, 5.72, 8.92, and 0.24%, respectively. (Choi et al., 2023).
Table 1.
Mineral concentrations in the solution of the aquaponic and hydroponic systems measured at the 98 days after transplant.
| Component | Macroelements (me·L-1) | Microelements (mg·L-1) | ||||||||
| NO3 | NH4 | K | P | Ca | Mg | S | Fe | B | ||
| Aquaponics | 8.6z | 2.77 | 1.4 | 2.26 | 5.1 | 1.8 | 1.9 | 0.14 | 0.73 | |
| Hydroponics | 7.5 | 0.7 | 2.2 | 0.52 | 5.8 | 1.5 | 2.0 | 0.65 | 0.31 | |
| Referencey | 5.0 | 0.50 | 3.0 | 1.50 | 2.0 | 1.0 | 1.0 | 3.00 | 0.50 | |
yNutrient solution for strawberry referred from Lee et al. (2015).
3. Mineral concentrations of leaf tissues
The mineral contents of the strawberry leaves grown on aquaponics did not differ from that of hydroponics, and K, which was low in the aquaponic solution, showed an appropriate range (Table 2). These results seem to be related to the fact that sludge has high fertilizer components. Blanchard et al. (2020) mentioned that the aquaponic solution and solid particles continuously interacted within the growing medium (100% pearlite) to become appropriate nutrients for plants. The authors found that the sludge was continuously ionized in the artificial medium in the root-zone and became an additional nutrient for the plant, and a large amount of sludge and the pH buffering of soluble organic matter (pH-buffering functional groups) were related to denitrification. It is said that sludge increases the supply of P and K in aquaponics (Monsees et al., 2017). Bacteria need surfaces such as gravel, hard stones, and plastic (Thorarinsdottir, 2015). The growing medium and filters provide bacterial habitats that convert fish wastes (Somerville et al., 2014). Aquaponics systems using media provide more surface area to microorganisms than NFT methods or floating craft methods, and thus are more efficient in terms of utilizing nitrogen (Lennard and Leonard, 2006). In addition, Shukla et al. (2008) suggested that in aquaponics, magnesium can be supplied in the form of magnesium oxide (MgO) in fish feed, which can be supplied as plant nutrients from the remaining feed without eating as well as sludge. Although the Fe concentration in the solution was very low (Table 1), it seems that Fe containing 0.04% in the fish feed was solubilized as plant nutrients, as plant had no Fe deficient symptom.
Table 2.
Mineral contents of strawberry leaves grown in the aquaponic system and hydroponic system at the 58 days after transplant (28th of April, 2023) and the 98 days after transplant (7th of June, 2023).
| Treatments | Macroelements (%) | ||||
| N | P | K | Ca | Mg | |
| Aquaponics | 2.58 | 1.56 | 2.77 | 1.27 | 0.64 |
| Hydroponics | 2.14 | 1.00 | 2.44 | 1.64*z | 0.62 |
| Referencey | 3.0-4.0 | 0.2-0.4 | 1.1-2.5 | 0.5-1.5 | 0.25-0.45 |
4. Nutrient uptake rate
When nutrient uptake rates of T-N, P, and K were calculated between the 58 and 98 days after transplant (DAT), it was much higher in K than T-N and P for the both systems. The uptake rates of T-N and P were 1.5 and 1.9-fold higher in the aquaponics than those under hydroponics, respectively, and there was no significant difference in the K uptake rate (Fig. 3).

5. Plant growth and yield characteristics
The leaf number and crown diameter measured on the 45 DAT were significantly higher in the aquaponics than those of hydroponics (Table 3). The leaf number was about 3 more, and crown diameter was about 3 mm thicker. The petiole length was about 1.58 cm long in aquaponics. The crown diameter, plant height, and leaf length and width in the 98 DAT were significantly higher in aquaponics (Table 3). This result is associated with the fact that the T-N and P uptake rates were higher in the aquaponics than that of hydroponics (Fig. 3). There was no significant difference in the leaf number between two treatments measured on the 98 DAT (Fig. 4), and this result is due to the removal (pruning) of lower leaves. Three leaves of strawberry are attached to the tip of the petal as a multiple leaf. Leaves are an important organ for photosynthesis, growth and quality of crops (Marcelis et al., 2004); however, higher number of leaves reduce the solar irradiance, resulting in delays in fruiting (Lester and Bruton, 1986). Therefore, in the present study, leaf pruning was conducted for removal of aged leaves in order to improve the solar irradiance. The number of fruits per plant was significantly higher in aquaponics than those in hydroponics, and the fresh and dry weights of fruits and length and width of fruit were significantly higher in hydroponics. The total soluble solid content was higher about 2.0°Brix in the fruits harvested from hydroponics (Table 4). Lee et al. (2014) studied the effect of fruiting number on the quantity, fruit quality, and plant growth of ‘Sulhyang’ strawberries. When the number of fruits was adjusted to 20, 25, and 30, the sugar content increased as the fruiting number was reduced. The results suggest that plants in aquaponics continuously utilize fertilizer components of solid particles from fish and feed wastes.
Table 3.
Growth characteristics of strawberry grown under the aquaponic and hydroponic systems measured at the 58 and 98 days after transplant.
| Treatment |
Crown diameter (mm) |
No. of leaves (ea.) |
Plant length (cm) |
Leaf length (cm) |
Leaf width (cm) |
Petiole length (cm) |
| April 28th, 2023 (58 DAT) | ||||||
| Aquaponics | 13.56*z | 8.29*** | 16.45 | 5.44 | 5.29 | 8.76* |
| Hydroponics | 10.83 | 4.96 | 15.30 | 5.80 | 5.51 | 7.18 |
| June 7th, 2023 (98 DAT) | ||||||
| Aquaponics | 13.00* | 5.09 | 14.63* | 7.12** | 6.87** | 5.61 |
| Hydroponics | 10.94 | 4.79 | 12.11 | 5.49 | 5.41 | 5.30 |
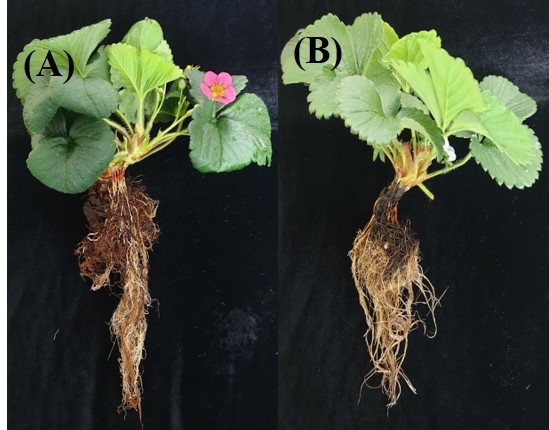
Table 4.
Yield characteristics of strawberry grown under the aquaponic and hydroponic systems measured from 27th of March to 8th of May.
| Treatment |
No. of fruits per plant |
Fruit fresh weight (g) |
Fruit dry weight (g) |
Fruit length (cm) |
Fruit width (cm) |
Total soluble sugar (°Brix) |
| Individual fruit (n=137) | ||||||
| Aquaponics | 8.86*z | 5.49 | 0.45 | 2.85 | 2.45 | 6.73 |
| Hydroponics | 4.10 | 7.74* | 0.78* | 3.11* | 2.80* | 8.60* |
