

Introduction
Materials and Methods
1. Experimental greenhouse and air circulation system
2. Fan outlet-velocity measurement
3. Environmental data measurement
Results and Discussion
1. Performance analysis of greenhouse circulation fans
2. Analysis of the internal greenhouse environment (air temperature, RH, airflow)
3. Analysis of the effect of circulation fans on the greenhouse internal environment
Conclusion
Introduction
Vertical farming systems have gained increasing attention as an effective solution for high-density crop production under controlled environments, particularly in urban areas where land availability is limited. By stacking plant media vertically, this method significantly improves land-use efficiency and enables year-round crop production. However, the vertically multilayered configuration introduces problems in maintaining a spatially uniform microclimate, especially with respect to airflow, air temperature, and relative humidity (RH) within the cultivation space (Majdoubi et al. 2009; Sohn et al. 2023; Sarailoo et al. 2025).
In a multi-layer cultivation system, the densely arranged racks and crop canopies obstruct airflow pathways, increasing flow resistance and creating spatial heterogeneity (Mohd Noh et al. 2021; Zhang and Kacira 2022). Insufficient air circulation can lead to the formation of stagnant boundary layers around the leaves, reducing transpiration and convective heat transfer. As a result, localized heat and moisture accumulation may occur (Moon et al. 2014; Sohn et al. 2023). Such microclimate non- uniformity has been repeatedly reported as a limiting factor for stable crop production in vertical farming systems.
Lettuce (Lactuca sativa), a widely cultivated crop in vertical farms, is particularly sensitive to microclimate conditions within its canopy. Previous studies have shown that inadequate airflow near inner leaves restricts transpiration and calcium transport, increasing the risk of physiological disorders such as tip burn (Zhang et al. 2016). In addition, experimental evidence indicates that airflow management can influence lettuce growth and the occurrence of tip burn, highlighting the importance of reducing spatial heterogeneity in multi-layer farming systems (Moon et al. 2014; Ahmed et al. 2020; Lee et al. 2023).
To lessen microclimate heterogeneity, circulation fans and ventilation configurations are commonly employed in vertical farming greenhouses. Moon et al. (2014) showed that the optimized use of air flow fans and cooling/heating devices can reduce vertical temperature by 78.9% in a vertical multi-layer plant factory (3.47 m × 4.350 m × 2.970 m). However, their study focused primarily on temperature and air distribution and did not account for the possible effect of fan-to-fan performance variability. Lim and Kim (2014) further showed that the airflow distribution is highly sensitive to the inlet-outlet configuration. However, their study relied largely on numerical simulation and simplified geometric structures, which limit its direct applicability to commercial multi-layer systems.
More recent studies have used numerical simulation to assess airflow uniformity in enclosed vertical farming environments (Bournet and Boulard 2010; Moon et al. 2014; Lee et al. 2023). While these studies provided valuable insight into airflow patterns and ventilation efficiency, they were primarily simulation-based and relied on assumed boundary conditions, underscoring the need for experimental datasets from the actual structure. Moreover, few studies have quantitatively examined the fan outlet velocity imbalance, airflow continuity within the circulation loops, or the combined effects of fan operation and window opening under real operating conditions in a commercial multi-layer vertical farming greenhouse.
Despite growing research activity on quantifying greenhouse temperature and RH non-uniformity, few have examined contributing factors such as fan outlet performance, fan on-off configurations, and localized greenhouse air speed. In particular, there is limited field-based data that describes how fan performance variability and spatial airflow coverage are associated with microclimate non- uniformity in commercial-scale multi-layer vertical farming greenhouse systems.
Therefore, the objective of this study was to experimentally analyze the performance of the circulation fan and the spatial variability of the microclimate in a commercial multi-layer vertical farming greenhouse. Field experiments on fan outlet air velocity, greenhouse air velocity, air temperature, RH, and the effect of fan operation were conducted to characterize the observed spatial variability and provide experimental data for future control improvements.
Materials and Methods
1. Experimental greenhouse and air circulation system
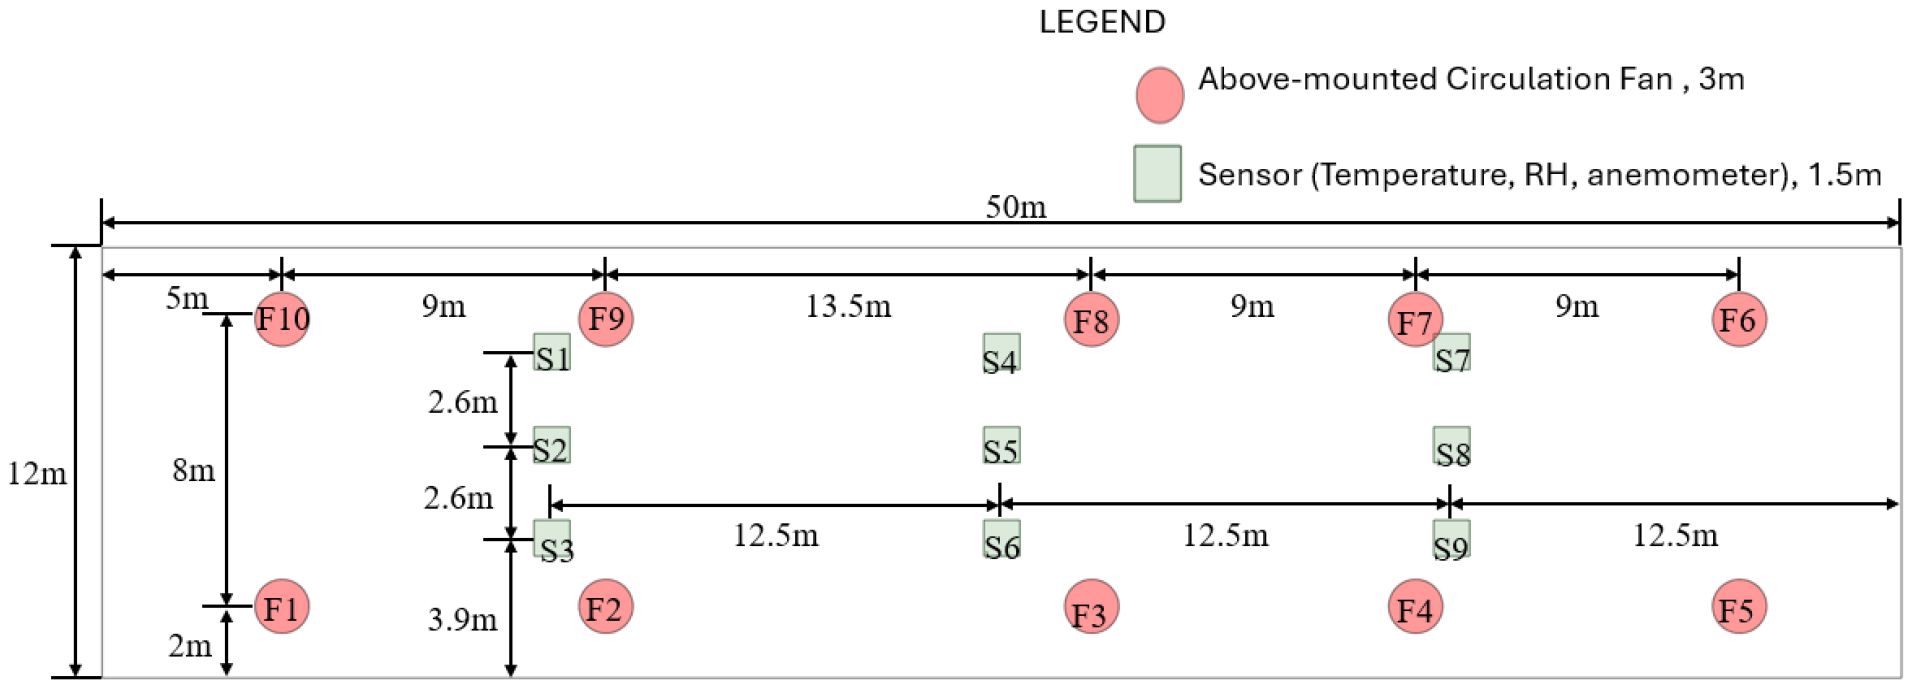
Field experiments were conducted in a commercial vertical farming greenhouse operated by KF Agricultural Development, located in Changwon, Gyeongsangnam Province, South Korea (35°19′16″ N, 128°36′22″ E, altitude 37.1 m). The facility is a European-style rooftop-installed greenhouse with a total cultivation area of approximately 600 m2 (50 m × 12 m), a wall height of 5 m, and a ridge height of 6 m (Fig. 1). The structure is composed of glass walls and roof panels and is equipped with environmental control systems designed for year-round operation.
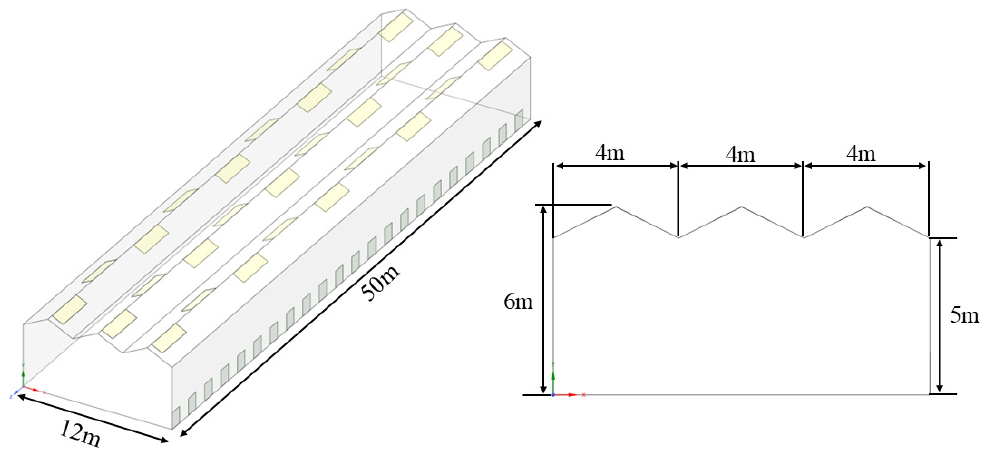
Natural ventilation is facilitated by side windows (approximately 1.05 m × 1.35 m) installed along one lateral wall and by ridge skylights at the roof apex (approximately 3.38 m × 1.00 m). The side window serves as a primary air inlet, while the skylights act as passive exhaust outlets, allowing buoyancy-driven air exchange.
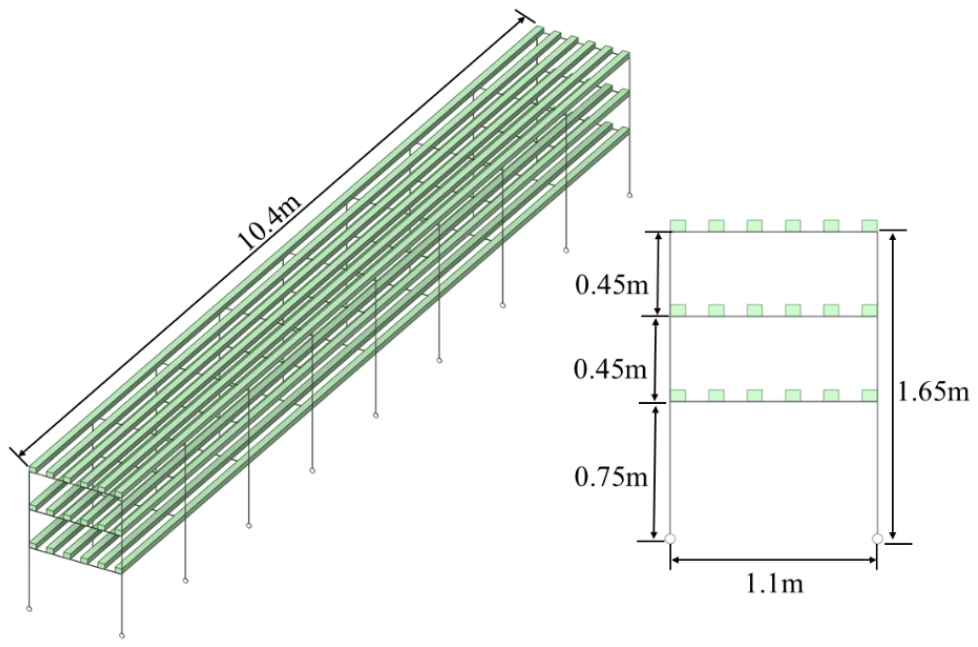
The cultivation system consists of multi-layer vertical racks, each comprising three cultivation layers. The heights of the cultivation layers from the floor are approximately 0.75 m (bottom layer), 1.20 m (middle layer), and 1.65 m (top layer), resulting in an inter-layer spacing of approximately 0.45 m. Its total length is approximately 10.4 m, and the width is approximately 1.1 m (Fig. 2). Crops are cultivated using nutrient film techniques in hydroponic trays. Each layer has six gutters, each section of which primarily cultivates 50 crops. Each rack also features wheels for convenient movement. In total, there are 34 multi-layer vertical racks in the greenhouse.
The greenhouse is primarily dedicated to the cultivation of lettuce (Lactuca sativa), including Butterhead, Romaine, Caipira, Cristabel, Ezabel, Rhone, Cherry Crunch, and Little Gem varieties, which are widely grown in Korean vertical farming due to their short growth cycles and consistent market demand.
At the time of the field experiment, two varieties were cultivated across layers. Ready-for-harvest Butterhead lettuce was present on the top layer, young Cristabel lettuce was cultivated on the middle layer, and the bottom layer was unplanted.
To promote internal air circulation, the greenhouse is equipped with both above-mounted and below-mounted axial-flow circulation fans. Ten large-circulation fans are installed above the cultivation racks at approximately 3.0 m above the floor (Fig. 3A), forming a horizontal closed-loop airflow pathway along the longitudinal flow as shown by the blue arrows. Among them, two fans (Fan 5 and Fan 10) are positioned to induce a 90° directional change in airflow, while the remaining 8 fans generate straight longitudinal flow. In addition, four smaller circulation fans are installed beneath selected cultivation racks at approximately 0.3 m above the floor (Fig. 3B). These fans are horizontally mounted and operate in an unobstructed zone below the cultivation layer, where they do not directly interact with crop canopies. The four fans are mounted on racks #1, #7, #14, and #21, covering a total of 34 cultivation racks across the greenhouse. The airflow direction of the below-mounted fan is from rack #1 to rack #34, as shown by the blue arrows. Detailed specifications, including fan diameter, rated power, and maximum airflow capacity, are summarized in Table 1.
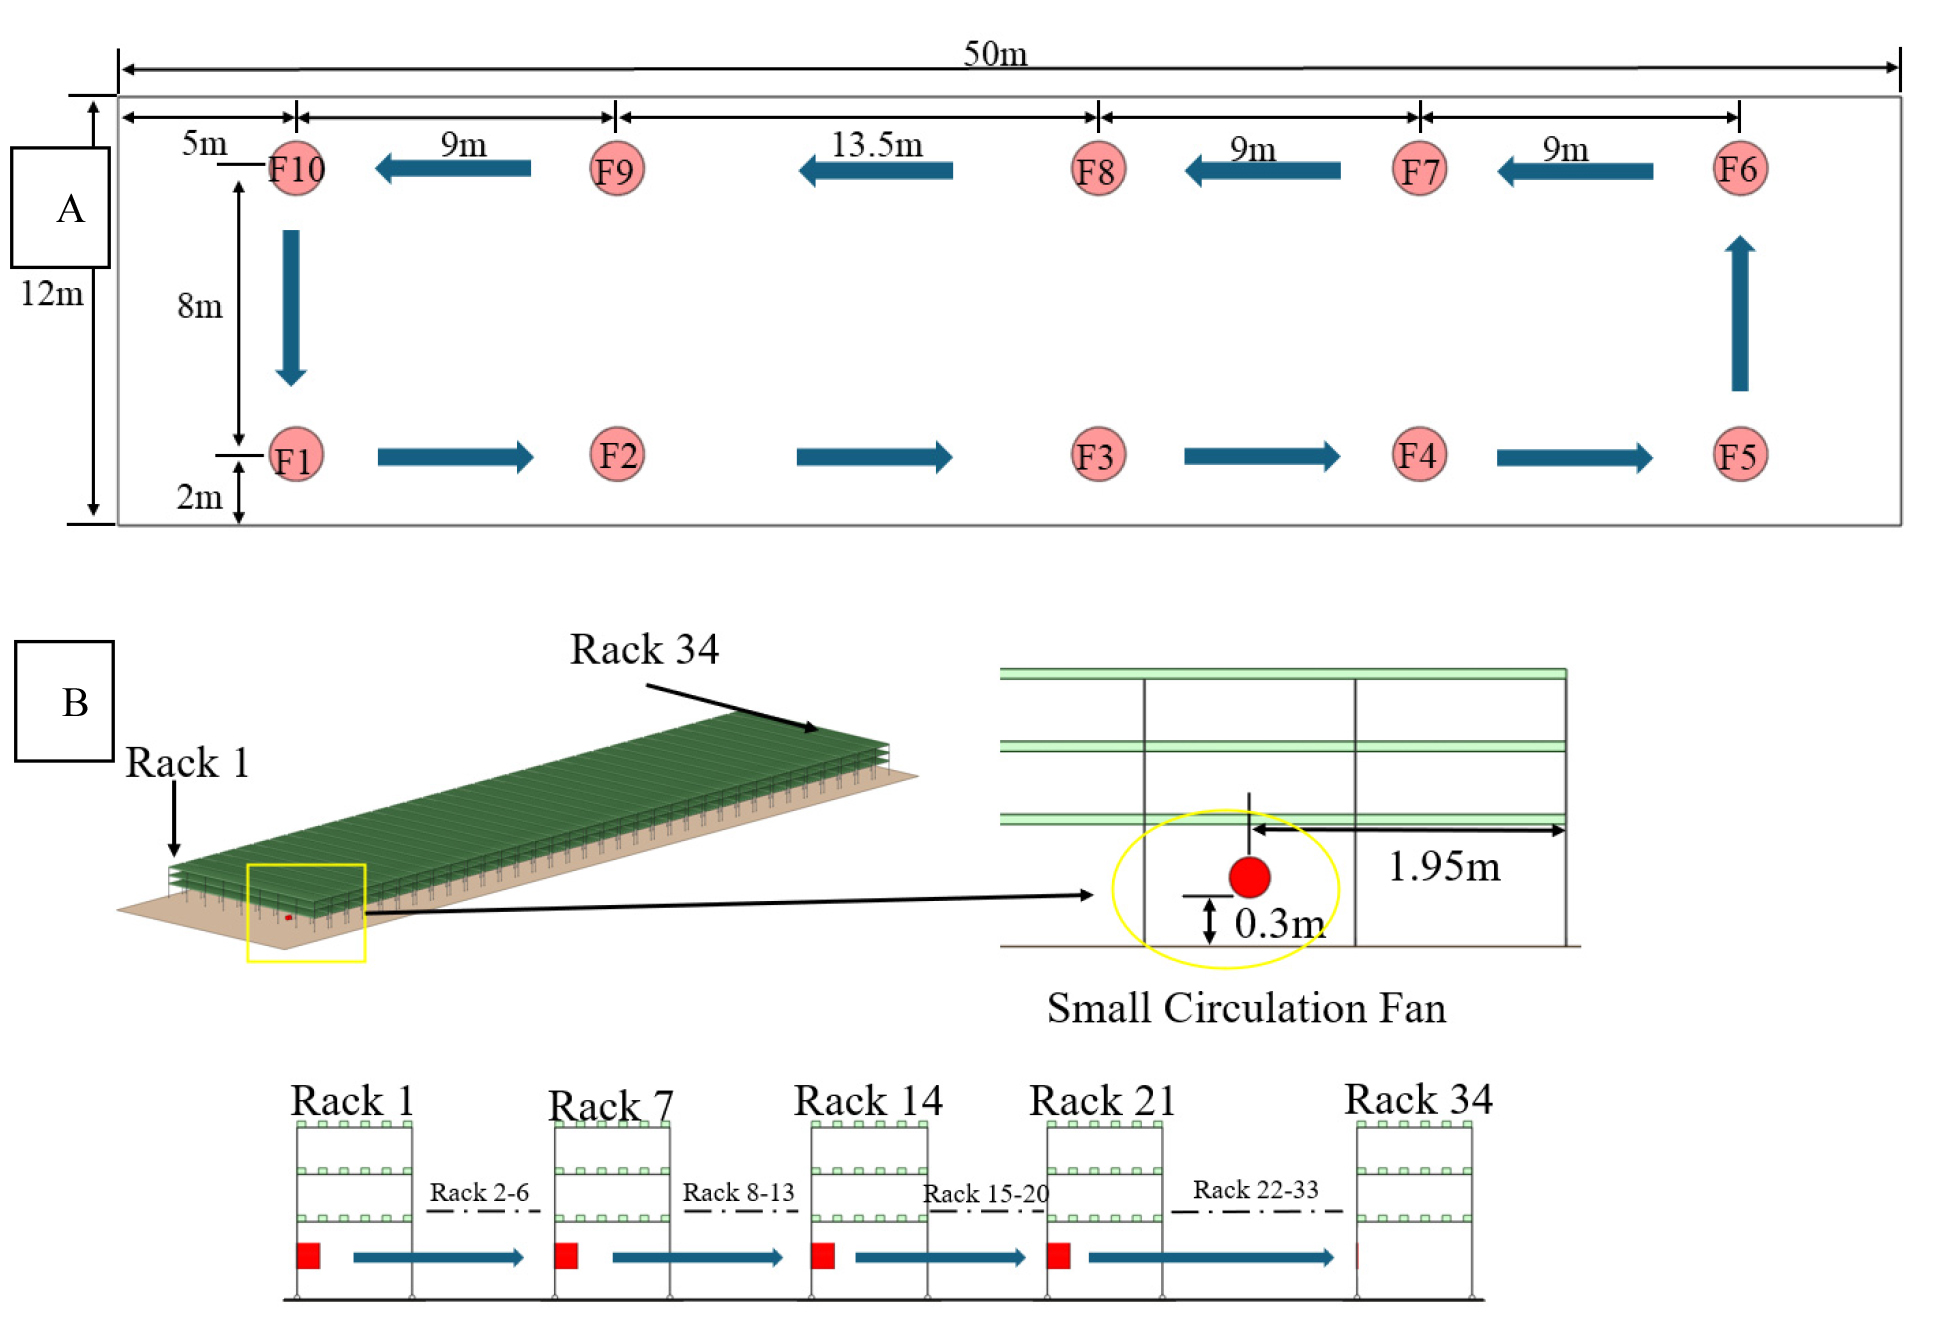
Table 1
Air circulation fan specifications (Shinan Green Tech Co. Ltd)
2. Fan outlet-velocity measurement
The outlet air velocity of circulation fans was measured to evaluate airflow momentum uniformity within the greenhouse air circulation loop. The average fan outlet air velocity was measured in situ using a hot-wire anemometer (405i, Testo SE & Co. KGaA, Lenzkirch, Germany). Measurement was conducted in accordance with ASHRAE (2021) airflow measurement principles, which recommend multi-point sampling and spatial averaging to account for non-uniform flow fields.
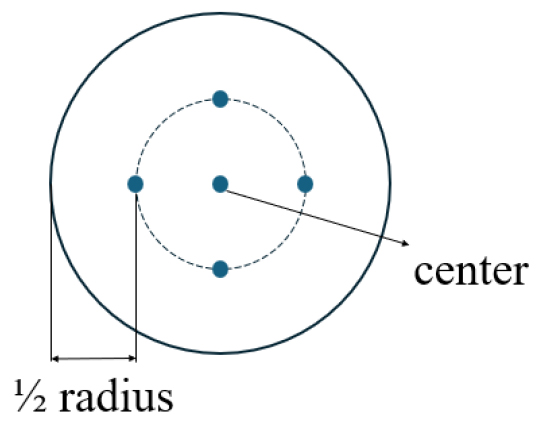
For each fan, air velocity was measured at five locations on a plane normal to the fan axis: one at the center and four equally spaced points at half the radius (Fig. 4). This method was adapted from the spatial averaging principles outlined in AMCA standard 210 (AMCA, 2016). Measurements were taken at a fixed downstream distance of approximately 7 to 10 cm (≈0.2-0.3 fan diameters). Each point was recorded for 1 minute, and the arithmetic mean of the 5 values was used to represent the effective outlet velocity.
3. Environmental data measurement
Air temperature and RH were measured using temperature and humidity loggers (HOBO UX100-011A, Onset Computer Corp., Bourne, MA, USA) at nine indoor locations arranged in a 3 × 3 grid pattern along the greenhouse width and length. At the same locations, anemometer sensors were installed to monitor greenhouse airflow at approximately the same level as the topmost layer of the multi-layer system. Kanomax Multi-Channel Anemometer (Model 1590, Kanomax USA, Inc, New Jersey, USA) with hot-wire probe sensors (Model 0975-00) was used to log air velocity (1-minute interval). The airflow measurements were intended to characterize point-based local airflow magnitude at the sensor’s locations.
Sensors were positioned at a uniform height of 1.5 m above the floor, corresponding to the crop canopy of the upper layer of the cultivation rack. Sensors 1-3 are positioned on the left side of the greenhouse, Sensors 4-6 in the central region, and Sensors 7-9 on the right side. All indoor sensors are positioned with equal spacing along the length of the multi-layer cultivation rack. Sensors 2, 5, and 8 are in the middle, and the other sensors are 2.6 meters away (as shown in Fig. 5). One sensor was mounted outside the greenhouse, approximately 3.0 m away, to monitor the ambient temperature. The recording interval is 1 minute.
To evaluate the effect of forced-air circulation on the greenhouse microclimate, two operating scenarios were analyzed: Scenario 1 (full-open window with the fan on) and Scenario 2 (full-open window with the fan off). Prior to the experiment, a stabilization period of approximately 30 min was allowed between scenarios to ensure steady microclimatic conditions. Scenario 1 was conducted first, followed by another stabilization period, and then Scenario 2. A temperature and RH sensor was also installed approximately 3 m from the greenhouse to monitor ambient temperature. This experiment was conducted to quantify how circulation fans affect the spatial distribution of temperature and RH under identical natural ventilation conditions. However, other outdoor environmental conditions were not measured, which is a limitation of this study. The field measurement was conducted under commercial greenhouse operating conditions. The measured fan outlet velocity, greenhouse air velocity, air temperature, and RH were used to characterize spatial variability and the differences between the fan-on/off operating conditions using the sensor’s location. Descriptive statistics were used to characterize the measured environmental data.
Results and Discussion
1. Performance analysis of greenhouse circulation fans
Measured outlet velocities of the above-mounted circulation fan ranged from 3.23 to 5.00 m/s, indicating a substantial variability among the fan’s individual performance (Fig. 6A). Fan 5 (3.23 m/s) exhibited the lowest outlet velocity, while Fan 9 (5.0 m/s) exhibited the highest outlet velocity. The average outlet velocity of the above-mounted fans is 3.87 m/s, with a standard deviation of 0.63 m/s and a coefficient of variation of 16.3%, indicating that wind speed variation depends on the fan's location.
When fans are grouped by flow-path role, a clear difference is observed. Fans aligned for straight longitudinal airflow (Fans 1-2-3-4 and 6-7-8-9) generally produced higher outlet velocities (4.32-5.00 m/s) than the fans responsible for 90° directional turning (Fans 5 and 10, 3.23-3.97 m/s). This pattern suggests that directional turning was associated with lower local outlet velocity, likely due to increased resistance and momentum dissipation at turning points. As a result, although turning fans (Fan 5 and 10) are sufficient to maintain the looped air circulation, they weaken airflow continuity and reduce mixing strength along the circulation path. However, the present field measurements do not account for the possible effects of structural resistance, inlet conditions, and installation position.
Also, the above-mounted circulation fan was designed for symmetrical recirculating flow; the measured velocities suggest an imbalance in airflow. It is also noticeable that Fans 3 and 9 (4.70 m/s and 5.0 m/s, respectively) exhibited higher wind velocities positioned about 13.5m from adjacent fans, while fans spaced at 9 m showed lower velocities (3.23-4.32 m/s). This pattern suggests that local inlet conditions and upstream airflow interaction may have influenced fan performance. Wider fan spacing may reduce interaction with disturbed or recirculating airflow from neighboring fans, thereby allowing a more stable inlet condition. In contrast, closely spaced fans may experience disturbed inflow, leading to non-uniform fan outlet performance.
Below-mounted air circulation fans exhibited a relatively consistent outlet velocity (Fig. 6B) due to their installation in an unobstructed zone beneath the cultivation racks. Below-mounted fan outlet velocities ranged from 3.43 to 4.57 m/s, with a mean of 4.00 m/s, a standard deviation of 0.47 m/s, and a coefficient of variation (CV) of 11.7%. Fan 2 exhibited the highest velocity at 4.57 m/s, while Fan 4 exhibited the lowest at 3.43 m/s, and Fans 1 and 3 produced intermediate outlet velocities of 3.92 m/s and 4.06 m/s, respectively. However, only four below-mounted circulation fans are installed beneath the 34 cultivation racks, indicating limited floor-level coverage within the greenhouse. The fans are beneath racks 1, 7, 14, and 21, while the remaining area is not directly affected by the below-mounted fans. This uneven fan installation could cause vertical and horizontal stratification of the floor-level microclimate, such as localized low-velocity zones and temperature and moisture stagnation.
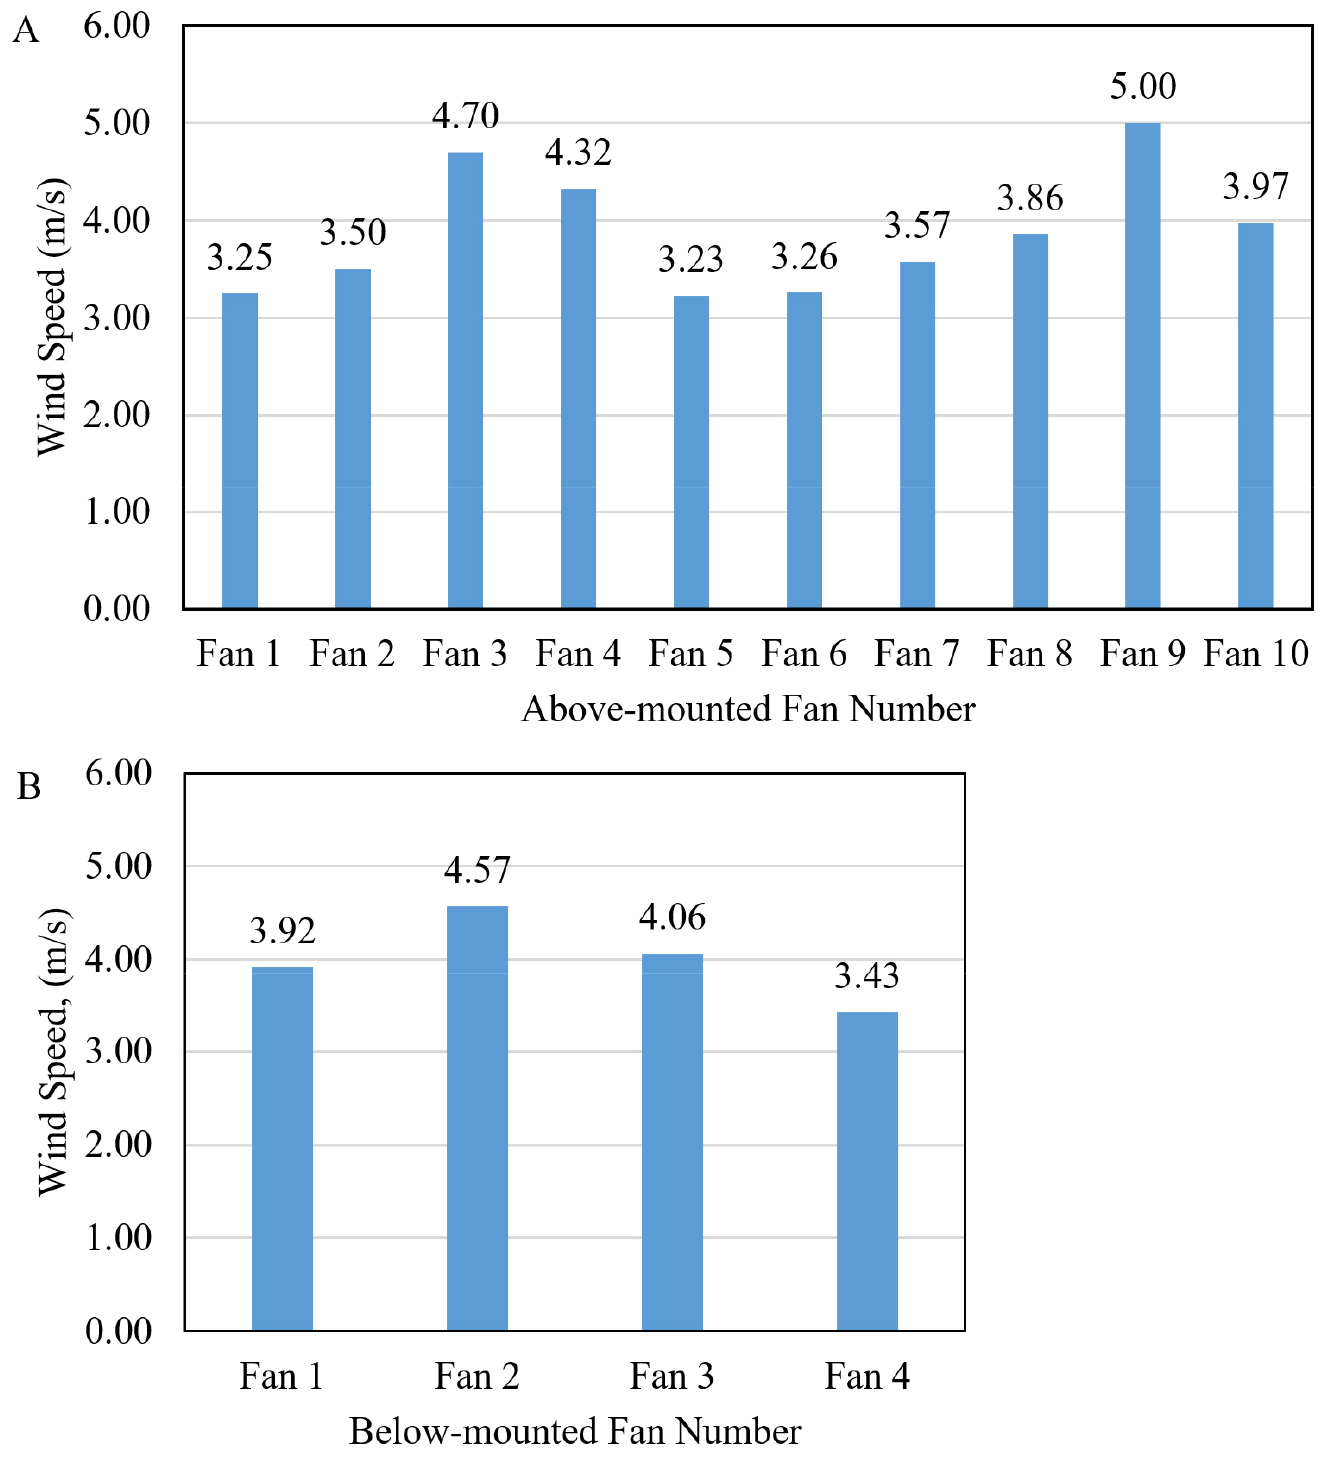
In relation to the manufacturer-rated maximum wind volume shown in Table 1, the measured outlet velocities of both the above-mounted and below-mounted fans were lower than the nominal performance level expected under standard test conditions. Although the fan’s catalog value is not directly equivalent to the measured field values, this suggests that the installed fans operated below their rated maximum capacity under the actual greenhouse conditions, likely due to the installation effects and local airflow resistance.
This interpretation aligns with previous studies that emphasize that airflow coverage and spatial distribution are more critical than outlet velocity alone. Zhang et al. (2025) demonstrated that supplemental airflow beneath the canopy can lower humidity by -3.2% and reduce canopy-level temperature by 1.3°C, provided sufficient airflow coverage across the cultivation area. Similarly, Sohn et al. (2023) emphasized the benefits of floor-level air outlets in minimizing stagnation at the bottom tier of stacked cultivation systems but also reported that uniform microclimatic conditions require either a higher outlet density or ducted air delivery to ensure continuous coverage across all cultivation zones. Therefore, improving floor-level microclimate uniformity in multi-layer vertical farming greenhouses requires not only sufficient fan performance but also increased fan density or improved airflow distribution strategies that deliver forced airflow uniformly across the cultivation area.
2. Analysis of the internal greenhouse environment (air temperature, RH, airflow)
The greenhouse internal environment was measured for approximately 6 hours on November 20, 2025, from 10:45 to 16:45. This daytime period was selected to capture greenhouse conditions under active solar influence. Nine sensors were distributed throughout the greenhouse, with one placed outside to monitor ambient temperature (Fig. 5). This experiment was conducted to determine the spatial distribution of temperature, RH, and airflow at sensor locations within the experimental greenhouse.
As shown in Fig. 7, indoor mean air temperatures from Sensors 1-9 are as follows: 23.99°C, 23.98°C, 21.85°C, 22.37°C, 25.78°C, 25.28°C, 21.47°C, 23.22°C, and 22.18°C, respectively. In contrast, RH values for Sensors 1-9 are as follows (Fig. 7): 52.14%, 50.87%, 49.47%, 53.38%, 47.92%, 51.03%, 57.06%, 43.74%, and 54.42%, respectively. A clear moderate inverse relationship between temperature and RH (r = -0.46) was observed across the measurement points, with warmer locations generally having lower RH.
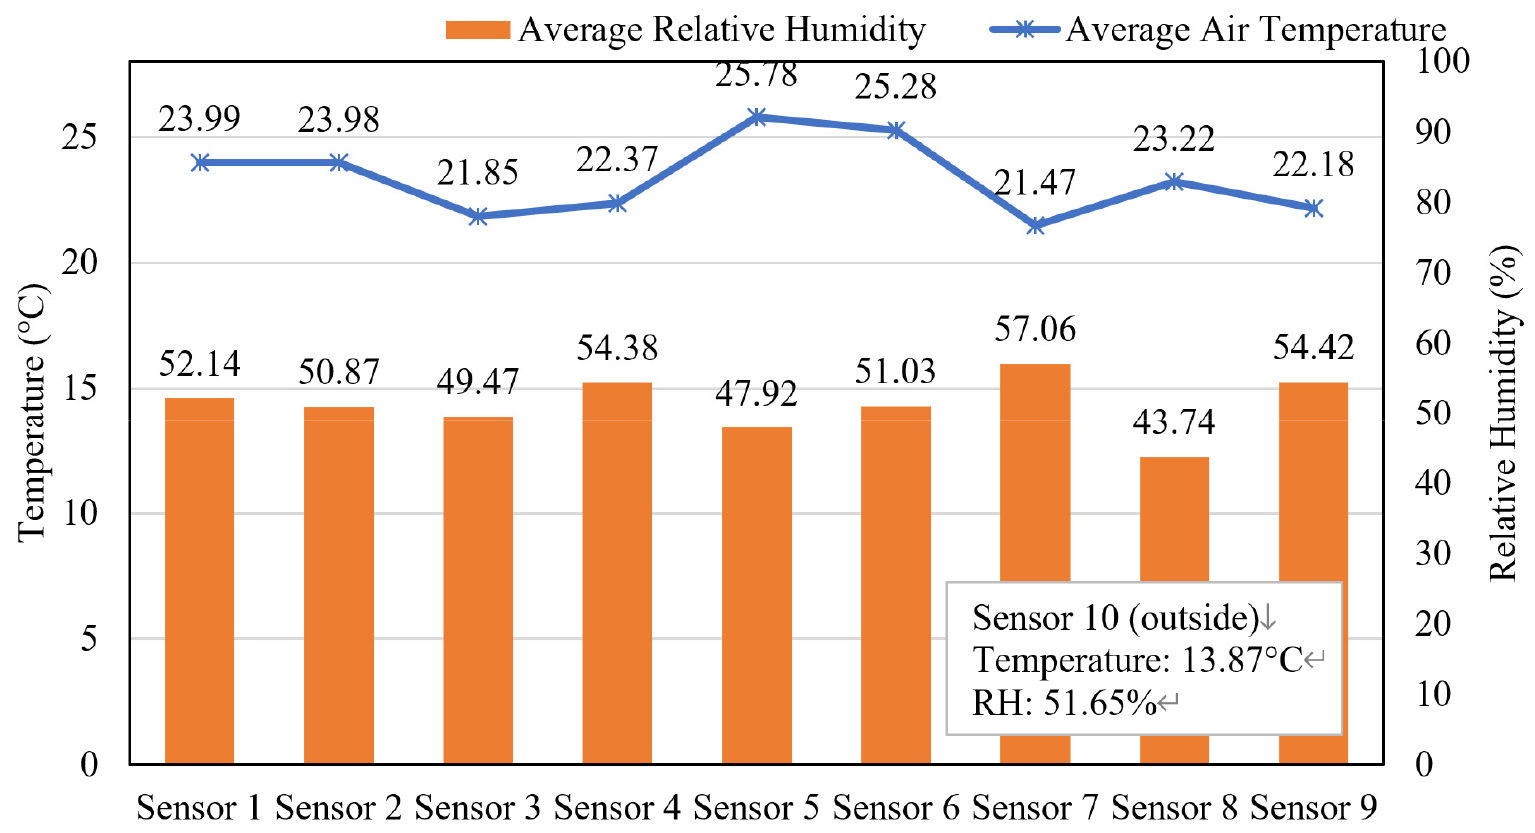
The overall mean indoor temperature was 23.34°C, with a range value of 21.47°C-25.78°C, and a standard deviation of 1.52 °C, yielding a CV of 6.52% (Table 2). Mean RH was 51.23%, with a range value of 43.74%-57.06%, a standard deviation of 3.96%, and a CV of 7.73%, indicating moderate spatial non-uniformity of both thermal and moisture conditions.
Table 2
Descriptive statistics of the mean air temperature and mean RH measured in the greenhouse
| Parameter | Air Temperature (°C) | Relative Humidity (%) |
| Mean | 23.34 | 51.23 |
| Standard Deviation | 1.52 | 3.96 |
| Minimum | 21.47 | 43.74 |
| Maximum | 25.78 | 57.06 |
| Range | 4.31 | 13.32 |
| CV (%) | 6.52 | 7.73 |
| n | 9 | 9 |
| Pearson r | -0.46z | |
Based on the sensor locations, the greenhouse exhibited a pronounced temperature and RH gradient. The highest temperatures were recorded in the central region: Sensor 5: 25.75°C and Sensor 6: 25.28°C, while the lowest temperature was recorded at Sensor 7: 21.47°C. The higher temperature in the central region indicates a localized heat accumulation due to weaker air exchange. In contrast, cooler regions suggest a stronger influence of incoming outdoor air and a more direct pathway for air ventilation.
The lowest RH was observed at Sensor 8 (43.74%) and Sensor 5 (47.92%), while the highest RH was observed at Sensor 7 (57.06%) and Sensor 4 (53.38%). The occurrence of high temperatures and low RH in the central regions (specifically at Sensor 5) indicated that the area has constrained air exchange, insufficient heat removal, and limited replenishment of cooler, moister air. On the other hand, the cooler, more humid region (Sensor 7) indicates stronger outdoor air exchange.
The observed spatial heterogeneity in air temperature and RH across sensor locations is consistent with a field-scale greenhouse investigation showing that, despite ventilation, non-uniform microclimatic conditions can persist. Sun et al. (2023) conducted a field experiment in a Venlo-type greenhouse (160 m × 88 m) and reported that temperature and RH non-uniformity arise from the combined effects of greenhouse structure, solar radiation distribution, crop canopy, and circulation equipment, rather than from ventilation alone. Their experiment confirmed that spatial heterogeneity is an inherent characteristic of a large commercial greenhouse. In addition, (Wei et al. 2024) studied temperature and RH distribution in a South China greenhouse (30 m × 32 m) and showed that spatial gradients are strongly governed by airflow pathways under an active ventilation system, while natural ventilation produces weaker and more variable horizontal patterns with localized cooling near openings on a favorable wind condition.
This observed spatial heterogeneity in temperature and RH persists despite the presence of looped-circulation fans, implying that the air circulation loop improved mixing only partially and could not fully overcome the structural resistance imposed by the dense cultivation racks and canopy. Prior studies reported that circulation fan arrangement and fan capacity affect the spatial distribution of temperature and RH, and that uniformity depends on whether airflow effectively reaches interior/canopy regions rather than simply when the fan is operating (Yu et al. 2007; Lee et al. 2016).
Lettuce is highly sensitive to localized microclimate conditions. Insufficient airflow in the canopy can suppress transpiration, potentially leading to a tip burn. Also, cooler, humid regions may experience delayed growth, contributing to non-uniform canopy development and inconsistent harvests. Hence, improving thermal and moisture uniformity through fan output balancing, optimizing circulation paths, and adding targeted vertical or horizontal localized airflow is expected to reduce hot and cold zones, thereby promoting more uniform and healthier crop growth.
The spatial distribution of airflow inside the greenhouse is shown in Fig. 8. Local air velocity ranged from 0.08 to 0.21 m/s across the nine sensor locations. Sensor 1 recorded the highest air velocity (0.21 m/s), whereas Sensor 7 recorded the lowest (0.08 m/s). Intermediate values were measured at Sensors 2, 3 and 5 (0.15 m/s), Sensors 4 and 8 (0.13 m/s), and Sensor 6 and 9 (0.17 m/s).
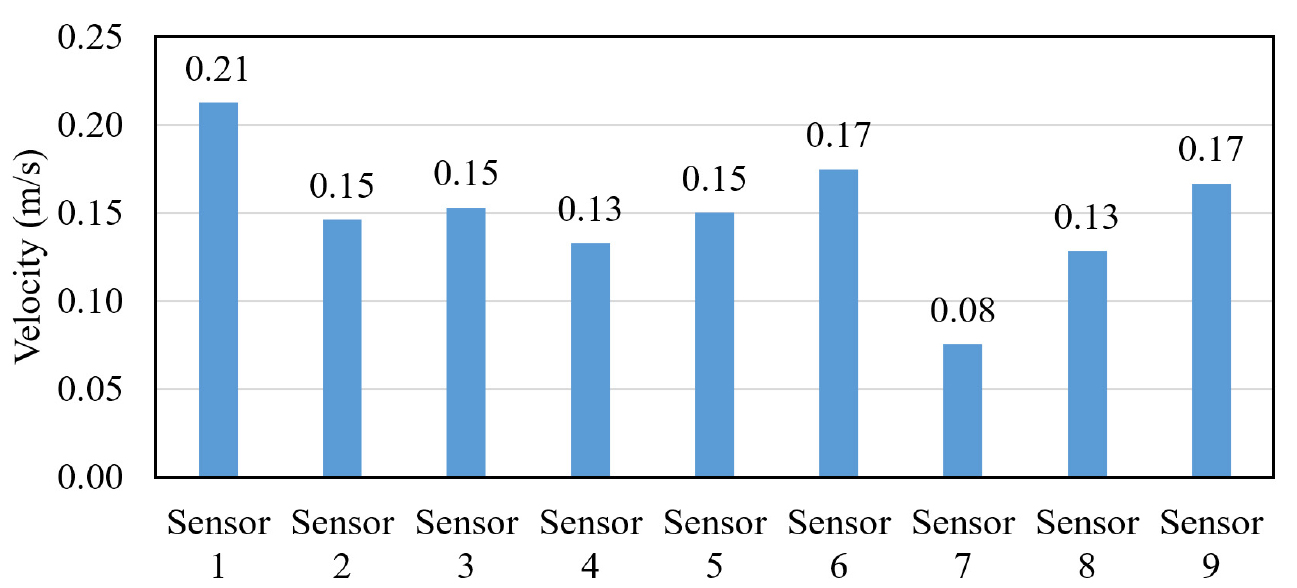
The measured air velocity at the sensor locations indicates that the airflow distribution within the cultivation area is relatively low. Even though an airflow spatial variation was observed at the sensor locations, the measured airflow range (0.08-0.21 m/s) was comparatively lower than the circulation fans' outlet velocity (3.23-5.00 m/s). This indicates a reduction in momentum between the fan outlets and the sensor locations within the greenhouse. This range was also lower than canopy-level airflow values previously associated with improved lettuce transpiration and reduced tip-burn risk, which is approximately 0.28 m/s (Zhang et al. 2016). Considering that adequate airflow is important for lettuce transpiration and gas exchange, these results suggest that the present circulation-fan arrangement may still require further improvement to provide a more effective airflow distribution within the multi-layer cultivation space.
3. Analysis of the effect of circulation fans on the greenhouse internal environment
The experimental greenhouse exhibited pronounced spatial heterogeneity in thermal and moisture conditions, as previously discussed. To evaluate the effect of forced air circulation under stabilized conditions, two scenarios were analyzed: Scenario 1 (full-open window with fan ON) and Scenario 2 (full-open window with fan OFF). A stabilization period of approximately 30 min was applied between scenarios to minimize transient thermal effects.
Under fan-off conditions (Scenario 2 as shown in Fig. 9), the mean greenhouse air temperature was 25.22°C, with a standard deviation of 2.83°C, indicating substantial temperature nonuniformity. When the circulation fan was operated, the mean air temperature decreased slightly to 24.37°C, and the standard deviation decreased to 2.74°C. Although the reduction in mean temperature is minimal (ΔT = -0.85°C), the relatively small change in standard deviation suggests that fan operation was associated with only a modest improvement in internal mixing rather than a substantial reduction in the overall greenhouse temperature gradient. This greenhouse behavior is consistent with the findings of Bournet and Boulard (2010) and Mao et al. (2024), they discussed that circulation fans can reduce spatial variability but often fail to fully homogenize the greenhouse due to persistent stagnation zones.
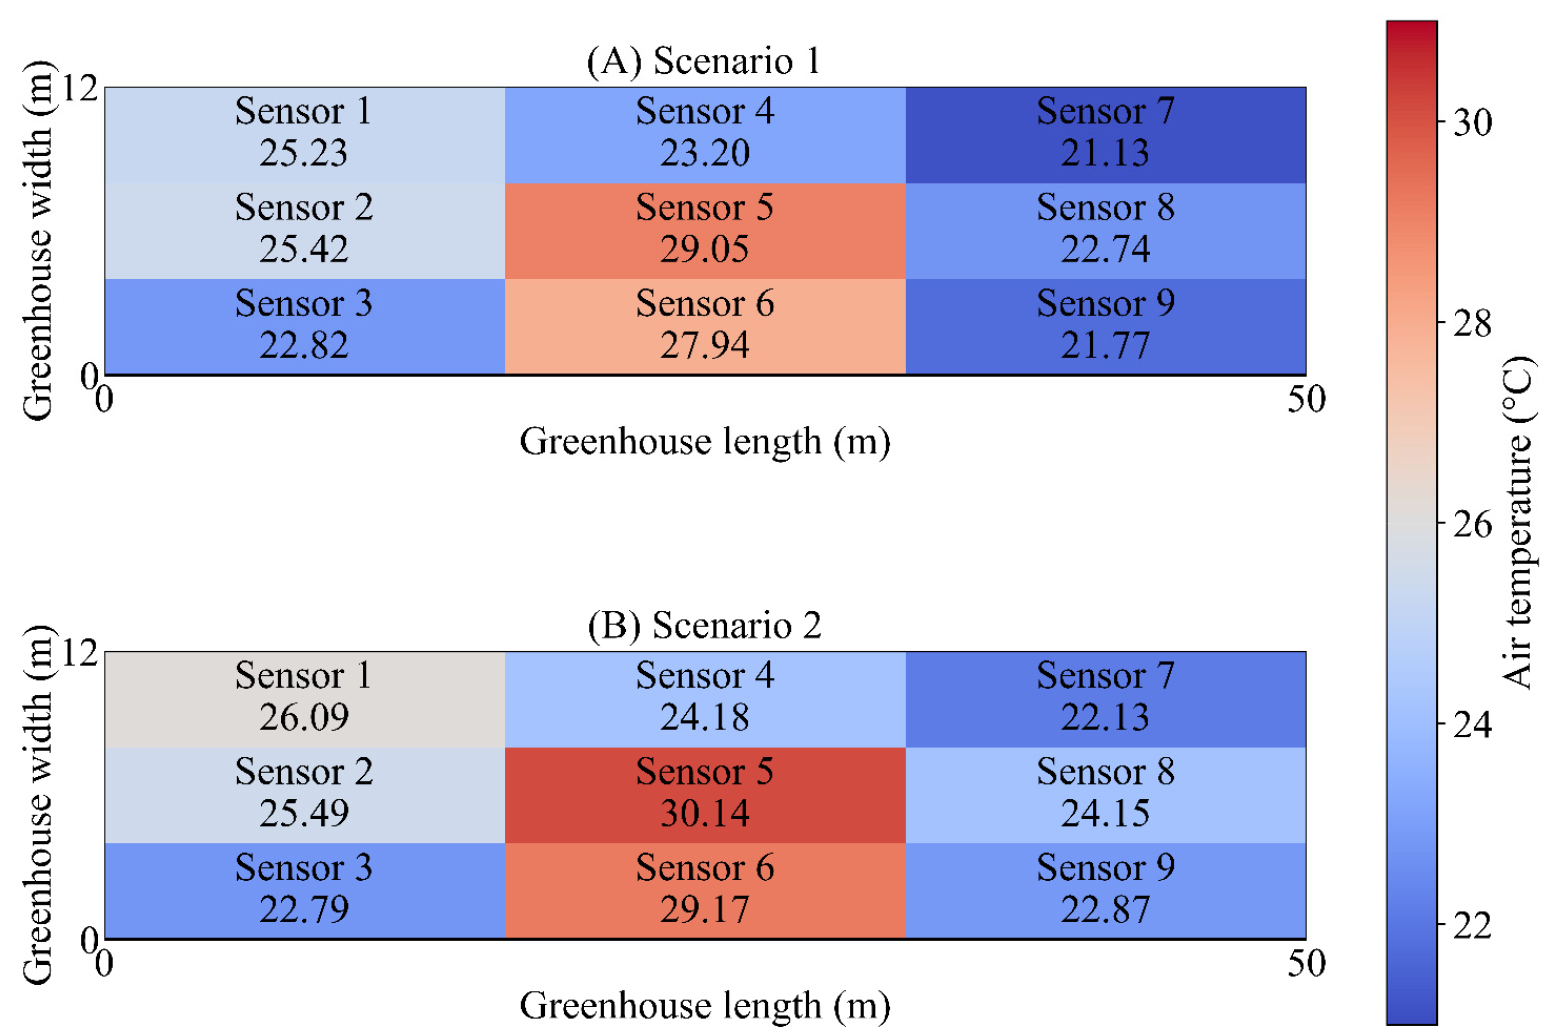
Spatial temperature patterns remained largely consistent between the two scenarios. The central sensor (Sensor 5) recorded the highest temperature under both scenarios, whereas Sensor 7 consistently exhibited the lowest temperature. The maximum difference among measurement points remained large (approximately 7.27°C), demonstrating that forced circulation alone was insufficient to eliminate localized temperature gradients. This aligns with the findings of Bojacá et al. (2009) and Sun et al. (2023) that heterogeneity arises from multiple factors (structural shading, solar radiation, etc.) rather than ventilation performance alone. Also, the heat map generated by Bojacá et al. (2009) using the geostatistical method showed that homogeneous temperatures were observed at night, whereas during the day heterogeneous temperatures were observed across different sizes, designs, and locations in the greenhouse.
Among the sensor locations, Sensor 6 consistently recorded the second-highest air temperature, despite being located near a side window. The relatively high temperatures measured at Sensors 5 and 6 may be influenced by solar radiation exposure during the measurement period, since the greenhouse’s central part is most exposed to sunlight at that time. Thus, warm conditions in that region may have been driven by both local airflow and solar radiation. Although Sensors 3, 6, and 9 are located near the side window, the cooling effect of natural ventilation was not uniform across them. The Sensor 6 location remained warm under both operating conditions. This observation aligns with He et al. (2015), who found that the internal thermal environment of a greenhouse is primarily governed by airflow patterns driven by specific vent configurations rather than by the presence of an opening alone. Their study showed that relying solely on side openings can result in non-uniform air exchange, leading to a specific zone retaining heat due to uneven airflow distribution.
In contrast, Sensor 7 consistently recorded the lowest air temperature. This suggests that cool air from the side windows was transported along the airflow path and accumulated at Sensor 7. Overall, the maximum temperature difference among measurement points was approximately 7.27°C, demonstrating that the circulation fan alone was insufficient to eliminate localized temperature gradients.
RH distribution under the two scenarios is shown in Fig. 10. In Scenario 1 (fan ON), indoor RH ranged from 37.58% to 57.10%, with a standard deviation of 6.26%. In Scenario 2 (fan OFF), it ranged from 34.04% to 56.59%, with a standard deviation of 6.80%. Recorded outdoor RH was 53.40% and 52.61%, respectively. This shows that Scenario 1 has a higher indoor RH range and lower spatial variability than Scenario 2. These results suggest that under a full-open window and fan-on condition, there is a modest improvement in RH uniformity. However, the overall spatial RH pattern remained broadly similar across the two scenarios, with Sensor 5 showing the lowest RH and Sensor 7 the highest in both, indicating that fan operation contributed only limited homogenization of RH under the tested full-open window condition.
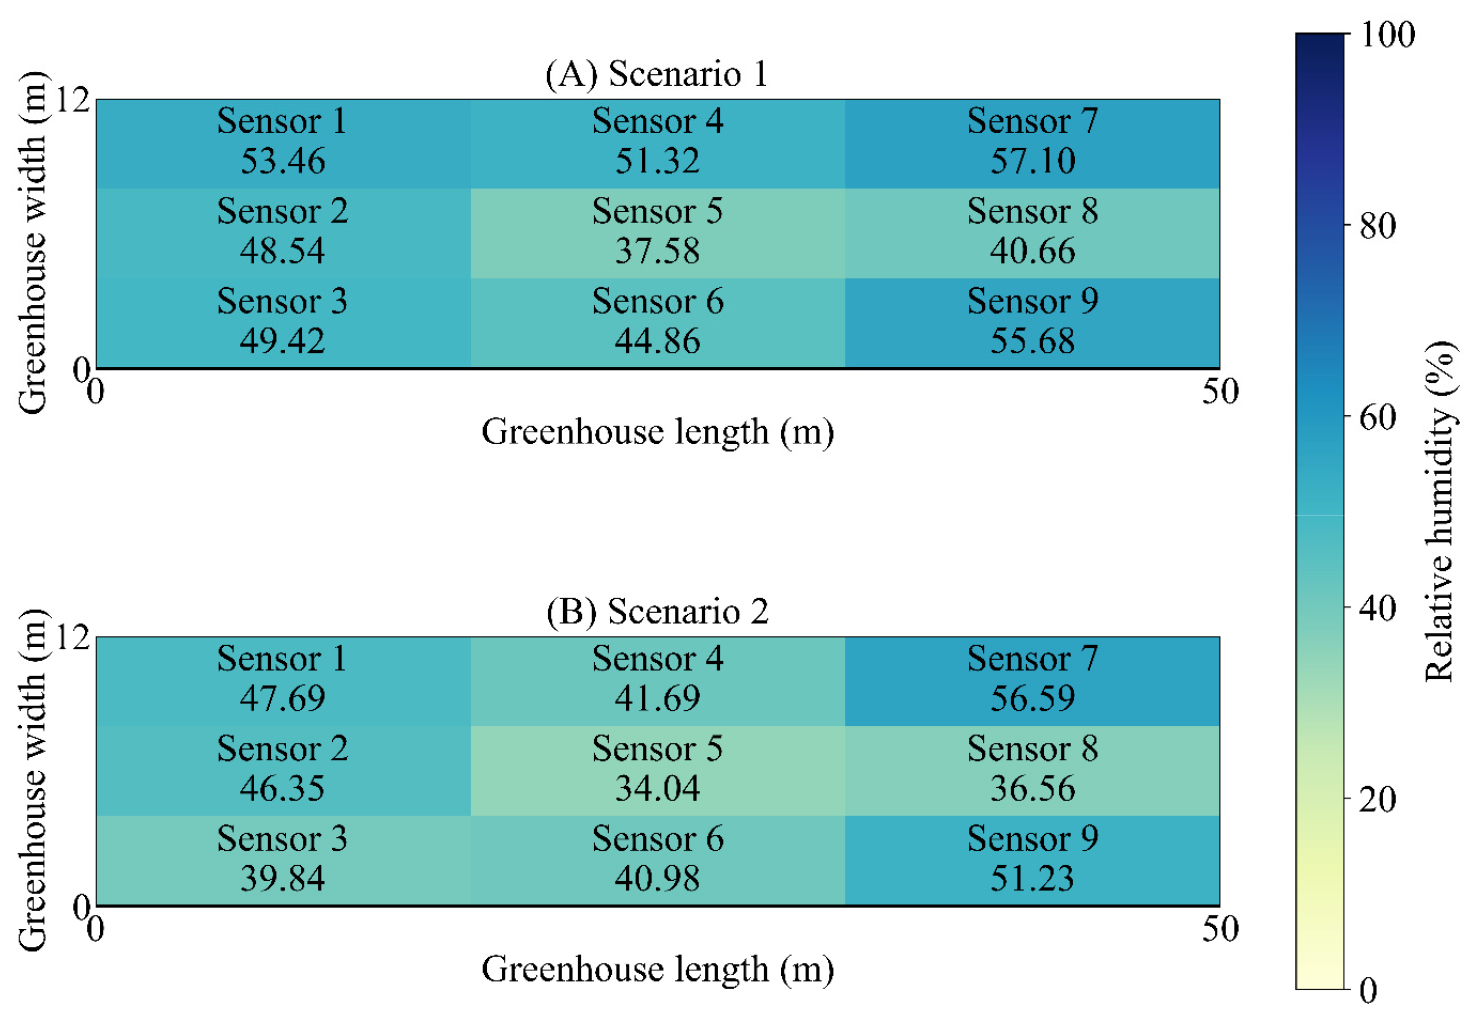
Overall, the fan-on/off comparison suggests that circulation fan operation under the tested full-open window condition was only associated with limited heat and moisture redistribution (in the sensor’s location). The observed changes were modest, and the greenhouse remained spatially non-uniform in both scenarios. These results suggest that spatial non-uniformity was likely influenced by structural and geometric factors within the multi-layer cultivation system, even under mechanical circulation. (Bournet & Boulard, 2010; Mao et al., 2024).
Conclusion
This study experimentally evaluated circulation fan performance and microclimate non-uniformity in a commercial multi-layer vertical farming greenhouse. Based on the measured outlet velocity of above-mounted fans, substantial variability was observed, ranging from 3.23 to 5.00 m/s, with reduced outlet velocities at the corner and 90° turning fans. This indicates an imbalance in the momentum distribution along the horizontal circulation loop. Below-mounted fans exhibited a more consistent outlet velocity (3.43-4.57 m/s); however, since only 4 of 34 racks have attached fans, its spatial coverage is limited.
Sensor-location-based measurements of the greenhouse internal environment showed spatial variability in air velocity, temperature, and relative humidity (RH). Greenhouse air velocity ranged from 0.08 to 0.21 m/s across the nine sensor locations, while air temperature and RH exhibited moderate spatial non-uniformity, with coefficients of variation of 6.52% and 7.73%, respectively. Central locations tended to show relatively higher temperatures and lower RH, whereas some peripheral locations were cooler and more humid.
Under the tested full-open window condition, fan operation showed a slight decrease in mean temperature and small reductions in the spatial variability of temperature and RH, suggesting only a modest improvement in internal mixing. However, the microclimate non-uniformity remained similar under both fan-on and fan-off conditions, indicating that circulation-fan operation did not eliminate it. Since the fan ON/OFF comparison was conducted under full-open window conditions without simultaneous measurement of all relevant outdoor variables, the scenario-specific differences are interpreted as field-based observations under the tested condition rather than as a fully isolated fan effect. The experimental dataset generated in this study will be used for computational fluid dynamics simulations to support visualization and optimization, enabling data-driven improvements to airflow paths, fan placement, ventilation strategies, and multi-layer spacing configurations for a multi-layer vertical farming greenhouse.
