

Introduction
The light, humidity, carbon dioxide concentration, temperature, and ventilation rate are the key factors influencing the greenhouse micro-environment (Pontikakos et al., 2006). Natural ventilation is a primary method to control humidity, temperature, and carbon dioxide concentration inside greenhouses (Lee and Short, 2000). Natural ventilation is the most effective among passive cooling techniques in lowering high air temperatures inside greenhouses. In the summer season, when the air temperature inside the greenhouse rises above the optimal level, natural ventilation is commonly used to reduce it. Agricultural greenhouses are predominantly naturally ventilated to control the inside air temperature at a reduced energy cost (Rasheed et al., 2018).
The size, position, and shape of vents are the crucial to the effectiveness of natural ventilation design. To design and optimize natural ventilation systems, it is important to conduct both qualitative and quantitative analysis of natural ventilation (López et al., 2011). In the past, many studies investigated greenhouse natural ventilation experimentally and numerically. The CFD tool provides a cost-effective way of design and optimization in agri-food industry. CFD has been applied in studies on crop farming, including greenhouses (Bartzanas et al., 2013). CFD is a valuable tool for investigations of the natural ventilation of buildings (Bartzanas et al., 2004) that has enabled research on the complex airflow patterns and conducting thermal analysis (Hong et al., 2017). CFD techniques have been applied in some studies to explore the effects exerted by different factors operating in greenhouses on natural ventilation, which is discussed below.
Mistriotis et al. (1997) used a CFD tool to examine the effect of the greenhouse length on the ventilation rate. The studies conducted by Lee and Short (2000);Haxaire et al. (2000), and Campen and Bot (2003) evaluated the influence of wind speed, wind direction, and vent opening on the natural ventilation rate of a greenhouse by using a CFD technique. Lee and Short (2001) did study on verification of CFD simulation of wind speed and temperature distribution inside the multi-span greenhouse. Additionally, many studies investigated the impact of the side and roof vent openings and the direction and speed of the wind on the greenhouse ventilation rate. Kacira et al. (2004b) investigated the effects different greenhouse vents configurations on natural ventilation rate of a two-span greenhouse. This study further studied the ventilation efficiency of a greenhouse while using a combination of side and roof vents. Interestingly, Shklyar and Arbel (2004) used a CFD code to explore the air flow pattern in a pitched-roof single-span greenhouse. In addition, Bartzanas et al. (2004) studied the effect of different configurations of tunnel greenhouse vents on the temperature pattern and airflow inside the tunnel. Pontikakos et al. (2006) use CDF tool to studied the natural ventilation efficiency inside the two-span greenhouse. Fatnassi et al. (2006) studied the effect of air flow greenhouse thermal environment of multi-span greenhouse in the presence of an insect screen; different roof and side vents arrangements were investigated. Kacira et al. (2004a) and Bournet et al. (2007) conducted numerical studies to assess the effect of different windward and leeward vents arrangements on the natural ventilation rate of a multi-span greenhouse. Moreover, Baeza et al. (2009) studied the effect of greenhouse side vents opposing distance on the buoyancy-driven natural ventilation in a multi-span greenhouse. Tong et al. (2009) used the CFD numerical simulation of investigate the temperature distribution inside the Chinese solar greenhouse. Jung- Soo et al. (2014) did a wind tunnel test to verify the CFD modeling and to improve the accuracy of the CFD code for the analysis of airflow inside the greenhouse. Benni et al. (2016) studied the different vent configuration of multi-span greenhouse aiming to identify the optimal configuration of greenhouse summer cooling. Lee et al. (2018) conducted research on the wind-driven natural ventilation rate inside a single-span greenhouse by using a CFD code, taking into account the following parameters: wind speed and direction, different greenhouse shapes, and vent openings. Recently, Senhaji et al. (2019) performed a CFD study using different side and roof vents configurations with the same wind speed directions to investigate the mass air flow rate and temperature distribution inside the multi-chapels greenhouse.
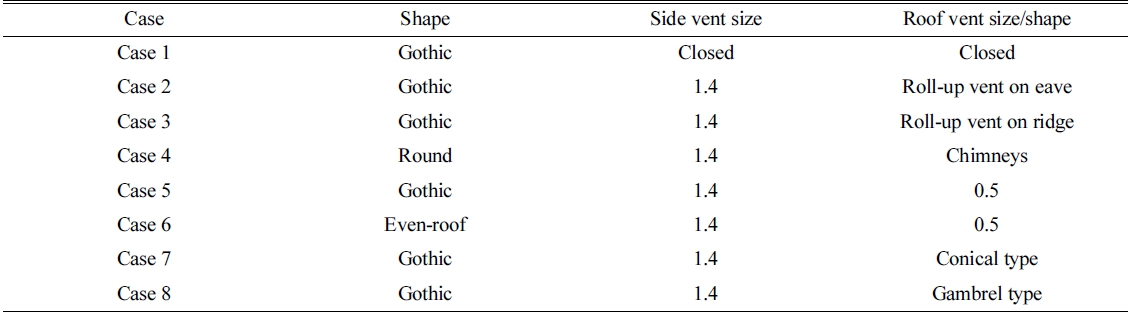
In this research, we used ANSYS Fluent, a CFD tool, to study the effect of different roof vents designs combined with side vents on the inside thermal environment of a single-span greenhouse. Here, we considered the buoyancy-driven natural ventilation effect exerted on the greenhouse internal air temperature and ventilation rate, in the absence of the wind or at an exceedingly low wind speed. The effectiveness of the reduction in the greenhouse internal air temperature and ventilation rate of all the selected roof vent designs commonly used for greenhouse natural ventilation were investigated. The present research was conducted to develop an improved naturally efficient greenhouse design.
Materials and Methods
1. Experimental greenhouse
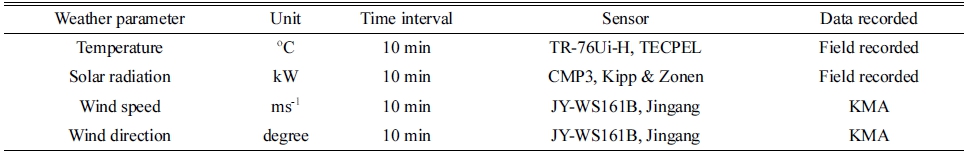
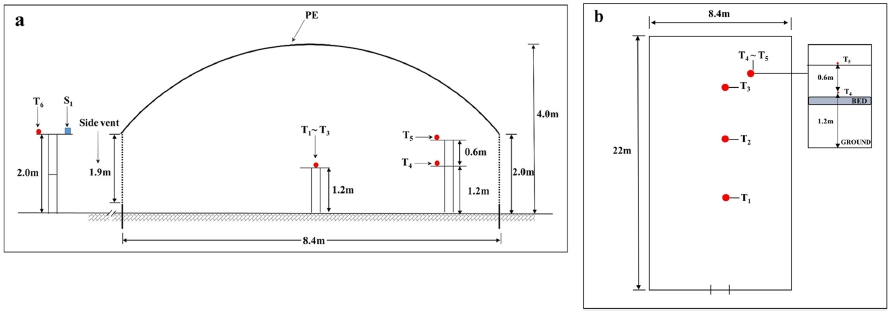
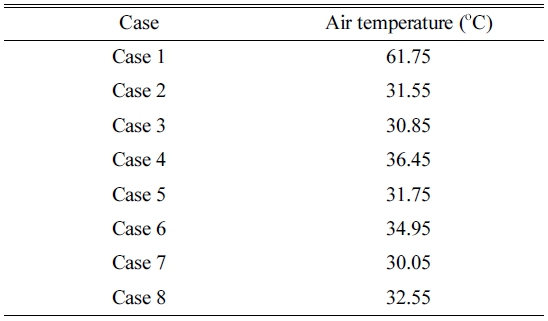
The experimental greenhouse was a rectangular-based, round-roofed, east-west oriented, single-span greenhouse covered with a 0.15 mm thick polyethylene (PE) film, located at Daegu (latitude 35.53°N, longitude 128.36°E, elevation 48m), South Korea. The dimensions of the greenhouse were 22m × 8.4m × 4m, with a total floor area of 184.8m2, and roof curvature angle of 25.5°. The outside weather data recorded were as follow: solar radiation, wind speed, wind direction angle, and outside air temperature were, 962w·m-2, 1.5m·s-1, 110°, 28°C, respectively. Moreover, the weather parameters were recorded around the solar midday of July. The outside weather data was collected to use as an input in CFD model and greenhouse internal air temperature were measured for the validation of the CFD results. The characteristics of the weather data are presented in Table 1. The air temperature inside the greenhouse was measured at five different locations, three sensors were placed at the center line along the length of the greenhouse, and two sensors were mounted at one side of the greenhouse at different elevations, the air temperature sensors positions and dimensions of the experimental greenhouse are illustrated in Fig. 1. The measured air temperature was utilized for comparison with the numerical modeling results for validation. During the experimental period, there was no crop inside the greenhouse, and it was naturally ventilated by continuously opened side vents only.
2. CFD modeling
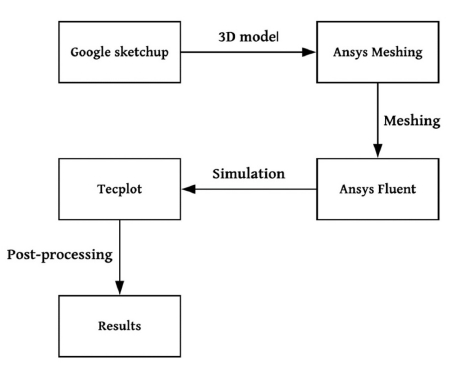
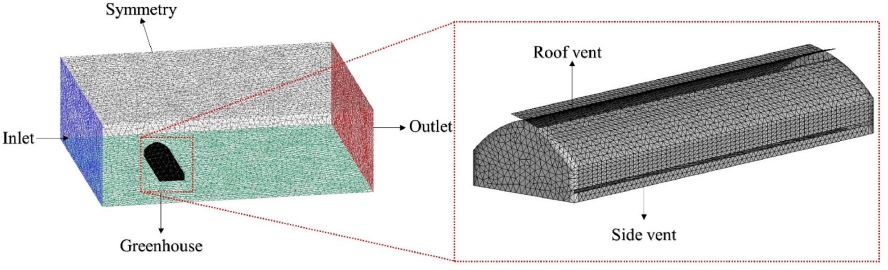
A computational fluid dynamics (CFD) program, (V.18.2, Fluent, ANSYS - FluentInc) was employed to predict the natural ventilation effect on the greenhouse internal air temperature and ventilation rate for various greenhouse and roof vent designs combined with side vents. The flow chart of the whole process is presented in Fig. 2. For this study, the first step preprocessing was conducted using Google SketchUpTM pro ver. 2015 software to prepare 3D models of greenhouses. Further, meshing was carried out in the ANSYS mesh component. In the second step, simulations were run for multiple cases using ANSYS Fluent ver. 18.2. Finally, post-processing of the simulation results was implemented by (Tecplot 360 2017 R2) software.
3. Computational domain and boundary conditions
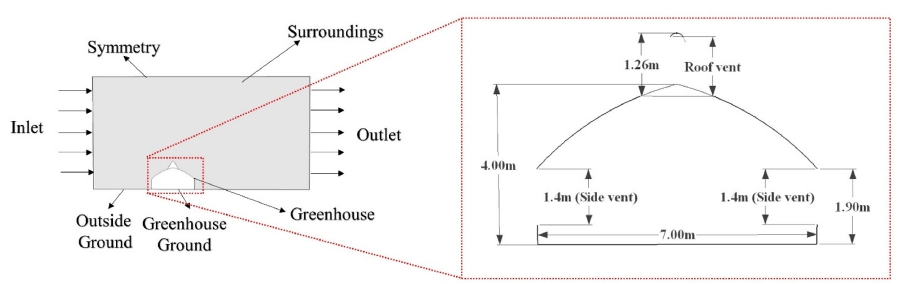
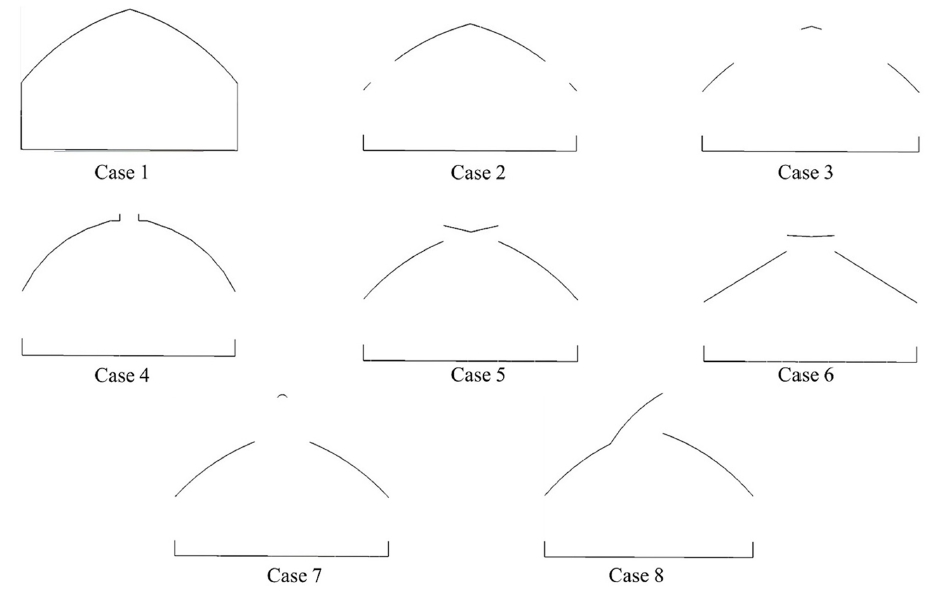
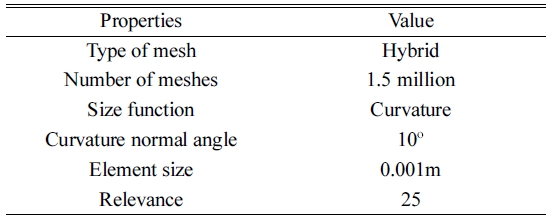
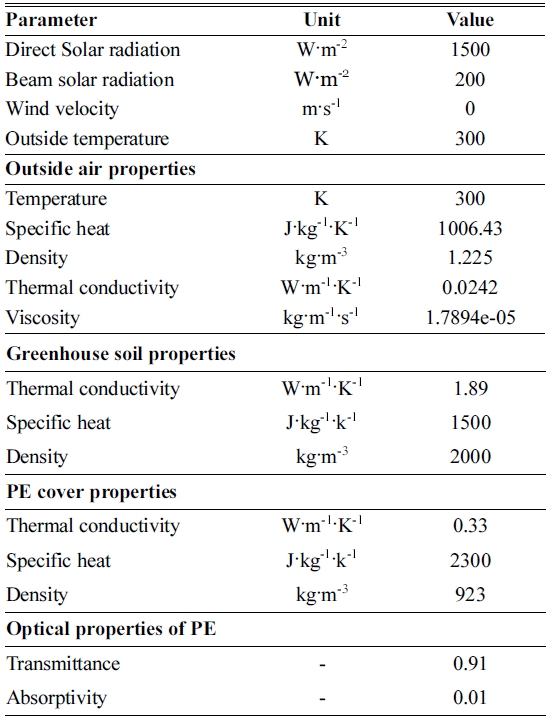
The program used the finite method to numerically solve the Navier-Stokes equations, i.e., the mass, energy, and the momentum balances, permitting the calculation of the air velocity and the temperature. The Boussinneq hypothesis was adopted to simulate the buoyancy effect to the whole computational domain. We studied buoyancy-driven natural ventilation to establish the effect of greenhouse vents on the inside air temperature under the worst-case scenario. RNG K-epsilon turbulence model was employed, which has been previously used in many studies for this type of analysis (Baeza et al., 2009). The discrete originates (DO) radiation model was used with solar ray tracing to simulate the effect of solar radiation. The Fig. 3 depicts the computational domain and dimensions of the gothic-shaped conical roof vent greenhouse, and Fig. 4 illustrates the meshing of the rectangular computation domain and the greenhouse. The details of the meshing are listed in Table 2, and Table 3 represents the data of the boundary conditions and material properties used in the simulations. Fig. 5 shows the configuration of the studied roof vents designs along with side vents. Table 4 shows the detail of the greenhouse shapes, side and roof vent sizes and shapes of all studied cases.
Results and Discussion
To validate the CFD model, the experimentally recorded greenhouse internal air temperatures at different points were compared with the CFD predicted air temperature, the results of which are presented in Table 5. The CFD computed results obtained using conditions identical to those of the experimental greenhouse. The computed results had a good agreement with the ones obtained in the experiment. The computed values at locations T1, T2, T3, and T4, exhibited a small air temperature difference from the experimentally obtained ones, which was less than 1°C, for location T5, the difference was 1.2°C.
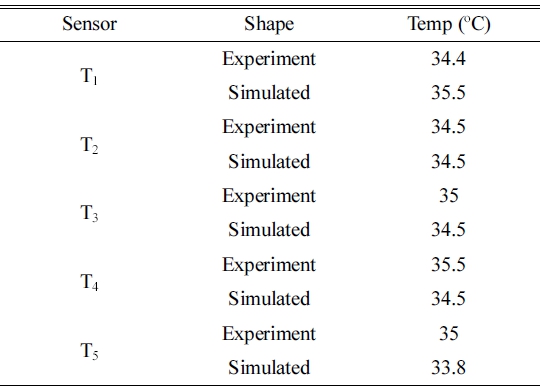
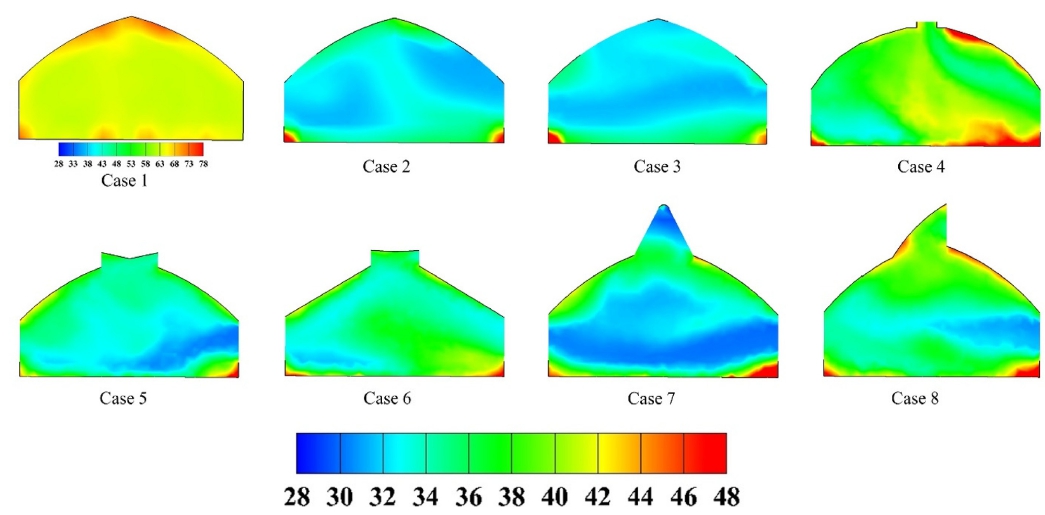
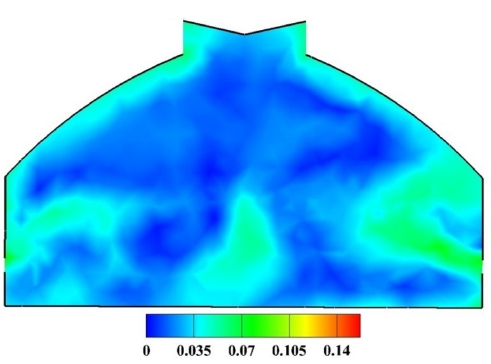
Fig. 6 illustrates the air temperature contours of all selected cases of different greenhouse roof ventilation systems. Simulations were carried out to establish the best roof ventilation system combined with the side vents of the single-span greenhouse. The reduction in greenhouse internal air temperature was compared with reference to a fully closed greenhouse. The air temperature value was measured at five different points along the width of the greenhouse at the height of 1.2 meter from the ground level and comparison was made between average air temperature inside the greenhouse. The results showed that case 7 had the lowest air temperature than the other cases, as can be observed in Table 6. Moreover, as can be seen, the air flow was from the side to the roof vents because, due to the extremely low wind conditions, the air moved from the bottom to up caused by the gravity force. In Fig. 7, the contour is presented of the wind speed inside the gothic-shaped greenhouse with continuous side and roof-vent openings. To observe the buoyancy-driven natural ventilation, the wind speed inside the greenhouse was measured when the outside wind speed was 0m·s-1. As can be seen from the results, the wind speed was slightly higher at both side vents (inlet) and roof vent (outlet). The air entered from both side vents and exited from the roof vents causing a reduction in the greenhouse air temperature.
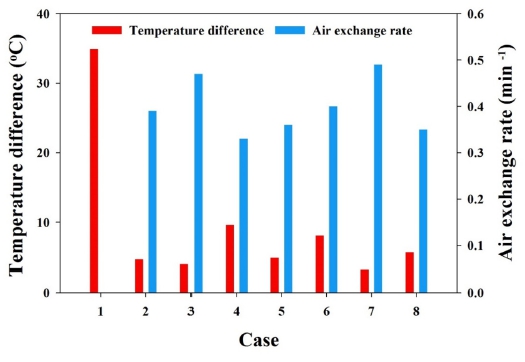
For better understanding, the results are presented and compared in Fig. 8 with respect to the inside-tooutside air temperature difference and air exchange rate of all the studied cases. It can be seen that case seven gothic-shaped (conical type vent) had a low inside-tooutside air temperature difference of 3.2°C and a high air exchange rate of 0.49min-1, higher exchange rate causes low air temperature differences. As it can be seen from the results that higher the air exchange rate results in lower the inside-to-outside air temperature difference. The descending order of air exchange rate for all cases was as follow; 7, 3, 6, 2, 5, and 8. Furthermore, these results revealed that case 6 had a higher air exchange rate than cases 2, 5, 8, and 4, but the inside-to-outside air temperature difference was higher than the ones in these cases because of evenroofed shape of the greenhouse, which leads to reaching a higher air temperature due to reception u more solar energy inside the greenhouse.
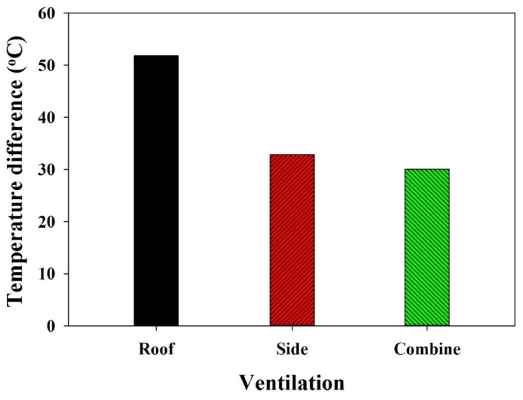
Further analysis was performed using the gothicshaped conical type roof vent greenhouse with different commonly used natural ventilation configurations which included: only roof-vent opening, only side-vent opening, and combined side and roof-vent openings. The results are illustrated in Fig. 9, in which the comparison can be seen of the internal air temperature of the greenhouse at a height of 1.2 m with different vent opening configurations. Our results revealed that, in the case of only side-vent opening, and combined vents opening conditions internal air temperature of the greenhouse was reduced to 32.4, 30.1°C. and in the only roof-vent opening greenhouse internal air temperature was very high 50°C (less reduction in internal air temperature) comparing other configurations. From the results obtained, we concluded that side vents contributed more to the natural ventilation of singlespan greenhouse, and the combined roof- and side-vent openings achieved the highest reduction in the air temperature.
Conclusion
The influence of buoyancy-driven natural ventilation of single-span greenhouses with different commonly used roof vent types were numerically investigated by using computational the fluid dynamic (CFD) code. The numerical model was first successfully validated against the experimental data. Further, the efficiencies of the different greenhouse roof vents types were assessed by observing the reduction in the internal air temperature and ventilation rate. Our results showed that, for all the cases studied in this study, the gothicshaped greenhouse with a conical type roof vent combination with side vents is the best as it achieved the lowest air temperature of 30.05°C and highest air exchange rate (0.49min-1). The results presented in this paper are from specific cases with the particular boundary conditions. Therefore, different results can be obtained in other cases and boundary conditions.
