Introduction
Materials and Methods
1. Samples
2. Statistical analysis
Results
1. Experiment 2 (time to pupa from larva)
2. Experiment 2 (time to imago from pupa)
3. Experiment 3
4. Combined results
Discussion
Introduction
Global climate change affects not only human life, but also crops and livestock. Lemonnier and Ainsworth (2018) reported that CO2 in the air would be changed from the current 420 ppmto 540 ppm in 2050, and the surface temperature would be elevated due to the greenhouse effect. The elevated temperature accelerates evapotranspiration, triggering soil salinization, and water deficit simultaneously which can result in declining crop productivity. The higher CO2 can improve C3 crop yield because although it makes photosynthesis more active, it can also reduce protein and minerals by 5-15% and vitamin B by up to 30% (Loladze, 2014; Myers et al., 2014; Zhu et al., 2018). The change in nutritional quality, more carbohydrates, and less minerals can ultimately affect livestock and human health (Loladze, 2002). For instance, C3 grains and tubers, such as rice, wheat, barley, and potatoes, have a 7-15% reduction in protein content (Myers et al., 2014). Moreover, as CO2 increases, the zinc content in plants decreases, and the number of zinc-deficient animals is predicted to increase (Myers et al., 2015).
In addition to the potential impact of climate change, the current trend of world population and urbanization hinders food security. Ritchie and Roser (2023) reported that the world population is expected to increase from the current 7.91 billion people to 9.71 billion in 2050 and 10.35 billion in 2100. According to the statistical data of FAO, however, the average protein supply is declining around the world (Miassi and Dossa, 2023). Tilman and Clark (2014) and Godfray et al. (2018) reported that the current animal protein consumption is not sustainable given the food demand and the projected population. Meanwhile, urbanization reduces farms for feed crop production and ranches for livestock production. Even if new farms and ranches are built, the agricultural system actively contributes to deforestation, water consumption, and CO2 emissions (Semba et al., 2021).
Entomophagy has been used as a nutritional source for both animal feed and food for humans. The edible insects contain protein, essential amino acids, minerals, and vitamins. Not only from the nutritional perspective but also from an environmental perspective, entomophagy might play a major role in protein sources. For instance, insects require less water (Miglietta et al., 2015) and arable land (Oonincx and Boer, 2012) and emit lower CO2 (Oonincx et al., 2010) than pigs, cattle, and poultry. Thus, entomophagy is more sustainable than the existing protein production system (Heckmann et al., 2018).
Mealworm (Tenebrio molitor) is well known as an edible insect. In general, the insects react sensitively to air temperature and relative humidity, and the environmental conditions for the mealworm are 20°C and 75% (Punzo and Mutchmor, 1980). To run a mealworm farm effectively, there are two main strategies to consider for farmers. The first strategy is to maintain the edible larval period to the maximum, and the second strategy is to produce as many adults as possible for reproduction. Since these two strategies may be naturally contradictory, it is hard to find environmental conditions that satisfy both strategies, and it may require more cost and space. One simple strategy, if it is effective, is to induce food competition among mealworms by changing the density of their habitat. Therefore, we performed an experimental study by controlling the density of mealworm habitat and the presence of food.
Materials and Methods
1. Samples
Mealworm larvae (Tenebrio molitor L) with a length of 2-3 cm were purchased from an insect farm, which specializes in mealworms, in South Korea. The larvae were grown in cylindrical containers with a dimension of 7 cm at the top, 5 cm at the bottom, and 3 cm in height. The temperature was maintained about 25°C, and the photoperiod was kept at 14 Light: 10 Dark (Kim et al., 2015; Punzo and Mutchmor, 1980). The relative humidity was maintained at about 60%. The containers were bedded with 1 g of wheat bran (Deen et al., 2021; Langston et al., 2023) and were labeled “F” if mealworms were fed and “S” if they were not fed. Mealworms were placed in the containers at densities of 1, 2, 5, 10, and 20 and were provided at 0.2 g of radish per larva in the F-labeled containers (Park et al., 2012; Kim et al., 2014). The mealworms that became pupae were immediately transferred to another container. Three experiments were performed. Experiment 1 was from July 19 to September 16, Experiment 2 was from September 23 to November 20, and Experiment 3 was from November 16 to December 16 in 2023. The treatment groups and number of containers are shown in Table 1.
Table 1.
The number of containers and the sample size in Experiment 1 (pilot study), Experiment 2 (main study), and Experiment 3 (repeated study).
2. Statistical analysis
The date of starting the experiment, the date of transforming to pupa, and the date of transforming to imago were recorded for each mealworm. Using these records, the time to pupa and the time to imago from pupa were calculated. Some mealworms were censored (i.e., did not become a pupa or an imago) because they died in the middle of the test or did not become a pupa or an imago until the end of the experiment. To account for the censored data, survival analysis was performed (Klein and Moeschberger, 2003). There were two experimental factors of interest, food and density. There were two levels of food, fed or not, and there were five levels of density: 1, 2, 5, 10, or 20 mealworms per container of the same size. The time to each phase was visualized using the Kaplan-Meyer estimator, and the effects of the two factors, food and density, were estimated using the Cox proportional-hazards model.
For the statistical model, we let X = 1 if a mealworm was fed and X = 0 if not fed (the reference level of the food group). To indicate the five density levels, four dummy variables were defined as follows: D2 = 1 if two mealworms were in the container (D2 = 0 otherwise); D5 = 1 if five mealworms were in the container (D5 = 0 otherwise); D10 = 1 if ten mealworms were in the container (D10 = 0 otherwise); and D20 = 1 if twenty mealworms were in the container (D20 = 0 otherwise). That is, D2 = D5 = D10 = D20 = 0 if only one mealworm was in the container alone (the reference level of the density group). Given these notations, the Cox proportional-hazards model was specified as follows:
λ(t|X, D) = λ0 (t) exp(β1 X + β2 D2 + β3 D5 + β4 D10 + β5 D20)
The parameters of interest (β1, β2, β3, β4, and β5) were estimated using the survival package in R (Therneau and Grambsch, 2000; Therneau, 2023). Under the model assumption, exp(β1) is the ratio of the likelihood of the transformation to the next phase (to pupa or from pupa to imago) at any time when the F group is compared to the S group of the same density; exp(β2) is the ratio when the group of 2 per container and the group of 1 per container (the reference group) are compared given the same food condition; exp(β3) is the ratio when the group of 5 per container and the reference group are compared given the same food condition; and so on. The model assumption of proportional- hazards was tested using the Schoenfeld residuals (Grambsch and Therneau, 1994). All statistical analyses were performed in R version 4.3.0 (R Core Team, 2023).
Results
An expected power outage occurred during Experiment 1, and it was regarded as a pilot experiment in this study. The main experiment, referred to as Experiment 2, allowed us to estimate both the effect of food and density. The results of Experiment 2 associated with the transformation to pupa from larva are reported in Section 3.1, and the results of Experiment 2 associated with the transformation to image from pupa are reported in Section 3.2. Given the remaining resources, we could repeat the experiment without food, referred to as Experiment 3, and the results of Experiment 3 are reported in Section 3.3. All combined results are summarized in Section 4.
1. Experiment 2 (time to pupa from larva)
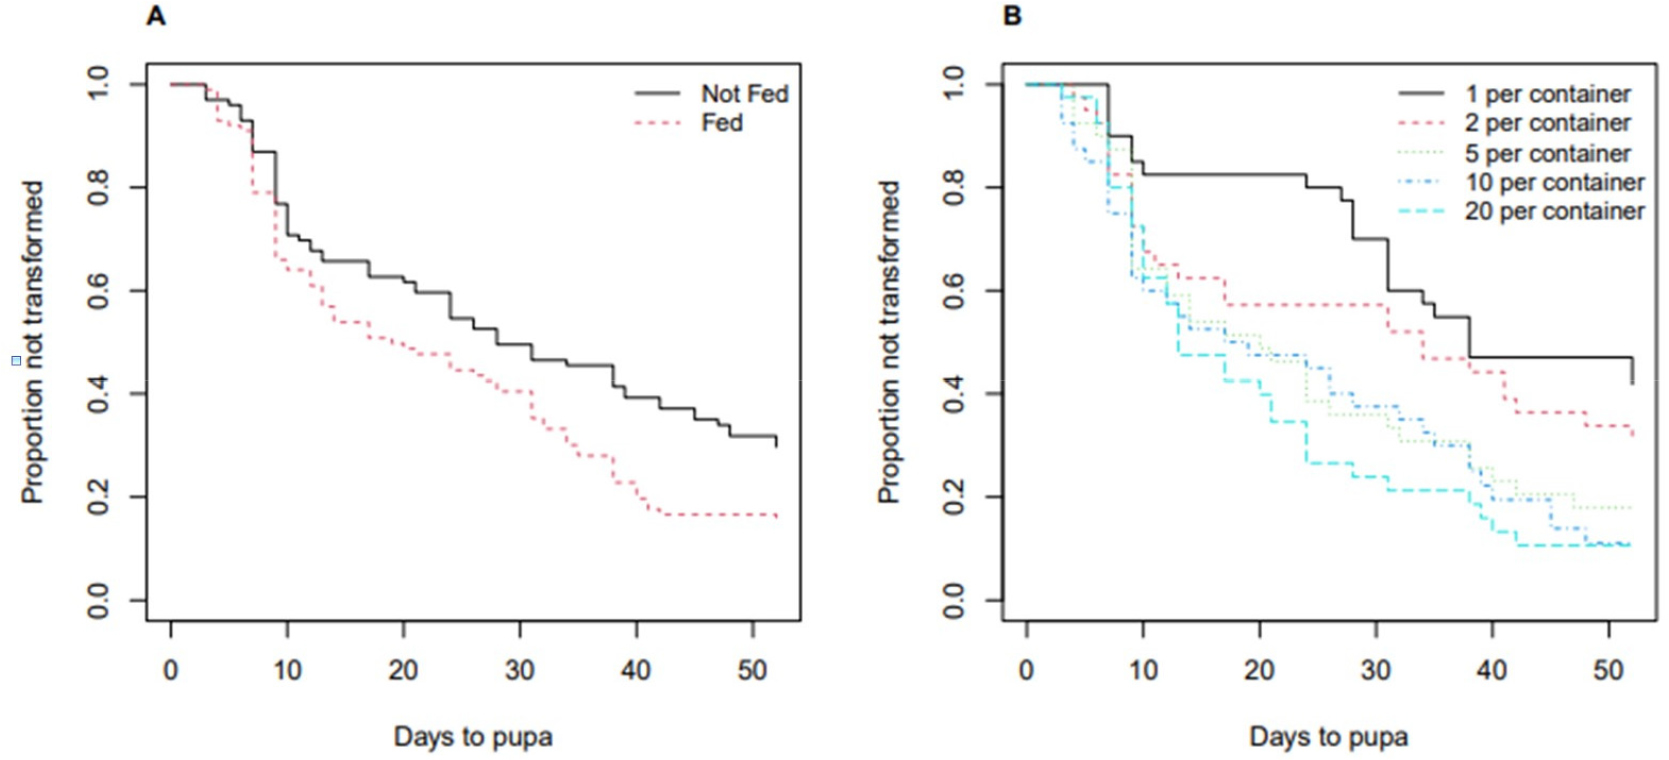
Among the 200 mealworms, 152 mealworms transformed to pupa, and the remaining 48 mealworms did not transform to pupa until the end of observation or died before the end of the test. As shown in the left panel of Fig. 1, the median survival time was 19 days for the group with food and 28 days for the group without food. Under the Cox proportional-hazards model, at any time point before transforming to pupa, a mealworm with food is 1.56 times more likely to transform to pupa than a mealworm without food given the same density (p = 0.007). The right panel of Fig. 1 shows that the group of mealworms in the container of a higher density transformed to pupa faster when compared to those of a lower density. Under the Cox model, when the group of 20 mealworms per container is compared to the group of one mealworm per container (the reference group) given the same food condition, the group of 20 mealworms per container is 2.80 times more likely to transform to pupa (p < 0.001). Relative to the reference, given the same food condition, the group of 10 mealworms per container was statistically significant (2.47 times; p < 0.001), the group of 5 mealworms per container was statistically significant as well (2.13 times; p = 0.005), and the group of 2 mealworms per container was not statistically significant (1.41 times; p = 0.222) as reported in Table 2. The Cox proportional-hazards assumption was assessed, and the data supported the model assumption (p = 0.75).
Table 2.
Results of the Cox proportional-hazards model (Experiment 2; transformation to pupa).
2. Experiment 2 (time to imago from pupa)
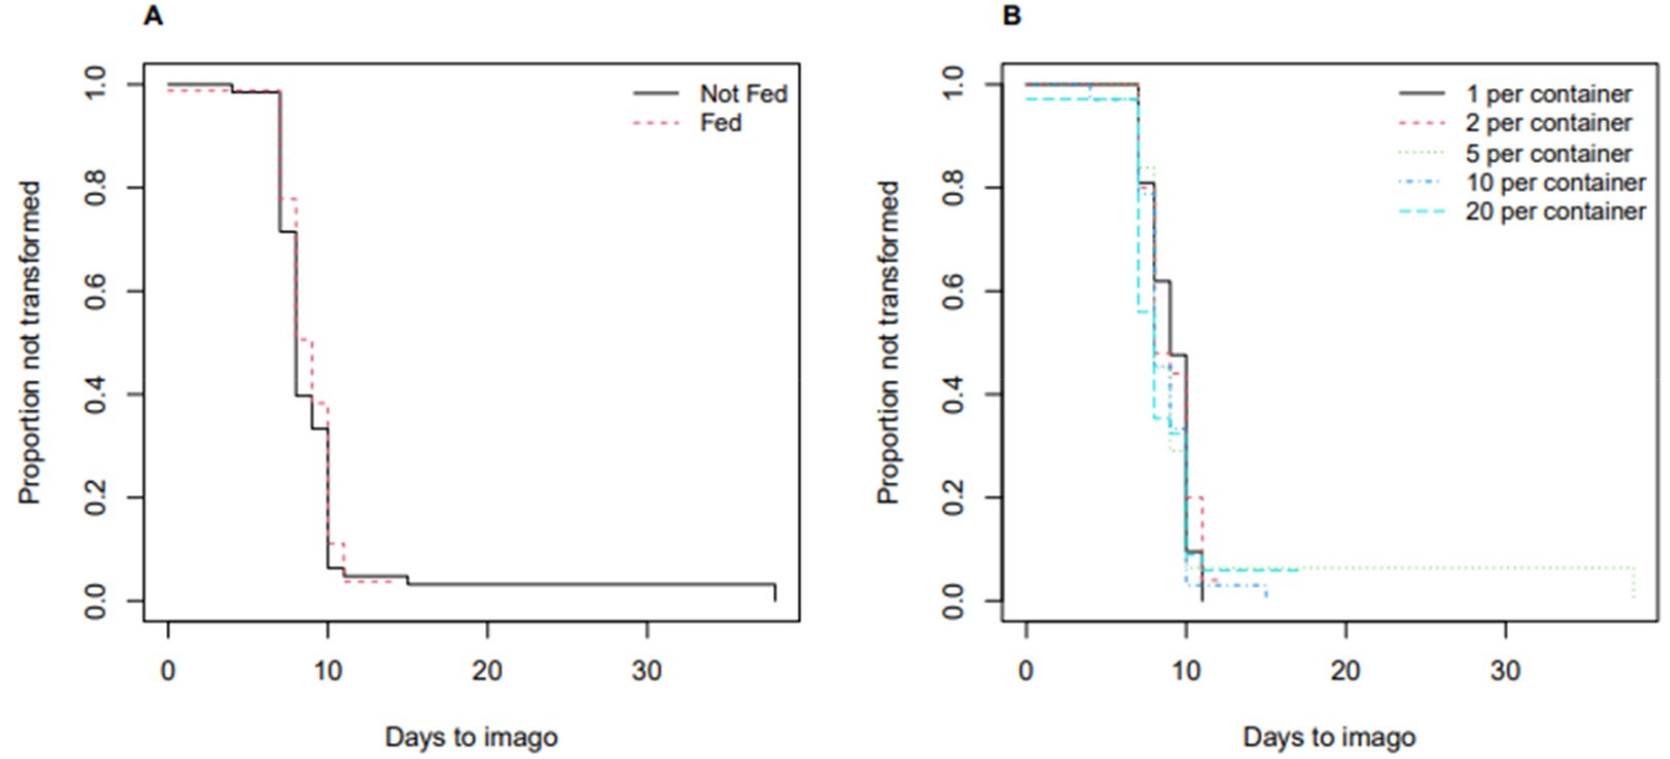
Among the 152 mealworms that had transformed into a pupa, 140 pupae had then metamorphosed into imago. The remaining 12 pupae either died or did not transform into imago before the end of the experiment. Overall, the effect of food and density on the transformation to imago was not as drastic as on the transformation to pupa. Using the Cox proportional hazard model, there was no statistically significant effect of food or density. When the group of pupae fed was compared to the group of pupae not fed, given the same density of container, the likelihood of transforming into imago was 0.8 times at any time of the imago stage, and it was not statistically significant (p = 0.508). On the left panel of Fig. 2, the estimated median transformation time was 8 and 9 days for the group fed and the group not fed. Likewise, the estimated median transformation time was 8 and 9 days for all five density groups (1, 2, 5, 10, and 20 pupae per container) as shown in the right panel of Fig. 2. When compared to the reference density group (1 per container), the effect of higher density was not statistically significant as reported in Table 3. There was no strong evidence of violating the proportional-hazards assumption (p = 0.073).
Table 3.
Results of the Cox proportional-hazards model (Experiment 2; transformation to imago).
| Estimate | 95% CI | p-value | |
| exp(β1) | 0.890 | (0.631, 1.256) | 0.508 |
| exp(β2) | 0.932 | (0.516, 1.683) | 0.814 |
| exp(β3) | 1.104 | (0.628, 1.941) | 0.732 |
| exp(β4) | 1.257 | (0.727, 2.176) | 0.413 |
| exp(β5) | 1.250 | (0.719, 2.170) | 0.429 |
Table 4.
Results of the Cox proportional-hazards model (Experiment 3; all mealworms not fed).
3. Experiment 3
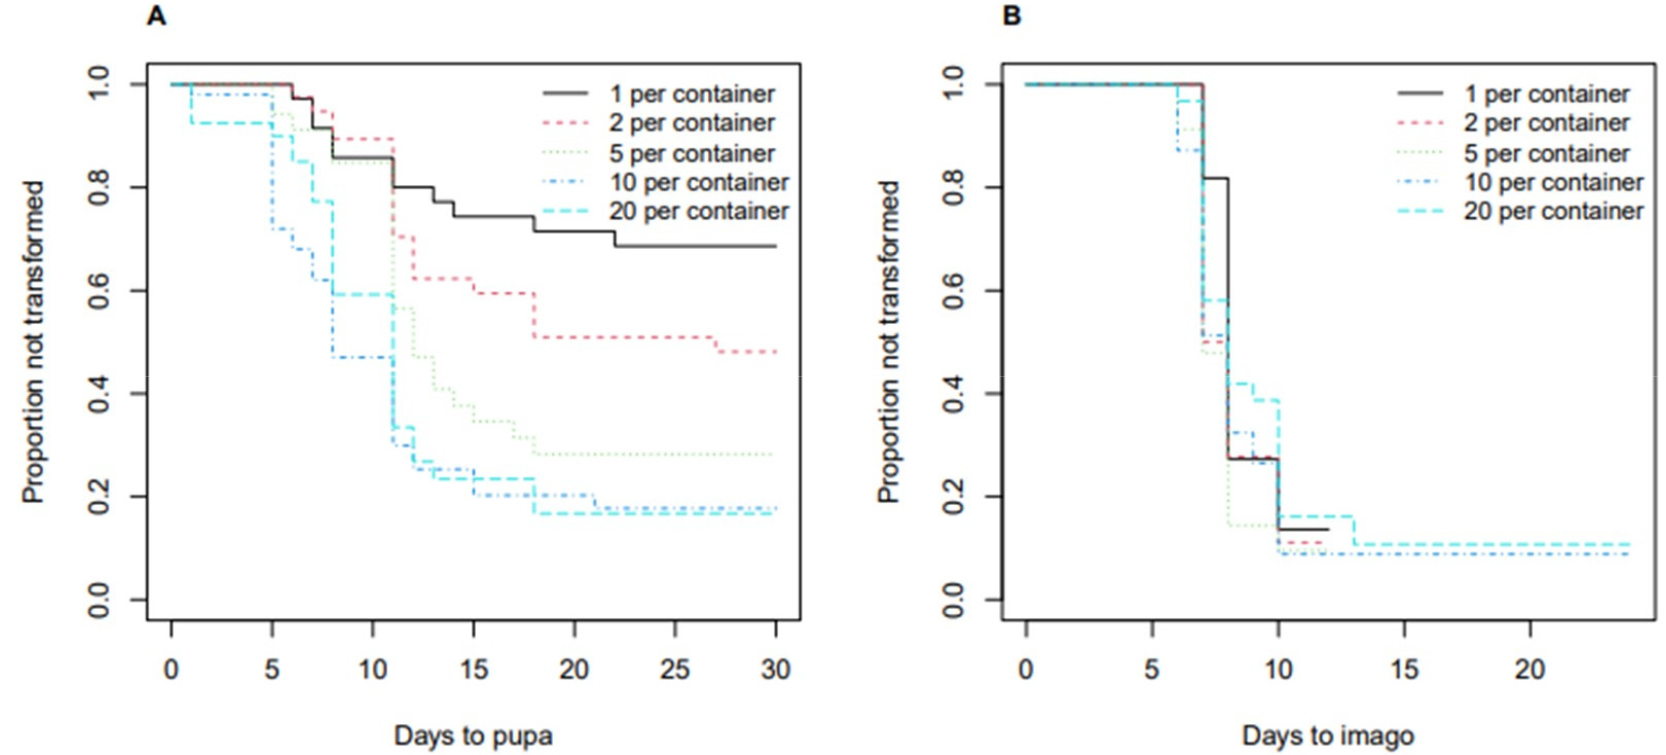
The experiment was repeated to replicate the observed pattern. In this experiment, where all mealworms were not fed, 201 mealworms that were not fed, 123 out of the 201 mealworms transformed to pupa before the end of observation, and 106 out of the 123 pupae transformed to imago before the end of observation. Table 4 and Fig. 3 show that the time to transformation to pupa was significantly different with respect to the density group (Fig. 3A), but the time to transformation to imago was not (Fig. 3B). The time to transformation to pupa observed in this repeated experiment was consistent with the previous experiment. Especially, the two highest density groups (20 and 10 per container) had similar time to transformation to pupa.
4. Combined results
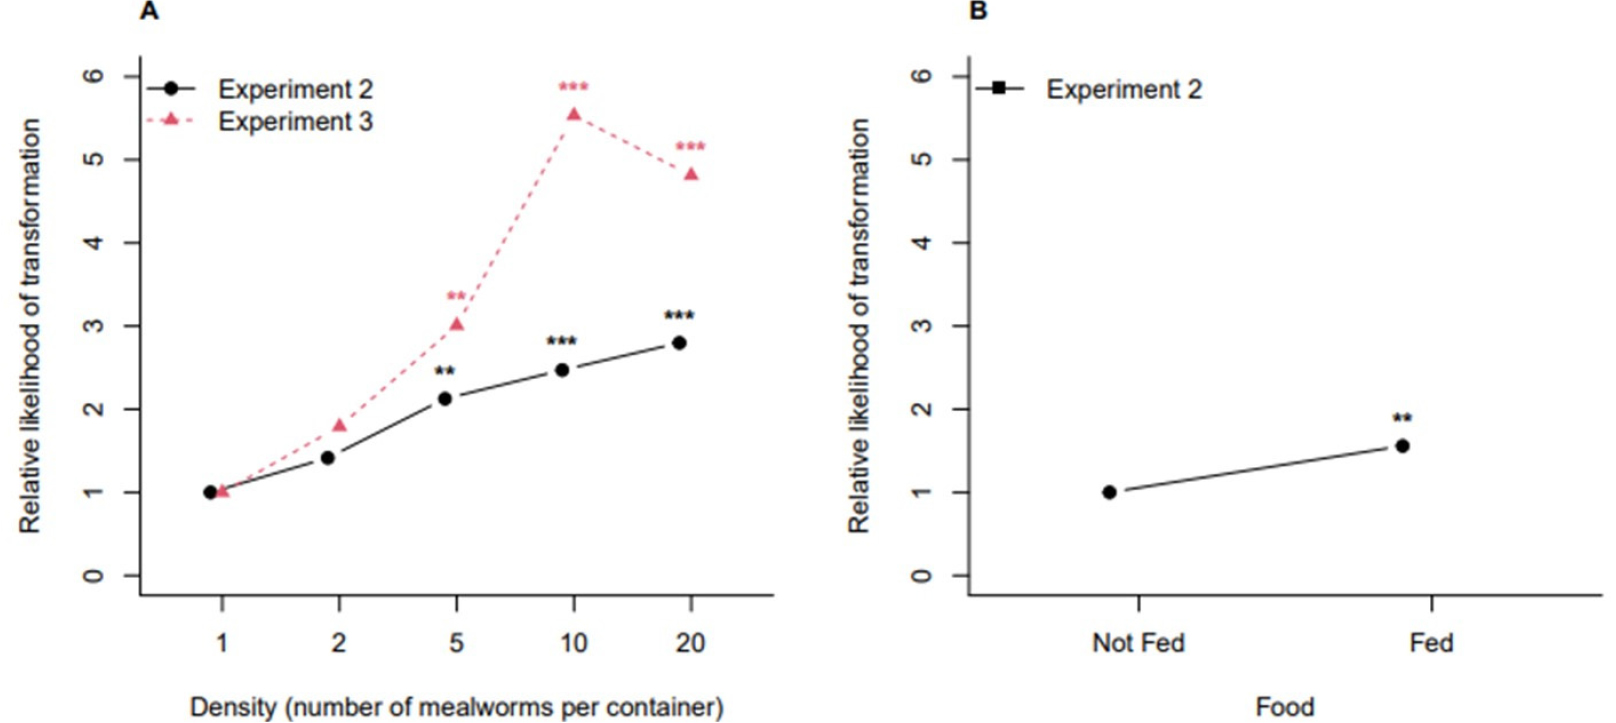
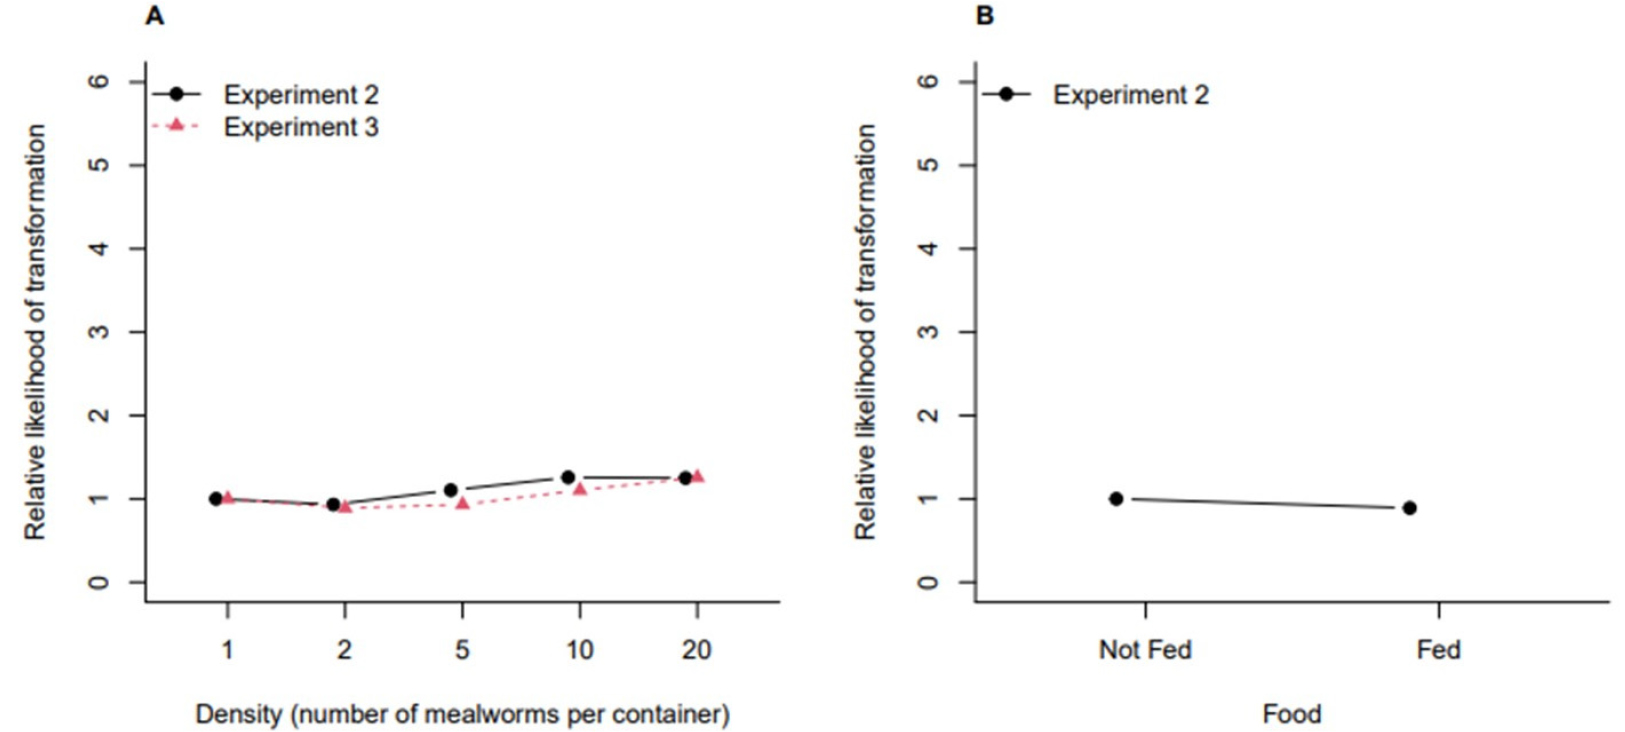
Fig. 4 shows the estimated relative likelihood of transformation to pupa from Experiment 2 (the main study) and Experiment 3 (the experiment for replication). The observed trends are similar between the two experiments that the transformation to pupa tends to be faster at high density groups. Given the density group, in Experiment 2, we could observe that food accelerated the transformation to pupa. Fig. 5 shows the estimated relative likelihood of transformation to imago from Experiment 2 and Experiment 3. The trend with respect to density is constant (i.e., no effect of density), and food does not seem to be effective on the time to the transformation to imago.
Discussion
High population density can be a stressor for animals. Higher population density of chickens caused pecking themselves, resulting in poor coat condition (Hofmann et al., 2021), and higher population density of pigs increased the tendency to attackother pigs (Hwang et al., 2019). Lee et al. (2023) found that flounder had an increased deformity rate at higher population density. Our study also showed that rapid pupation occurs as larval population density increases. This means that as the population density increases, the larvae may also experience stress which results in a decrease in development time.
In terms of insect development, larvae of some fly species, Calliphora vicina, have reduced development times at high population density (Saunders and Bee, 1995). Previous studies reported that the geometric moth (Välimäki et al., (2013) and the tropical butterfly Bicyclus anynana (Bauerfeind and Fischer, 2005) also had a shortened developmental time by high density. However, in the case of mosquitoes (Agnew et al., 2002; Gimnig et al., 2002; Muriu et al., 2013) and flies (Diamantidis et al., 2020; Henry et al., 2018), there was a significant tendency for development times to be delayed as the larval population density increased.
Coleoptera and Lepidoptera had inconsistent development times across population density. For the Zophobas atratus Fab species, higher density has been delayed development times (Quennedey et al., 1995). Gibbs et al. (2004) found the same developmental delay response among Lepidoptera species. The same response was found in the studies using the Tenebrio molitor (Connat et al., 1991). However, the environmental conditions of the Connat’s study were different from our experiments. Connat conducted the study using 9.9 cm2 sized containers, which is approximately 10 times greater than the 0.95 cm2 containers in our experiments. On the other hands, in the other Tenebrio molitor studies, population density did not result in significant differences in pupal stage times (Weaver and McFarlane, 1990). Therefore, the materials (container size) could be an effect modifier in the relationship between larval population density and development stage. In the scope of our experimental settings, however, we have observed the consistent pattern that higher density accelerated the transformation to pupa but not to imago.
At high population density, feeding efficiency might have been reduced, leading to lack of nutrients. Morales-Ramos and Rojas (2015) fed a constant amount of food per Tenebrio molitor larva, but as the population density increased, food consumption and individual larval weight decreased. It may be due to 20-hydroxyendisone (20E), which induces lipolysis and pupalization (Riddiford, 2020; Liu et al., 2015). Terashima et al. (2005) reported that starvation in Drosophila melanogaster increases 20E concentration due to lack of nutrients. It is potentially associated with the time of development stage, and the potential causal paths needs to be proven in future study.


