

Introduction
Internal environments of greenhouse are continuously influenced by the outside environmental conditions (Suseela and Rangaswami, 2012). Recently, Korean smart greenhouses have been constructed in Abu Dhabi of the United Arab Emirates (UAE) at 2022, in Mongol at 2024, and the Queensland of Australia at 2024 on the purpose of expanding the exports of smart-farm technologies.
The UAE has 104,397 ha of agricultural area, accounting for only about 1.2% of the total land, and depends on imports for 85% of the total food consumed. To overcome this constrict, the ‘National Food Security Strategy 2051’ has been established to launch a sustainable food production system using agricultural technologies (Al-Qodsi et al., 2024). For Mongol, because of the recent increase in the demand for fresh vegetables, the supply of smart greenhouses and technologies is required. When the Mongolian Vegetable Project launched in 2004, vegetables were grown on 7,600 hectares, and farmers harvested 72 tons of crops. As of fall 2023, the land of Mongol used for vegetable farming has increased by 60 percent to 12,600 hectares (MNA, 2023). Recently, our research team investigated the weather conditions in the northern regions, including Mongol to develop a northern smart greenhouse model (Choi et al., 2023a). Greenhouse areas in Australia was estimated to be around 1,300 ha, with high-tech and low-/medium-tech greenhouses accounting for 17 and 83% of this area, respectively (Smith, 2020). The estimated greenhouse vegetable production area is highest for South Australia (580 ha), followed by New South Wales (500 ha) and Victoria (200 ha), while Queensland, Western Australia and Tasmania account for <50 ha each (Chavan et al., 2022). Protected cropping is a fastest-growing food production system in Australia, although significant challenges owing to high labor costs, resulting in a requirement for higher yields through the year-round supply of high- quality fruits.
According to the National Center of Meteorology of Abu Dhabi (NCM, 2024), average air temperature is 20.3 (Jan.), 21.2 (Feb.), 23.8 (Mar.), 27.5 (Apr.), 31.2 (May), 33.2 (Jun.), 35.0 (Jul.), 35.5 (Aug.), 33.7 (Sept.), 30.9 (Oct.), 27.0 (Nov.), and 22.7℃ (Dec.) with higher temperature than 40℃ from March to October and the highest temperature in July (47.9℃) and August (48.0℃). Its rainfall is 10.5 (Jan.), 3.4 (Feb.), 10.0 (Mar.), 5.6 (Apr.), 0 (May), 0 (Jun.), 0.2 (Jul.), 0 (Aug.), 0 (Sept.), 0.6 (Oct.), 2.7 (Nov.), and 10.7 mm (Dec.) with 80% of the rainfall in December to March. The historical air temperature data from 20 weather stations covering the entire UAE and the average of three climate change models based on the global circulation models revealed that the average air temperature will vary between 1°C and 2.8°C for the near future, and (1.9°C to 4.15°C) for the far future (Ashour et al., 2022).
According to world meteorological organization (WMO, 2024), average maximum and minimum of air temperature in the Mongolia (Ulaanbaatar) is -15.5 and -26.1 (Jan.), -9.6 and -22.3 (Feb.), -0.6 and -13.6 (Mar.), 9.7 and -4.4 (Apr.), 17.9 and 3.2 (May), 22.7 and 9.5 (Jun.), 24.6 and 12.7 (Jul.), 22.4 and 10.5 (Aug.), 16.8 and 3.5 (Sept.), 7.7 and -4.8 (Oct.), -4.8 and -15.7 (Nov.), and -13.5 and -23.1 (Dec.), respectively, indicating temperatures are highest in July and lowest in January with an average RH in the range of 47-73%, and this short summers allow vegetable cultivation in open field for four months from June to September. Its rainfall is 2.6 (Jan.), 2.6 (Feb.), 4.10 (Mar.), 7.50 (Apr.), 19.8 (May), 48.7 (Jun.), 67.8 (Jul.), 71.7 (Aug.), 27.8 (Sept.), 8.30 (Oct.), 5.00 (Nov.), and 3.70 mm (Dec.). Although the sunshine duration at Dalanzadgad in Mongolia is 2,836 hours per year during June and August (Choi et al., 2023a), the cucumber production per unit area is about 1.0 kg·m-2 (FAOSTAT, 2024). It may be due to a lower temperature climate.
According to the Bureau of Meteorology in Australia (BoM, 2024), average maximum and minimum of air temperature in the Queensland is 29.9 and 20.6 (Jan.), 29.5 and 20.6 (Feb.), 28.6 and 19.3 (Mar.), 26.5 and 16.2 (Apr.), 24.0 and 12.8 (May), 21.7 and 10.2 (Jun.), 21.6 and 9.0 (Jul.), 22.9 and 9.6 (Aug.), 25.2 and 12.6 (Sept.), 26.6 and 15.1 (Oct.), 28.0 and 17.5 (Nov.), and 29.1 and 19.3℃ (Dec.), respectively. Its rainfall is 126 (Jan.), 168 (Feb.), 139 (Mar.), 78.3 (Apr.), 103 (May), 68.6 (Jun.), 36.8 (Jul.), 40.6 (Aug.), 39.8 (Sept.), 76.7 (Oct.), 101 (Nov.), and 137 mm (Dec.). Recent rainfall deficiency areas extended further inland in the south-west of Western Australia but reduced in intensity in some parts of coastal South Australia and Victoria (BoM, 2024). Recent droughts across eastern Australia adversely affected farm businesses (Chavan et al., 2022).
Climate-smart greenhouses use advanced technologies to optimize plant growth and reduce environmental impact. This study aims to compare the environmental characteristics in Korean smart greenhouses built in different climate regions, Mongol, UAE (Abu Dhabi) and Australia (Queensland) during the hottest season in order to develop implementable strategies.
Materials and Methods
1. Plant Growth Conditions
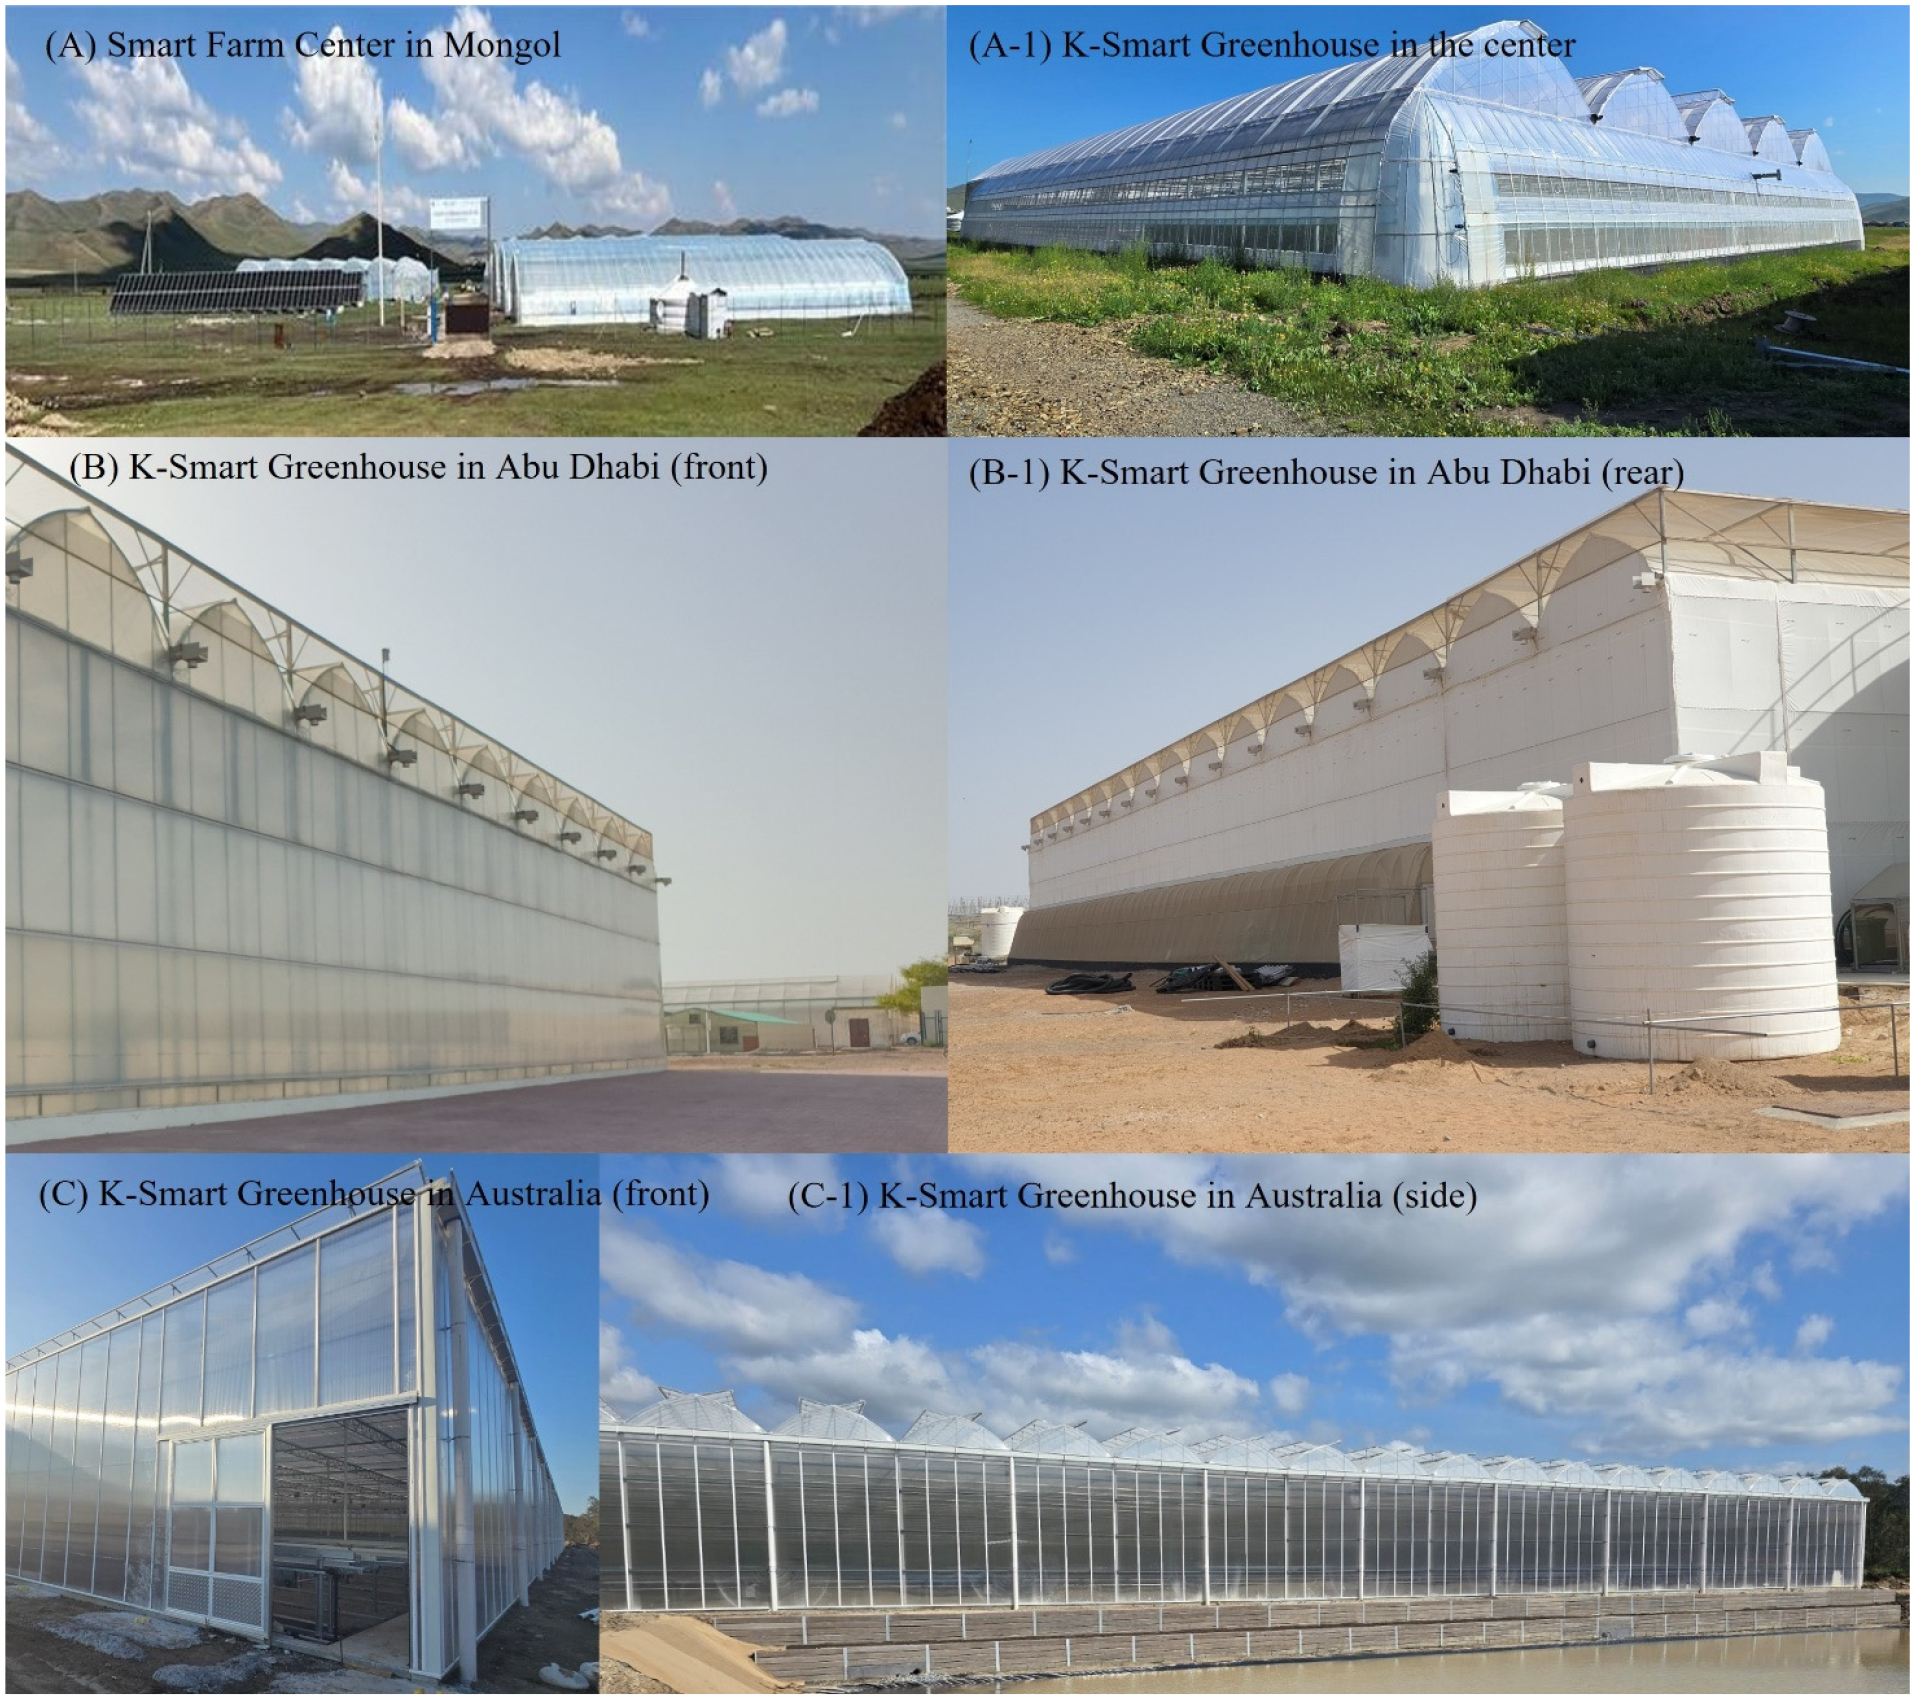
The experiment in Mongol was conducted in a Korean smart greenhouse (NMH-8: area: 2,240 m2, 40 m (W) × 56 m (L) × 7.4 m (H), coating material: Polyolefin (PO) Film) located in the Smart Farm Center (Ar gunt, Burhanta, Mongolia (48°06'14.9"N 106°38'49.7"E)) in Mongolian University of Life Sciences (Fig. 1. A, A-1). The data of environmental parameters and equations (Eq. 1 to 3) (Choi et al., 2023b) were used from the May to September of 2024 to obtain vapor pressure deficit (VPD), absolute humidity (AH), enthalpy and ventilation rate (Vent)). Tested plants were the 390 seedlings of tomato (Solanum lycopersicun L., ‘Dotaerang Season’) and the 157 and 50 cucumber seedlings of long-fruited variety, ‘Borja’ and ‘Neth. King (Enza Zaden, Enkhuizen, Netherland), respectively, and the 174 and 242 seedlings of medium-fruited variety ‘Espero’ (Agrius&Veles Agro LLC Channel, Tashkent, Uzbekistan) and ‘Zeco’ (Enza Zaden Co., Enkhuizen, Netherlands), respectively. Twelve hydroponic coir slabs per variety were used in a completely randomed design, placing for 3 plants on each slab [100 × 20 × 10 cm, BioGrow, dust:chip = 50:50 (v:v)]. For the environmental control, ventilation through the side and roof window (half of the roof was retractable and acted as a roof vent) and sunblock screen were controlled by an integrated environmental control system (Smart Root System, ISU System, Queensland, Australia).
The experiment in Abu Dhabi was conducted in a Korean semi-closed greenhouse (latitude: 24.207500, longitude: 55.744720, area: 2,070 m2, W: 60 m × L: 34.5 m × H: 5.7 m, PO film) located in ADFSA (Abu Dhabi Agriculture and Food Safety Authority) in UAE from the 20th of July, 2022 to 10th of October, 2022 (Fig. 1. B, B-1). The semi-closed greenhouse was equipped with a fogging system, a Fan Coil Unit (FCU, SM-Tech, Kyunggi-do, Korea) system and sunblock screen were controlled by an integrated environmental control system (MAGMA+, Green Control System Ltd., Gwangju, Korea). Four seedlings of European medium-sized cucumber (Cucumis sativus cv. ‘Zeco’ & ‘Nagene’) on the rockwool cube were planted on a coir slab (100 × 20 × 10 cm, BIO GROW, dust:chip = 50:50 (v:v)) on July 20, 2022. The data of environmental parameters and equations (Eq. 1 to 3) were used from the June to September of 2022.
The experiment in Australia was conducted in a Korean smart greenhouse (total area:9,984 m2, W: 96 m × L:104 m × H: 6.99 m, side: double-layered Polycarbonate (PC), roof: Polyolefin (PO) film) located in Luscombe, Queensland, Australia (Fig. 1. C, C-1). About 10,000 seedlings of European lettuce, ‘Kireve’, ‘Andiron’, ‘Vindicate’ and ‘Stronex’ (Rijk Zwaan Pty Ldt., Victoria, Australia) grown on rockwool trays were transplanted to NFT system in November, 2024.
The data of environmental parameters and equations (Eq. 1 to 3) were used from the November to December of 2024. For the environmental control, ventilation through the side and roof window (half of the roof was retractable and acted as a roof vent) and sunblock screen were controlled by an integrated environmental control system (Smart Root System, ISU System, Seoul, Korea).
2. Equations
Results and Discussion
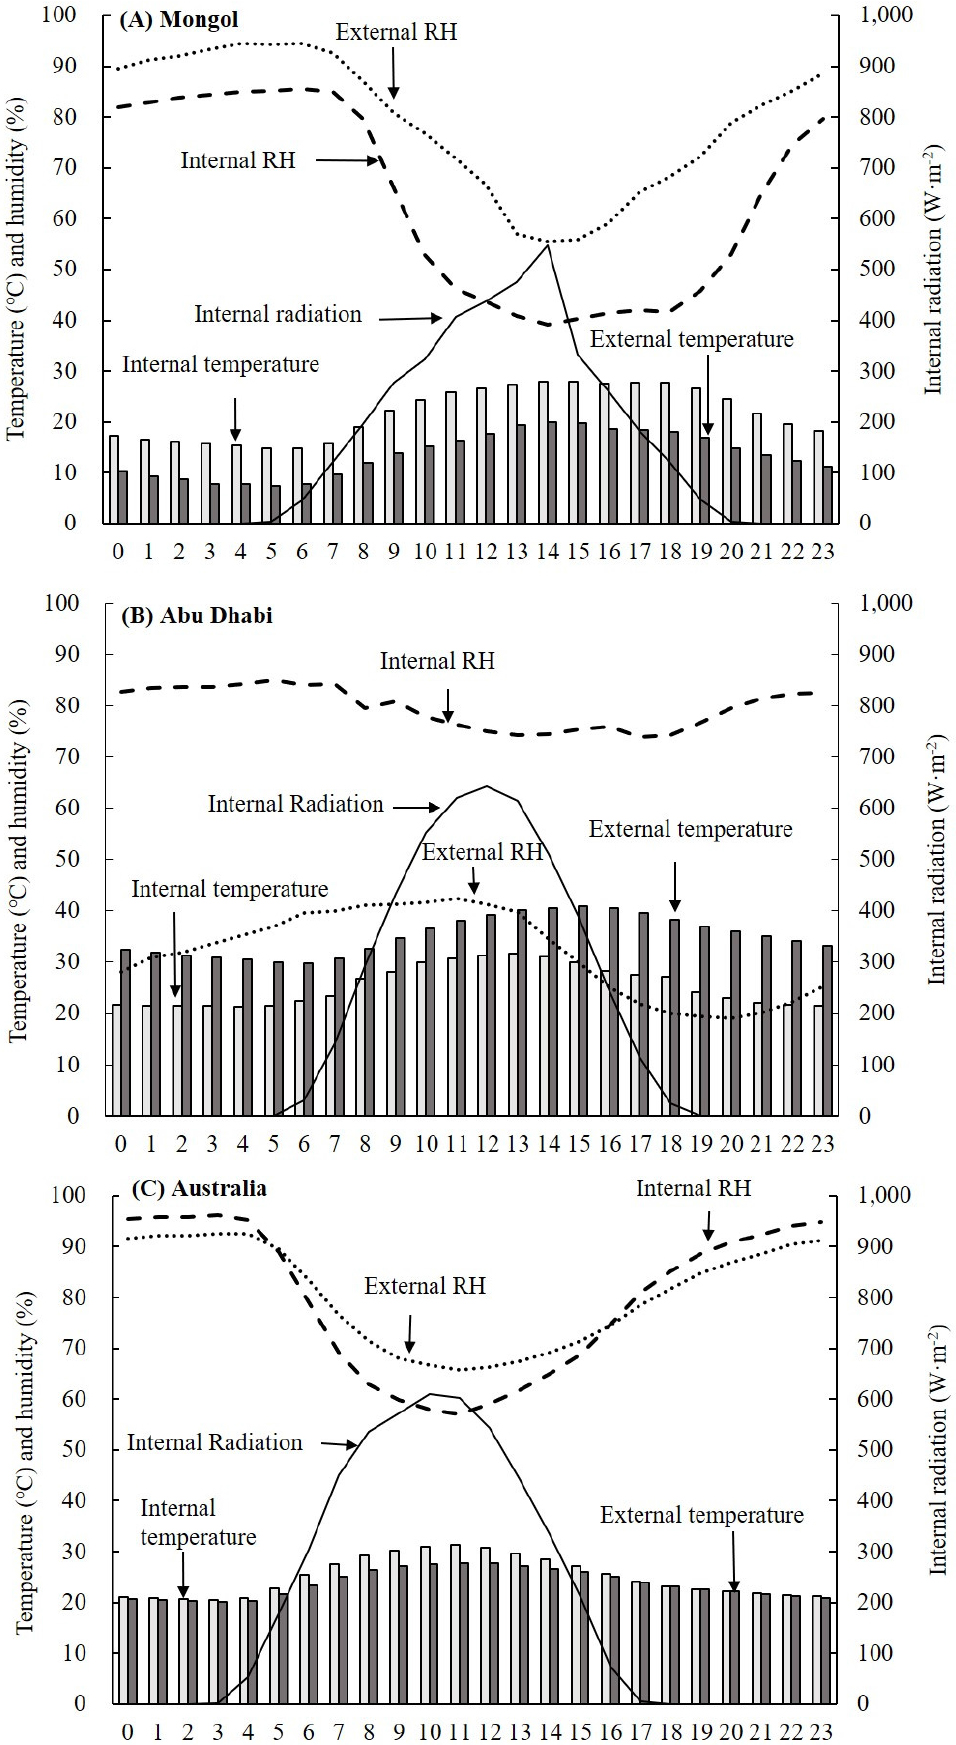
For the greenhouse in Mongol, the highest temperature in the internal air was 28℃ in average, while it was 20℃ in the external air with the difference between 6.1 and 9.9℃. The internal RH was decreased to 39.1%, which was about 16% lower than that of external (55.5%). The internal radiation was risen to 120 w·m-2 at 7 a.m. and its highest level was 547 w·m-2 at 14:00 and decreased to 121 w·m-2 at 18:00 (Fig. 2A). For the greenhouse in Abu Dhabi, the highest temperature in the internal air was 31.6℃ in average, while it was 40.9℃ in the external air with the difference between 5.9 and 13℃. The internal RH was decreased to 74.2%, which was about 34.5% higher than that of external (39.7%). The internal radiation was risen to 142 w·m-2 at 7 a.m. and its highest level was 643 w·m-2 at 12:00 and decreased to 115 w·m-2 at 17:00 (Fig. 2B). For the greenhouse in Queensland, the highest temperature in the internal air was 32.2℃ in average at 11:00, while it was 28.4℃ in the external air with the difference between 0 and 3.81℃. The internal RH was decreased to 59.4%, which was about 8.9% lower than that of external (68.3%). The internal radiation was risen to 189 w·m-2 at 5:00, and its highest level was 619 w·m-2 at 10:00 and decreased to 91.8 w·m-2 at 16:00 (Fig. 2C).
During the hottest season (July) of Mongol, the temperature difference between the internal and external greenhouse was from 6.1 to 9.9℃ with a lower external temperature (Table 1). During the daytime when the intensity of radiation increases, the internal temperature increases, while the internal AH decreases with the increase of VPD by 23 mbar. The external temperature increases to 20℃ and the VPD increases to 10.43 mbar. The calculated ventilation rate (Geelen et al., 2018) tended to increase during the daytime when the enthalpy difference between the internal and external was decreased (Table 1).
Table 1.
Hourly average of internal and external temperature (DT), vapor pressure deficit (VPD), absolute humidity (AH), enthalpy amd ventilation rate (Vent.) in a Korean smart greenhouse located in Mongol during July at 2024.
During the hottest season (August) in Abu Dhabi, the average temperature of semi-closed greenhouse was lower about 7 to 10℃ from 10 a.m. to 14 p.m. than that of external temperature. The external temperature was increased to 40.86℃, while the internal temperature was increased to 31.6℃ (Table 2). The internal VPD (12 mbar) was 4.6-fold lower than that of external VPD (56 mbar), which is related to the operation of a fog system. The calculated ventilation rate was increased according to the decrease in enthalpy difference between internal and external (Table 2).
Table 2.
Hourly average of internal and external temperature (DT), vapor pressure deficit (VPD), absolute humidity (AH), enthalpy amd ventilation rate (Vent) in a Korean smart greenhouse located in Abu Dhahi during August at 2022.
During the hottest season (December) in the Australia (Queensland), the internal temperature was higher about 3.81℃ than the external temperature at 11 a.m., while it was slightly lower or similar to that of the external from 6 pm to 4 am. During the daytime, the internal enthalpy and VPD was higher than that of external. The ventilation rate tended to increase accodring to the increase in the enthalpy difference in the internal and external, showing opposite results from the other two regions (Table 3).
Table 3.
Hourly average of internal and external temperature (DT), vapor pressure deficit (VPD), absolute humidity (AH), enthalpy amd ventilation rate (Vent) in a Korean smart greenhouse located in Australia (Queensland) during December at 2024.
For the greenhouses in both Mongol and Abu Dhabi, the ventilation rate was increased accoring to the decreae in the enthalpy difference between the internal and external. In the greenhouse of Abu Dhabi, a great reduction of internal temperature and VPD compared to that of external indicates that the dry and desert environment benefits from evaporative cooling, such as fogging systems with a potential reduction of greenhouse energy requirements (Ghoulem et al., 2019). These results suggest that the the ventilation is associated with lowering enthalpy, while for lowering VPD, a fog system is essential equipment as the greenhouse in Abu Dhabi had a much lower internal VPD. The heat exhaust by the fans is found by multiplying the difference in air enthalpy by the ventilation capacity of the fan, as the enthalpy of the air depends on the temperature and moisture content (Geelen et al., 2018). Villarreal-Guerrero et al. (2020) uses a set point of air specific enthalpy (55.8 kJ kg-1) to control the heaters and vents while a set point of VPD of 1.0 kPa is used to control the fogging system.
These results suggested that automated fogging, ventilation or heating systems on the base of enthalpy and VPD are necessary to effectively control appropriate climate conditions for plant growth. Greenhouse systems provide a solution for growing crops under varied climate conditions, although to what degree a possible change of climate affects energy and electrical requirements of greenhouse systems remains unclear. Also, it is necessary to disaster-proof greenhouse design since we often meet with sudden weather changes, such as hailston due to the climate changes. Korean technology for protected cropping would be further developed based on these information and can be shared with other countries for customizing smart greenhouse.
