


Introduction
Materials and Methods
1. Plant materials
2. Destructive measurement of seedling growth
3. Image acquisition and image-based growth measurements
4. Calculation of seedling quality indices
5. Statistical analysis
Results
1. Growth characteristics of shipping stage tomato seedlings from commercial nurseries
2. Linear relationships between destructive and image-based measurements
3. Differences in morphological characteristics of shipping stage tomato seedlings among commercial nurseries
4. Evaluation of shoot growth and seedling quality indices using image-based plant height and leaf area
Discussion
1. Growth variation and the need for quality evaluation of shipping stage tomato seedlings from commercial nurseries
2. Applicability of image-based plant height and leaf area measurements
3. Applicability of image-based plant height and leaf area for the evaluation of shoot fresh weight and dry weight
4. Limitations of image-based evaluation of CI and SQ
Conclusions
Introduction
Tomato (Solanum lycopersicum L.) is one of the most widely cultivated vegetable crops worldwide and an important fruit vegetable crop in Korea (Jeong et al. 2021). Most farmers in Korea purchase seedlings produced by commercial nurseries for transplanting rather than producing their own seedlings (Ban et al. 2023), and the number of commercial nurseries and the volume of seedlings supplied have continued to increase in recent years (KOSIS 2024a, b). As seedling production and supply through commercial nurseries continue to increase, the importance of quality management for seedlings at the shipping stage is also increasing.
Seedlings at the shipping stage are supplied to growers immediately before transplanting, and their quality can affect early growth after transplanting (Gallegos-Cedillo et al. 2024; Ha et al. 2024). If seedling quality is not uniform or growth is poor at this stage, delayed establishment, reduced early growth, and growth differences among plants may occur after transplanting (Ban et al. 2023), and differences in initial quality indices can lead to differences in stem diameter and yield (Nkurunziza et al. 2022). However, seedling quality evaluation in commercial nurseries often depends on visual assessment and evaluator experience, so the results may differ among evaluators and may not fully reflect seedling vigor and growth potential (Geneve and Kester 2001). Seedling quality should therefore be evaluated using both morphological characteristics and growth status (Grossnickle and MacDonald 2018). However, general growth traits such as fresh weight and dry weight require destructive measurements and may result in seedling loss. Therefore, objective, quantitative, and non-destructive evaluation criteria that can be applied in commercial nurseries are needed for stable quality management of seedlings at the shipping stage (Currey et al. 2013).
Quantitative evaluation of seedling morphological characteristics and growth at the shipping stage is important for predicting growth after transplanting and managing seedling quality (Leskovar et al. 1994). Seedling growth is commonly evaluated using individual traits such as plant height, number of leaves, leaf area, stem diameter, fresh weight, and dry weight (Jang et al. 2018). In addition, secondary transformed indices are used to evaluate the morphological balance and overall quality of seedlings (Lin et al. 2018): the sturdiness quotient, calculated from the ratio of plant height to stem diameter, is used to evaluate seedling elongation, whereas compactness indicates dry matter accumulation relative to plant height based on the ratio of shoot dry weight to plant height (Kim and Hwang 2019; Liu et al. 2023). Because conventional evaluation of these traits relies on destructive measurements, image-based analysis has been studied as a non-destructive alternative: images taken from multiple angles have been used to reduce leaf overlap and estimate leaf area and fresh weight (Lin et al. 2006), and image-based measurements can non-destructively collect morphological characteristics for objective and rapid seedling evaluation (Yang et al. 2020; Abebe et al. 2023). Image-based plant height and leaf area are representative indicators for quantifying seedling morphology and growth (Li et al. 2026), and image analysis using various sensors, including RGB, multispectral, and LiDAR sensors, can reduce observer- related errors and enable rapid repeated measurements (Tong et al. 2013).
Rapid evaluation of seedling traits such as fresh weight and dry weight using image-based plant height and leaf area could reduce the time and labor required for destructive measurements and minimize seedling loss (Li et al. 2020; Baek et al. 2025). Non-destructive image analysis using projected canopy size or multispectral imaging has been used to predict leaf area, fresh weight, and growth with high accuracy in leafy vegetables such as lettuce, Chinese cabbage, and basil (Ban et al. 2023; Ha et al. 2024; Jeong et al. 2024). However, most previous studies evaluated plants grown under relatively limited environmental conditions and at a small experimental scale. Few studies have used actual data from shipping stage seedlings collected from multiple commercial nurseries to compare image-based and destructive measurements, or examined rapid and objective quality evaluation using seedling quality indices such as the compactness index and the sturdiness quotient. Therefore, the relationships between image-based growth measurements and actual growth and quality indices should be evaluated in shipping stage tomato seedlings produced in commercial nurseries.
Therefore, this study was conducted to evaluate the applicability of image-based growth measurements for shipping stage tomato seedlings produced in commercial nurseries in Korea using a specially developed Plant Image Measurement System (PIMS). Image-based plant height and leaf area were used to estimate shoot fresh weight and shoot dry weight and to examine the possibility of evaluating the compactness index (CI) and sturdiness quotient (SQ) calculated from destructive measurements. The applicability of a rapid, objective, and non-destructive method for evaluating the growth and quality of shipping stage tomato seedlings produced in commercial nurseries was also examined.
Materials and Methods
1. Plant materials
This study was conducted from February to May 2026 using shipping stage tomato (S. lycopersicum) seedlings produced in nine commercial nurseries in Korea (Table 1). The tomato cultivars were ‘TY Sharmang’, ‘TY Pinkus’, ‘SuperTop’, ‘Stargio’, ‘TY Megaton’, ‘Doterang Dia’, ‘Pink Prime’, and ‘Turkey Pink’, and the cultivars differed among nurseries. The survey locations were Chuncheon, Naju, Gurye, Nonsan, Jinan, Cheonan, Geumsan, Goseong, and Jangsu, and shipping stage seedlings were evaluated at each nursery. Plug trays with 32, 40, and 50 cells were used, and the number of seedlings evaluated ranged from 20 to 40 plants per nursery.
Table 1
Sampling information of tomato seedlings collected from commercial nurseries at the shipping stage
2. Destructive measurement of seedling growth
Plant height was measured from the stem base to the tip of the growing point. The number of leaves was determined by counting true leaves with a leaf length of at least 1 cm. Leaf area was measured for true leaves with a leaf length of at least 2 cm using ImageJ software (National Institutes of Health, Bethesda, MD, USA). Stem diameter was measured 1 cm above the stem base. Fresh weight was measured using an electronic balance (AX124KR, OHAUS Corp., Parsippany, NJ, USA). Dry weight was measured after drying the samples at 80°C for at least 72 h in a forced-air drying oven (HB-502M, Hanbeak Science, Bucheon, Korea).
3. Image acquisition and image-based growth measurements
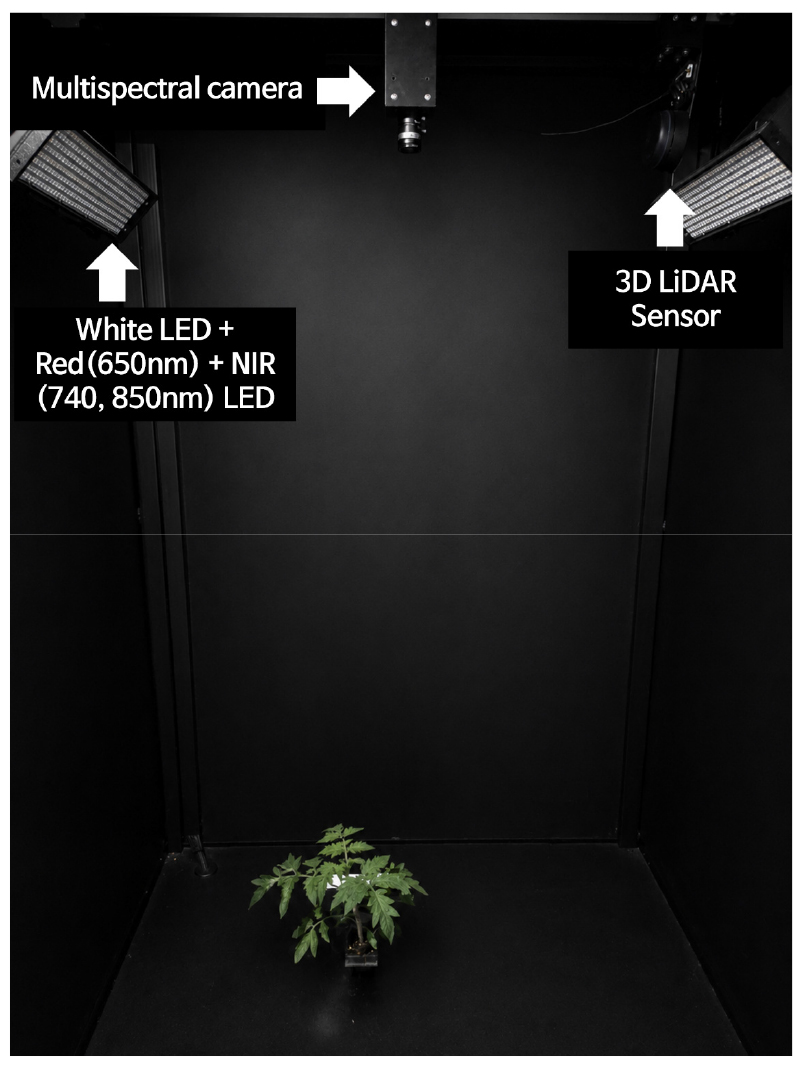
Images were acquired using a Plant Image Measurement System (PIMS, Podo Co., Ltd., Pangyo, Korea) for non- destructive growth measurements of shipping stage tomato seedlings (Fig. 1). The PIMS is an imaging chamber equipped with a LiDAR sensor (RP LiDAR A3M1, SLAMTEC Co., Ltd., Shanghai, China), a multispectral camera (FS-3200T- 10GE, JAI Inc., San Jose, CA, USA), and LED light sources comprising white, red (approximately 650 nm), and near- infrared light at approximately 740 and 850 nm. The chamber dimensions are 100 × 70 × 150 cm (W × D × H). The output of each LED channel was independently adjusted using a manual dimmer. With all light sources used for imaging turned on, the light environment was measured at the floor reference plane inside the PIMS using a spectroradiometer (LI-180, LI-COR Inc., Lincoln, NE, USA). The distance between the light sources and the floor reference plane was 120 cm, and the photon flux density over the wavelength range of 300-780 nm was 8.1 μmol·m-2·s-1. The same combination of light sources, dimmer settings, imaging position, and camera settings was applied to all seedlings. Image-based plant height and leaf area were measured using the PIMS. Plant height was measured non-destructively using the LiDAR sensor installed in the PIMS. Tomato seedlings in plug trays were placed at a fixed position inside the chamber, and the distance from the upper reference point to the bottom of the plug tray (a) and the distance to the highest point of the plant (b) were measured. Plant height was calculated by subtracting b and the plug tray height from a (PH = a − b − plug tray height). For leaf area measurement, top-view images of the seedlings were acquired using the multispectral camera installed in the PIMS, at a fixed working distance of 125 cm above the tray surface. A white reference target with a known length of 15 cm, positioned within the imaging frame, was used as a scale bar for spatial calibration. The top-view images were analyzed using ImageJ software (National Institutes of Health, Bethesda, MD, USA). For each image, the spatial resolution (r, cm·pixel⁻¹) was calculated by dividing the known length of the white reference by its corresponding length in pixels. The pixel count of the plant area was then determined and multiplied by the square of the spatial resolution (Leaf area = Pixel count × r2). Spatial calibration was performed separately for each image using the white reference; however, no additional correction of r was applied for differences in plant height among individual seedlings, as further discussed below.
4. Calculation of seedling quality indices
The compactness index (CI) and sturdiness quotient (SQ) were calculated to quantitatively evaluate tomato seedling quality. The CI was defined as the ratio of shoot dry weight to plant height and was used to represent dry matter accumulation per unit plant height. CI was calculated using Equation (1).
SQ was defined as the ratio of plant height to stem diameter and was used to evaluate relative seedling elongation and morphological balance. SQ was calculated using Equation (2).
5. Statistical analysis
All statistical analyses were performed using R software (Version 4.5.1; R Core Team, Vienna, Austria). The coefficient of variation (CV, %) was calculated using the mean and standard deviation of individual measurements to evaluate variation in each trait among all tomato seedlings collected from commercial nurseries. Simple linear regression analysis was performed for plant height and leaf area to examine the relationships between image-based and destructive measurements, and the coefficient of determination (R2) was used to evaluate each relationship. Multiple linear regression models including image-based plant height, leaf area, and their interaction term were developed to evaluate shoot growth and seedling quality indices. The dependent variables were shoot fresh weight, shoot dry weight, CI, and SQ. The R2 and root mean square error (RMSE) were used to evaluate the explanatory power and prediction error of each regression model, respectively. The significance of the interaction term between plant height and leaf area was determined based on the P-value. Statistical significance was set at P < 0.05.
Results
1. Growth characteristics of shipping stage tomato seedlings from commercial nurseries
The growth characteristics of shipping stage tomato seedlings collected from nine commercial nurseries differed among nurseries (Table 2). Destructively measured plant height ranged from 9.8 to 20.7 cm, with a CV of 22.69%, whereas image-based plant height ranged from 15.7 to 27.2 cm, with a CV of 19.28%. Destructively measured leaf area ranged from 50.2 to 161.4 cm2 and had a CV of 37.59%. Image-based leaf area ranged from 56.1 to 184.9 cm2, with a CV of 42.08%. The CV values were 18.77% for number of leaves and 54.06% for stem diameter. Shoot and root fresh weight had CV values of 26.38 and 45.48%, while the corresponding values for dry weight were 38.43 and 43.94%. CI ranged from 22.35 to 58.89 mg·cm⁻¹, with a CV of 35.27%. The SQ ranged from 2.19 to 5.28 cm·mm⁻¹, with a CV of 23.79%. Overall, shipping stage tomato seedlings showed large variation in growth among nurseries, particularly in stem diameter, leaf area, and root growth traits.
Table 2
Growth characteristics of tomato seedlings collected from nine commercial nurseries at the shipping stage
| Nurseryz | Plant height (cm) | Leaf area (cm2) |
No. of leaves (/plant) |
Stem diameter (mm) | Fresh weight (g) | Dry weight (g) |
Compactness Index (CI) (mg·cm-1) |
Sturdiness quotient (SQ) (cm·mm-1) | ||||
| Destructive |
Image- based | Destructive |
Image- based | Shoot | Root | Shoot | Root | |||||
| A | 19.8ay | 23.5b | 128.2b | 150.4b | 7.3a | 3.8b | 7.3bc | 2.29b | 0.6bc | 0.18c | 32.12de | 5.28a |
| B | 20.5a | 24.2b | 120.1b | 113.0c | 6.4b | 5.2ab | 6.7b | 3.21a | 0.6bc | 0.26a | 28.91e | 3.99cd |
| C | 16.7c | 20.8c | 88.7c | 87.6d | 5.5c | 4.1b | 5.5d | 1.14d | 0.5c | 0.08f | 29.76e | 4.07cd |
| D | 13.8d | 17.2d | 50.2d | 56.1e | 4.5d | 4.1b | 4.0e | 0.78e | 0.3e | 0.22b | 22.35f | 3.36e |
| E | 9.8e | 15.7e | 116.2b | 112.3c | 5.4c | 4.5ab | 5.3e | 1.53c | 0.4e | 0.10ef | 44.68b | 2.19f |
| F | 16.6c | 23.0b | 154.3a | 165.1ab | 6.7b | 4.3b | 8.2ab | 1.78c | 1.0a | 0.17c | 58.89a | 3.90d |
| G | 17.7b | 23.2b | 161.4a | 184.9a | 7.5a | 3.8b | 6.8cd | 1.62c | 0.7b | 0.13de | 38.93c | 4.72b |
| H | 13.6d | 17.9d | 93.5c | 93.3cd | 5.4c | 3.9b | 4.7e | 1.84c | 0.5d | 0.15cd | 36.33cd | 3.46e |
| I | 20.7a | 27.2a | 92.3c | 105.4cd | 5.4c | 6.0a | 7.3a | 2.20b | 0.6bc | 0.14d | 30.84e | 4.29c |
| Average | 16.6 | 21.4 | 111.7 | 118.7 | 6.0 | 4.4 | 6.19 | 1.82 | 0.59 | 0.16 | 35.87 | 3.92 |
| Max | 20.7 | 27.2 | 161.4 | 184.9 | 7.5 | 6.0 | 8.20 | 3.21 | 0.98 | 0.26 | 58.89 | 5.28 |
| Min | 9.8 | 15.7 | 50.2 | 56.1 | 4.5 | 3.8 | 3.98 | 0.78 | 0.31 | 0.08 | 22.35 | 2.19 |
| CVx (%) | 22.69 | 19.28 | 37.59 | 42.08 | 18.77 | 54.06 | 26.38 | 45.48 | 38.43 | 43.94 | 35.27 | 23.79 |
ᶻCultivars corresponding to nurseries A-I were ‘TY Sharmang’ (A and B), ‘TY Pinkus’ (C), ‘SuperTop’ (D), ‘Stargio’ (E), ‘TY Megaton’ (F), ‘Doterang Dia’ (G), ‘Pink Prime’ (H), and ‘Turkey Pink’ (I).
2. Linear relationships between destructive and image-based measurements
Image-based plant height and leaf area showed positive linear relationships with destructive measurements (Fig. 2). Linear regression analysis between the two measurement methods gave regression equations of y = 0.95x + 5.60 for plant height and y = 0.97x + 8.67 for leaf area, with R2 values of 0.7524 for plant height and 0.6837 for leaf area (Fig. 2A, B). Plant height showed a stronger relationship between image-based and destructive measurements than leaf area, as indicated by its higher R2.
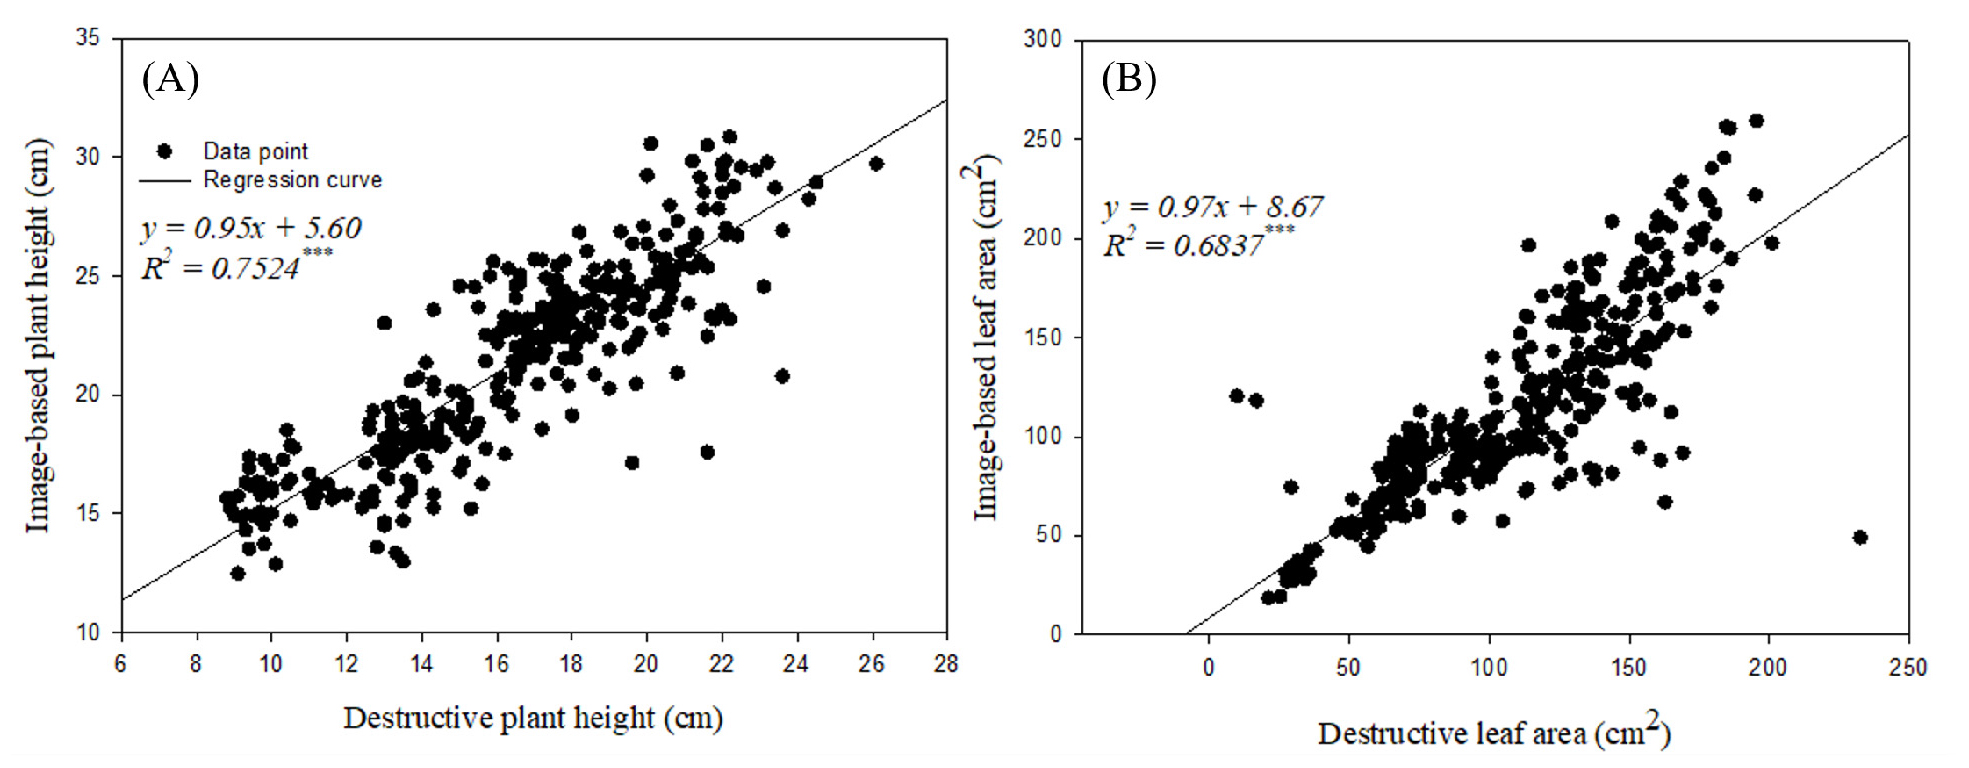
Fig. 2
Linear relationships between destructive and image-based measurements of plant height and leaf area in tomato seedlings (n = 340). The panels represent (A) plant height and (B) leaf area. Solid lines indicate fitted regression lines. *** indicates that the regression is significant at P < 0.001
3. Differences in morphological characteristics of shipping stage tomato seedlings among commercial nurseries
Shipping stage tomato seedlings showed different morphological characteristics in plant height and canopy development among nurseries (Fig. 3). Seedlings from Nurseries I, B, and A had relatively high image-based plant heights of 27.2, 24.2, and 23.5 cm, whereas seedlings from Nursery E had the lowest plant height of 15.7 cm. Seedlings from Nurseries F and G showed wider canopies in the top-view images, and their image-based leaf areas were also high at 165.1 and 184.9 cm2. In contrast, seedlings from Nursery D showed a relatively small canopy and had the lowest image-based leaf area of 56.1 cm2 (Table 2). Seedlings with greater plant height did not always have wider canopies or larger leaf areas. Seedlings from Nursery I had the greatest plant height, whereas seedlings from Nurseries F and G had relatively wider canopies and larger leaf areas. Overall, plant height and canopy development differed among nurseries.
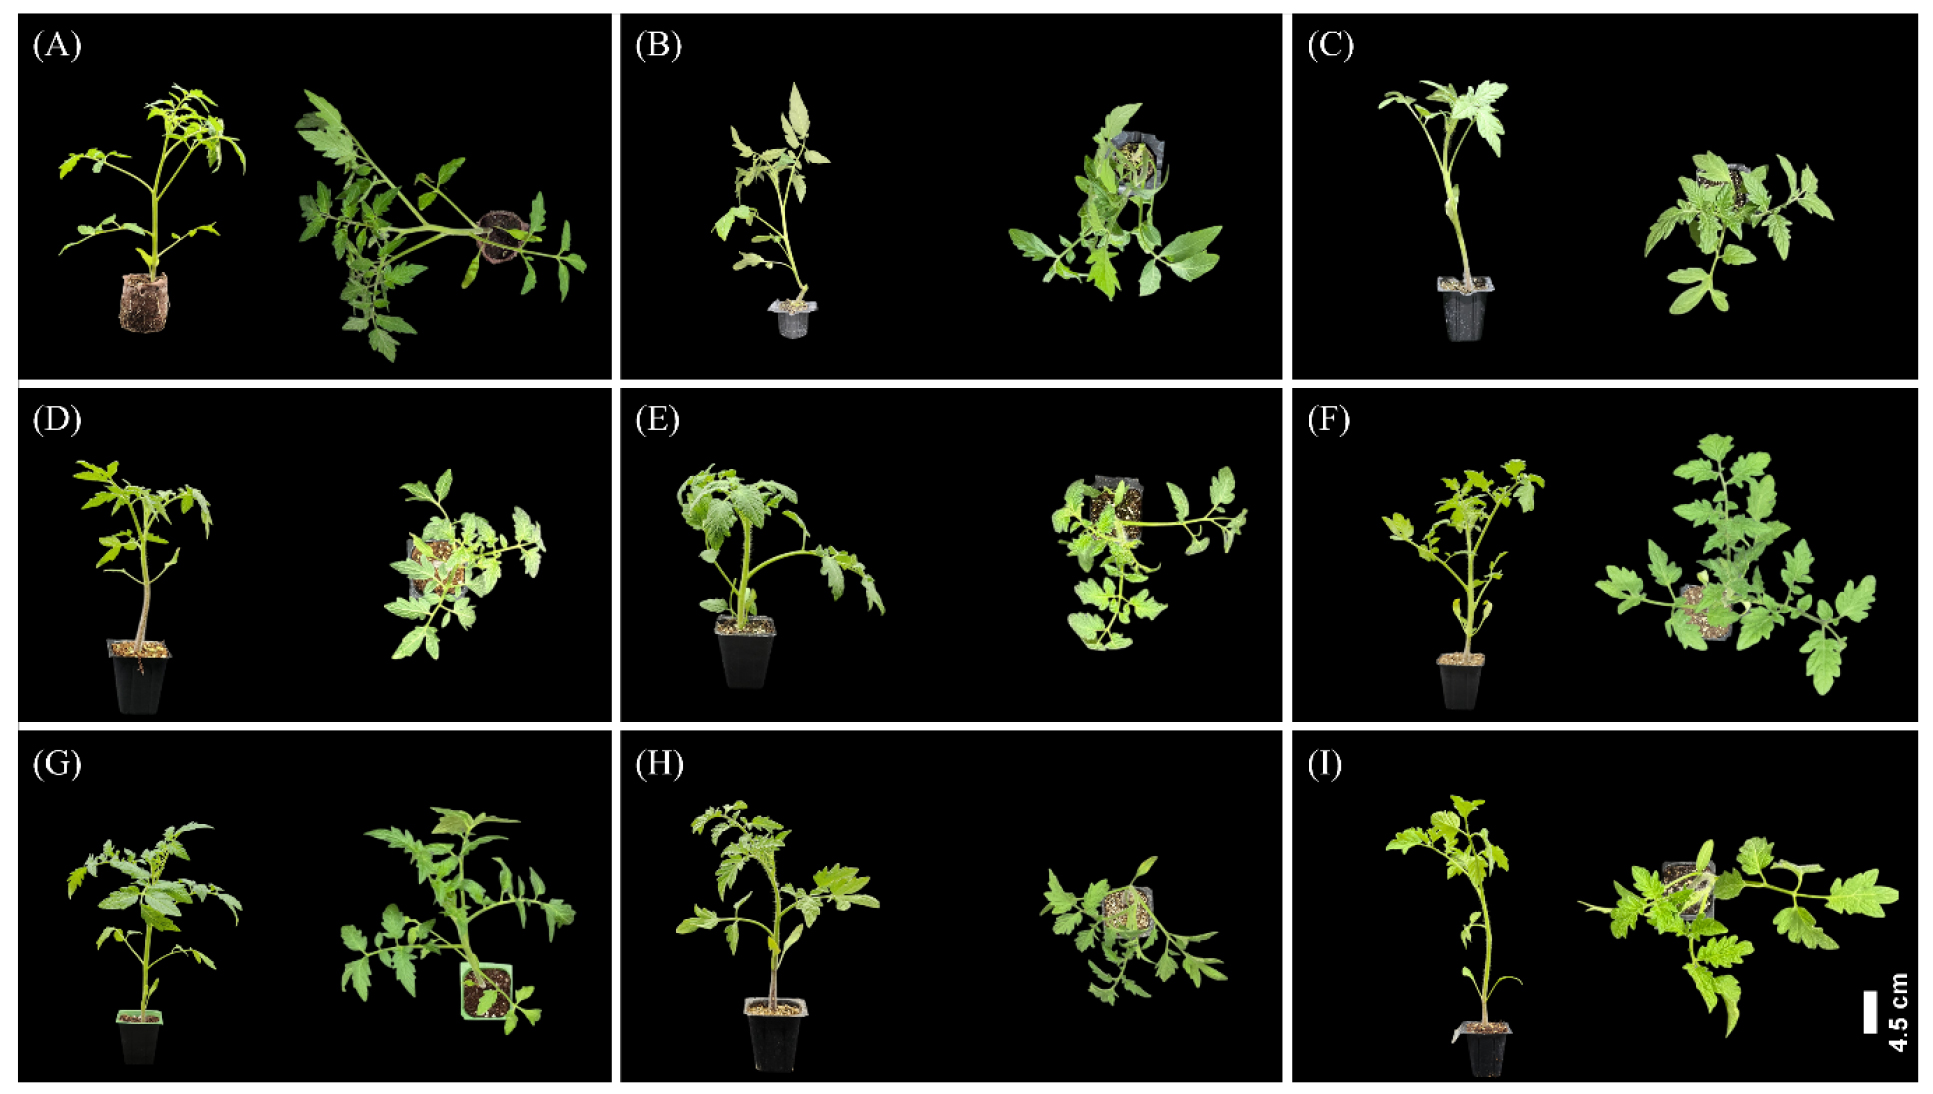
Fig. 3
Representative side and top-view images of shipping stage tomato seedlings collected from nine commercial nurseries. The cultivars were ‘TY Sharmang’ (A, B), ‘TY Pinkus’ (C), ‘SuperTop’ (D), ‘Stargio’ (E), ‘TY Megaton’ (F), ‘Doterang Dia’ (G), ‘Pink Prime’ (H), and ‘Turkey Pink’ (I). Scale bar = 4.5 cm
4. Evaluation of shoot growth and seedling quality indices using image-based plant height and leaf area
Regression models using image-based plant height and leaf area showed the highest R2 for shoot fresh weight (Fig. 4). The shoot fresh weight model had an R2 of 0.642 and an RMSE of 0.964 (Fig. 4A). The shoot dry weight model had an R2 of 0.509 and an RMSE of 0.157 (Fig. 4B). The CI model had an R2 of 0.312 and an RMSE of 10.543 mg·cm-1 (Fig. 4C). The SQ model had an R2 of 0.407 and an RMSE of 0.702 (Fig. 4D). The interaction term between plant height and leaf area was significant for shoot fresh weight (P < 0.01) and CI (P < 0.001), but was not significant for shoot dry weight (P = 0.069) or SQ (P = 0.172). Overall, the R2 values of the models using image-based plant height and leaf area differed among traits, and the highest R2 was observed for shoot fresh weight.
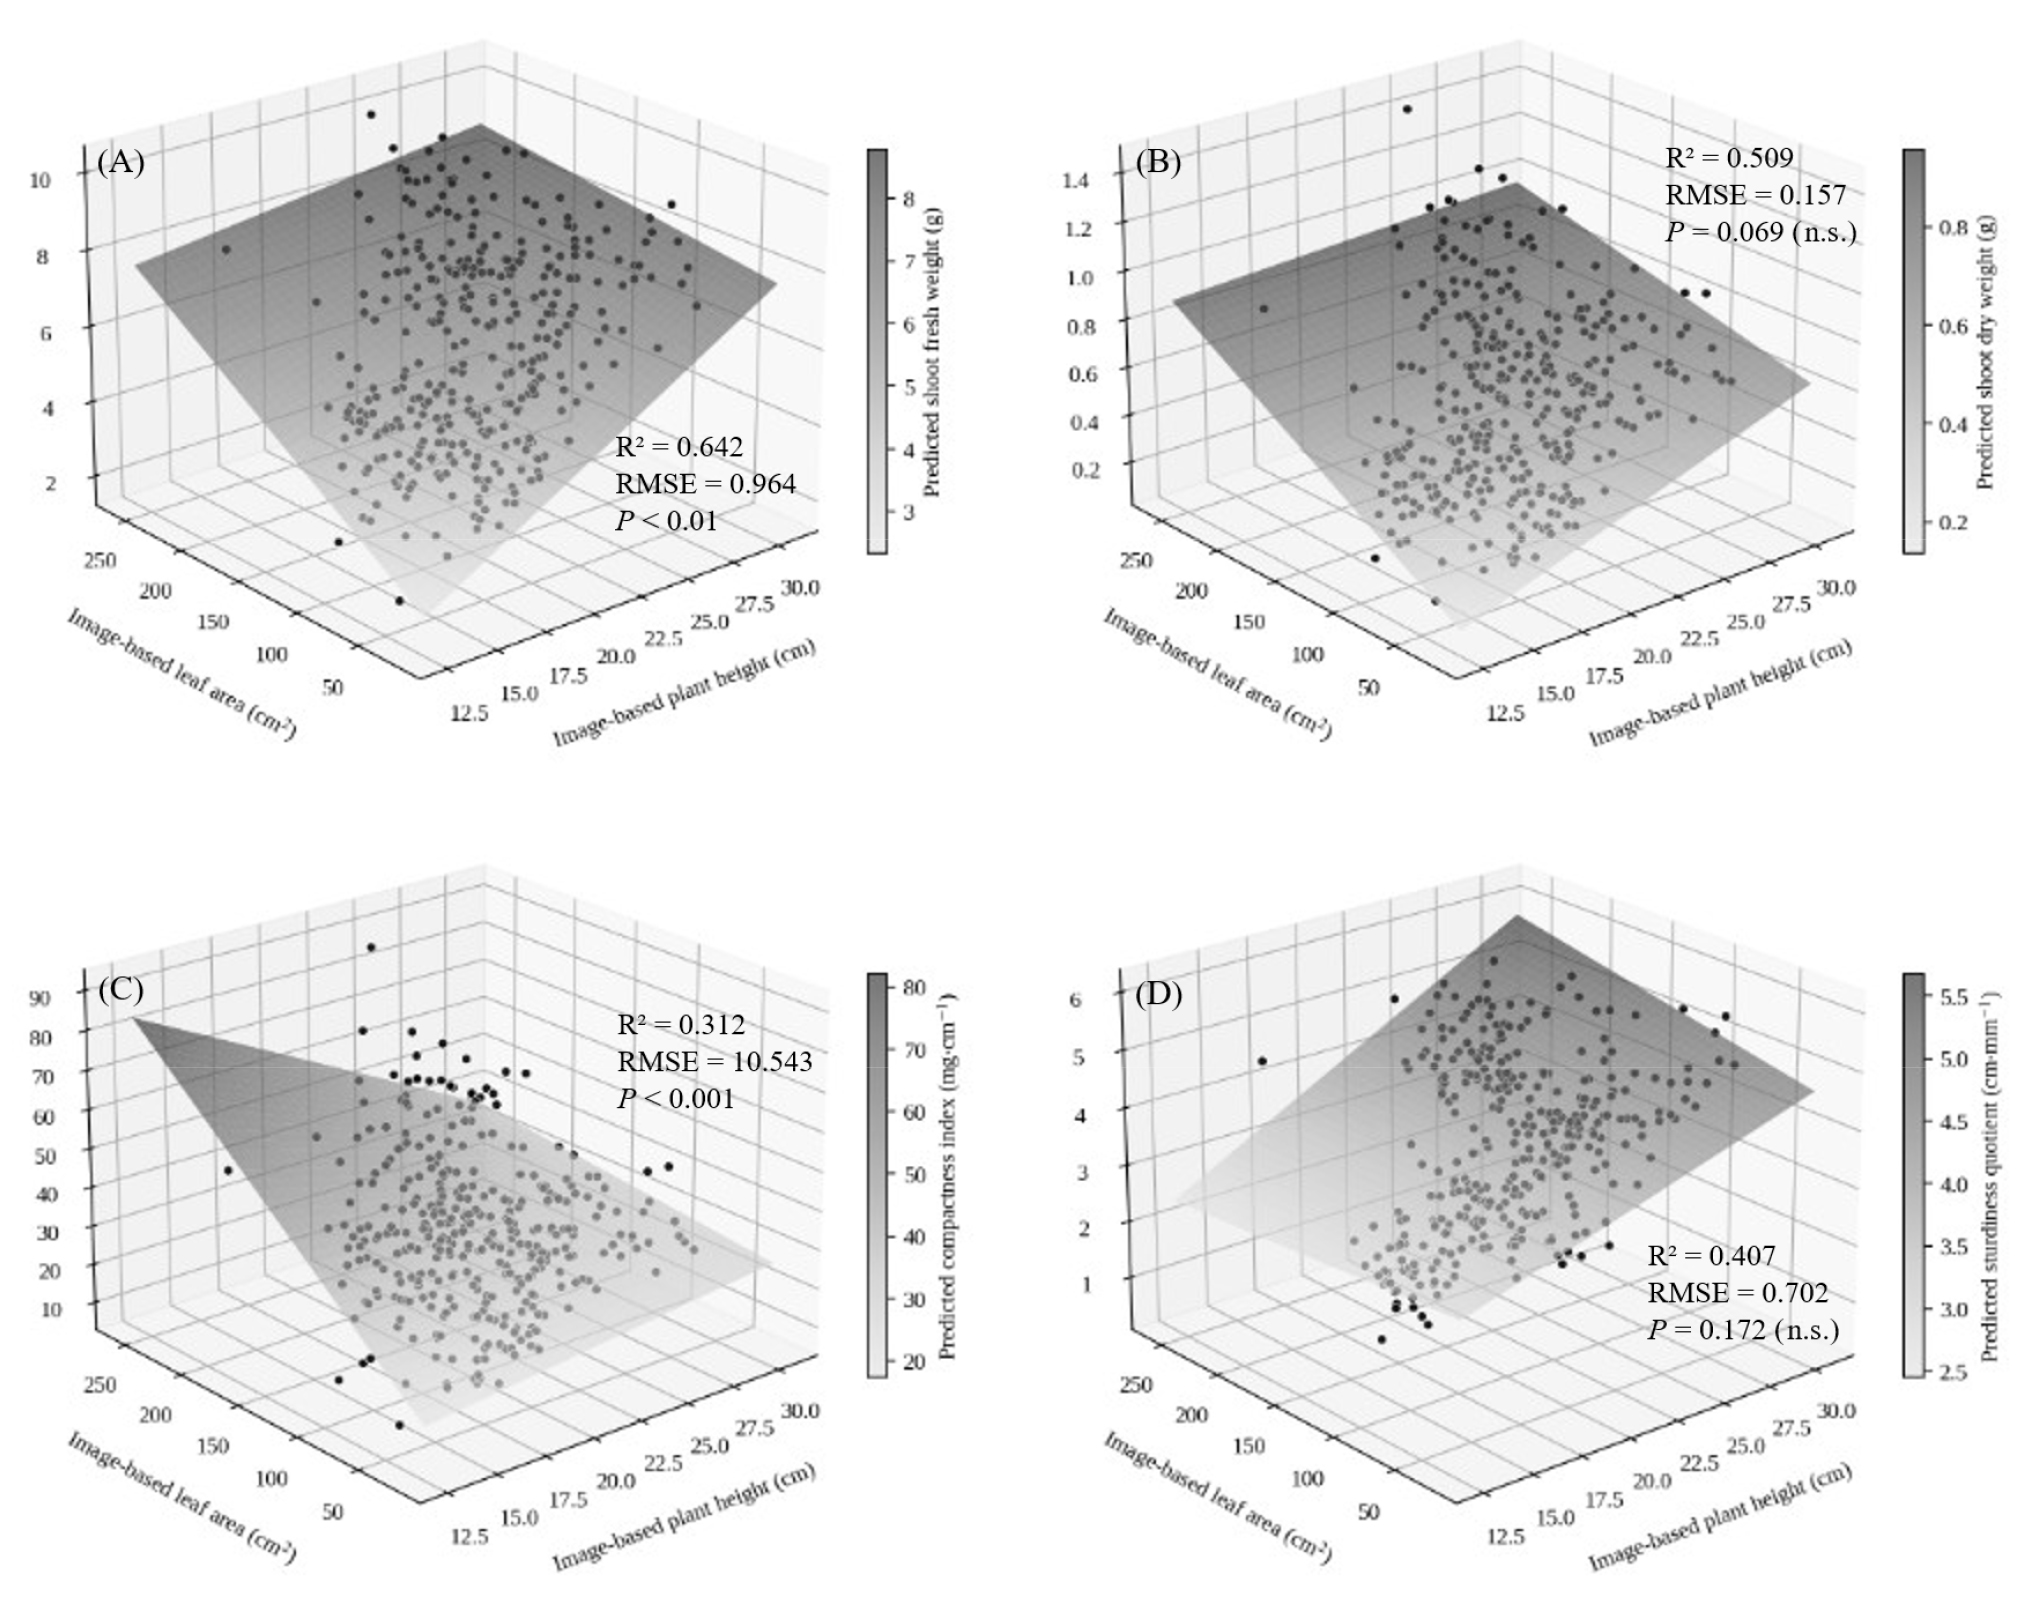
Fig. 4
Response surface plots showing the relationships of image-based plant height and leaf area with shoot growth and quality traits of tomato seedlings (n = 340). The response variables were (A) shoot fresh weight, (B) shoot dry weight, (C) compactness index, and (D) sturdiness quotient. The R2 and RMSE values for the regression models and the P-values for the interaction terms are shown in each panel
Discussion
1. Growth variation and the need for quality evaluation of shipping stage tomato seedlings from commercial nurseries
Tomato seedling growth can vary depending not only on cultivar but also on plug tray size and nursery growing conditions. Growth and quality characteristics of Chinese cabbage seedlings have also been reported to differ according to plug cell size (Ban et al. 2023). Similar production-driven variation has been reported for cucumber seedling quality under different production systems (Hyeon et al. 2024). In the present study, differences in growth and morphological characteristics were observed among commercial nurseries, and differences in plant height and canopy development were also observed in the side- and top-view images (Fig. 3). In particular, seedlings with relatively greater plant heights did not always have wider canopies or larger leaf areas. This indicates that stem elongation and canopy development were not necessarily coupled. Such decoupling is consistent with reports that high planting density and small plug cell size promote excessive stem elongation without a corresponding increase in stem diameter or leaf expansion (Bozokalfa 2008), a pattern associated with the shade- avoidance response, in which a reduced red-to-far-red light ratio promotes stem elongation while suppressing root growth (Chitwood et al. 2015; Rosado et al. 2022). This imbalance highlights a limitation of single-trait seedling evaluation: shoot height alone is a poor and potentially misleading quality indicator unless combined with other traits (Binotto et al. 2010), which is why integrated indices such as the DQI (Dickson et al. 1960) and multi-trait tomato quality indices (Seo et al. 2018) have been developed. Differences in tomato seedling growth caused by production conditions can affect growth and yield after transplanting (Leskovar et al. 1994), and seedling quality is related to growth responses after transplanting (Qin and Leskovar 2020); seedlings with excessive shoot height relative to root systems are more prone to transplant stress (Jacobs et al. 2012), whereas structurally balanced seedlings show higher early yield (Park et al. 2026). Therefore, shipping stage seedling quality should be evaluated using multiple growth traits in combination rather than by visual assessment alone.
2. Applicability of image-based plant height and leaf area measurements
A strong linear relationship between image-estimated and actual leaf area has been reported (Li et al. 2020), and three-dimensional point cloud-based measurements have similarly been used to quantify seedling morphological traits (Yang et al. 2020). Consistent with these reports, image-based plant height and leaf area in the present study showed positive linear relationships with destructive measurements, although the relationship was weaker for leaf area than for plant height (Fig. 2). This difference likely reflects the three-dimensional canopy structure of the seedlings: in top-view imaging, leaf overlap can cause the projected leaf area to diverge from the actual leaf area (Tong et al. 2013), and this effect can be substantial: single top-view images have been shown to produce leaf area estimation errors of 14.5% and 13.1% in cabbage and broccoli seedlings, respectively, whereas combining orthogonal images from multiple angles reduced these errors to 1.6% and 4.9% (Lin et al. 2006). Because only a single top-view image was used for leaf area estimation in the present study, canopy structure and leaf overlap in the shipping stage tomato seedlings likely weakened the relationship between image-based and destructive leaf area measurements in a similar manner. An additional source of error may involve perspective distortion: because leaf area estimation is most accurate when the calibration reference and the imaged surface share the same plane (Easlon and Bloom 2014), a condition that even a vertically oriented camera does not fully satisfy (An et al. 2016), taller seedlings, whose canopies sat closer to the camera than the tray-level calibration plane, may have been disproportionately affected, and correcting for such perspective effects has been shown to reduce leaf area estimation error in tomato (Yamaguchi et al. 2024). In contrast, the discrepancy between image-based and destructively measured plant height likely arose from differences in measurement reference points rather than canopy structure: the LiDAR sensor detected the highest point of the plant, whereas manual measurements were taken from the stem base to the apical meristem, consistently yielding greater image-based than destructive height values. Taken together, these results indicate that image-based plant height and leaf area can effectively quantify seedling morphological traits, provided that measurement errors arising from canopy structure/leaf overlap, perspective distortion, and differences in reference points are properly accounted for.
3. Applicability of image-based plant height and leaf area for the evaluation of shoot fresh weight and dry weight
Projected canopy size has been used to predict leaf area and fresh weight of lettuce with high R2 values (Jeong et al. 2024). Canopy area has also shown strong relationships with both leaf area and fresh weight in basil seedlings (Ha et al. 2024). Multispectral imaging has also been used to non-destructively predict leaf area and growth of Chinese cabbage seedlings (Ban et al. 2023). In contrast, the R2 values of the shoot fresh weight and shoot dry weight models in the present study were relatively lower than those reported in previous studies. This difference can be attributed to fundamental differences in experimental scope: previous studies evaluated plants produced under relatively uniform, controlled growing conditions within a single experiment, whereas the present study included shipping stage seedlings from nine commercial nurseries with different cultivars and production environments. When seedlings grown under diverse conditions are pooled, the relationship between external size and biomass weakens because environmental effects on tissue properties are absorbed into the residual variance. Leaf mass per area (LMA), a key determinant of this relationship, varies strongly with light, temperature, and water availability (Poorter et al. 2009); in tomato specifically, a 60% reduction in light availability decreased LMA by 24% within 10 days, while CO2 enrichment and fruit removal increased LMA by approximately 45% and 15%, respectively (Bertin and Gary 1998). Light source has also been shown to alter the fresh-to-dry weight relationship in tomato seedlings directly, with the lowest fresh-to-dry ratio observed under high-efficiency fluorescent light, indicating greater tissue hardening (Almansa et al. 2014). Plant height and leaf area reflect the external size of plants, determined primarily by cell expansion and division, whereas shoot fresh and dry weight are also shaped by these environmentally plastic tissue properties. Therefore, when seedlings from nurseries with different cultivars and production conditions are pooled, the relationship between image-based external size measurements and biomass is inherently weakened. Overall, image-based plant height and leaf area can be used as basic indicators for evaluating shoot growth of shipping stage tomato seedlings, but additional non-destructive traits such as specific leaf area or leaf mass per area, which capture environmentally induced variation in tissue properties, should be considered to improve evaluation accuracy.
4. Limitations of image-based evaluation of CI and SQ
In the present study, the SQ model had a higher R2 than the CI model, but both were substantially lower than the shoot fresh weight and shoot dry weight models (Fig. 4). This pattern reflects fundamental statistical properties of ratio- based indices rather than simply insufficient predictors. Regression on a ratio variable is known to conflate signals from the numerator and denominator rather than adjusting for the denominator in the sense of conditioning on it, often producing misleading inferences (Kronmal 1993), and this problem is compounded when the denominator itself is highly variable: spurious correlation in ratio-based analyses increases as the coefficient of variation of the denominator increases (Atchley et al. 1976). Stem diameter, the denominator of SQ, showed relatively large variation among nurseries in the present study (Table 2) and was not included as an image-based predictor, an omission compounded by the fact that stem diameter is technically difficult to measure non-destructively: an R2 of only 0.54 was reported for tomato stem diameter measured with an RGB-D depth camera, compared to R2 > 0.99 for seedling height (Syed et al. 2019). For CI, shoot dry weight, a component that cannot be directly captured by imaging, is similarly absent from the model; although the interaction between plant height and leaf area was significant, these traits mainly represent external plant size and may not fully reflect internal dry matter accumulation, which varies with tissue density and water content as influenced by nursery growing conditions, as discussed above. The significance of the interaction term was therefore insufficient to compensate for the absence of direct dry matter information, consistent with CI showing the lowest R2 among all models. Overall, the difficulty of predicting CI and SQ from image data reflects both the statistical limitations inherent in ratio-based indices and the practical difficulty of non-destructively capturing their missing component traits; additional non-destructive traits related to stem diameter and dry matter accumulation, potentially via RGB-D depth sensing or hyperspectral approaches, should therefore be integrated to improve the evaluation of such composite quality indices.
Conclusions
This study evaluated growth and morphological variation in shipping stage tomato seedlings produced in nine commercial nurseries in Korea and examined the applicability of image-based plant height and leaf area for non-destructive growth and quality evaluation. Shipping stage seedlings from different commercial nurseries showed variation in morphological characteristics and shoot and root growth. Differences in plant elongation and canopy development were also observed in the side- and top-view images. Image-based plant height and leaf area showed positive linear relationships with destructive measurements and could be used to non-destructively quantify the morphological characteristics of tomato seedlings. Regression models using image-based plant height and leaf area showed the highest R2 for shoot fresh weight. These traits may therefore be used as basic indicators for rapid evaluation of shoot growth in shipping stage seedlings. In contrast, composite seedling quality indices such as CI and SQ showed relatively low R2 values. Additional non-destructive traits related to stem diameter and dry matter accumulation are needed for more accurate quality evaluation. Overall, image-based growth measurements can be used for the objective and non-destructive evaluation of morphological characteristics and shoot growth in shipping stage tomato seedlings produced in commercial nurseries. These results may provide basic information for developing a seedling quality evaluation system for future applications in commercial nurseries.