

Introduction
In winter, heating is the most important aspect of greenhouse farming, as it is required to achieve the desired temperature for crop growth. To serve this purpose, different heating systems are typically used inside greenhouses. This leads to a significant increase in energy consumption of the greenhouse, consequently affecting production costs. A previous report noted that the heating cost of greenhouses has increased by up to 40% of the total production cost (Yang et al., 2012). Various studies have focused on employing different renewable energy sources in greenhouses to reduce their production cost (Rasheed et al., 2015). Besides applying different heating systems, researchers and farmers are concerned about reducing heat loss. Among the passive heating modes practiced in greenhouses, thermal screens are widely used for reducing heat loss during nighttime, thus resulting in energy savings (Ghosal and Tiwari, 2004). While designing a greenhouse, selection of appropriate material can positively affect the energy demand and fuel consumption (Rasheed et al., 2018).
Studies have evaluated the efficiency of greenhouse thermal screens under a laboratory setup (Kim et al., 2007;Kim et al., 2009;Chung et al., 2009). Here, a box made of specific test materials is provided the same heat energy, and the temperature inside the box is then measured for comparison. Moreover, some experimental studies (Kittas et al., 2003;Teitel et al., 2009;Park et al., 2015) have analyzed the thermal screen materials by observing the internal temperature of a greenhouse with and without the screens. Many types of thermal screens are available in the market, and researchers have estimated their efficiencies using different methods. Currently, farmers have few opportunities to obtain information pertaining to the performance of the thermal screens for pre-design decision making (Hemming et al., 2017). Understanding the amount of heat loss through these materials is very important as this information would assist farmers make comparisons among different screen materials, to reduce their initial and production costs.
Some studies estimated the overall heat transfer coefficient of thermal screens of various combinations with a hot box (Diop et al., 2012;Diop et al., 2014;Lee et al., 2015). An experimental study proposed a setup to quantify screens’ properties and better estimate the heat loss under different defined conditions (Hemming et al., 2017). The results of these studies showed a valuable information about thermal screens and can make comparison between them before making investment. Many BES models have been developed, providing more avenues for conducting such simulations. Compared with experimental studies, BES modeling is also cost-effective (Rasheed et al., 2017).
TRNSYS (Transient System Simulation) is a BES(Building Energy Simulation) program, a versatile componentbased program. It is used for the simulation of thermal systems and has been available for 40 years. The complete package consists of a series of programs and add-ons to enable its use for simulations of projects with complex designs (Klein, 2012). This program can also be used in tandem with many other softwares (e.g., Excel, Matlab, and ANSYS). Thus, this program is very adaptable and easy to use.
In this study, we used a previously proposed BES model of a hot box (Rasheed et al., 2017) to calculate the overall heat transfer coefficient (U-value) of greenhouse thermal screens. A number of screen materials available in the South Korean market were selected for this investigation under different weather conditions. The BES model was validated by laboratory experiments.
Materials and Methods
1. Experimental hot box
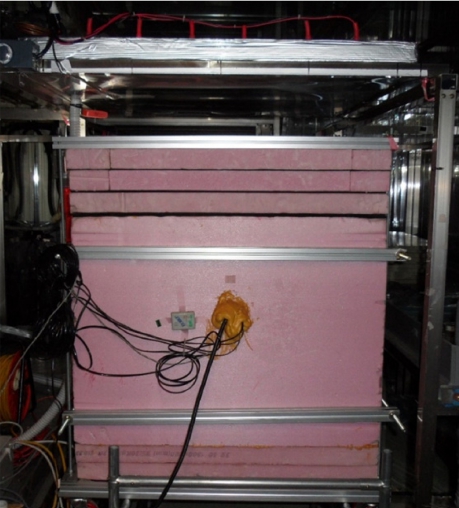
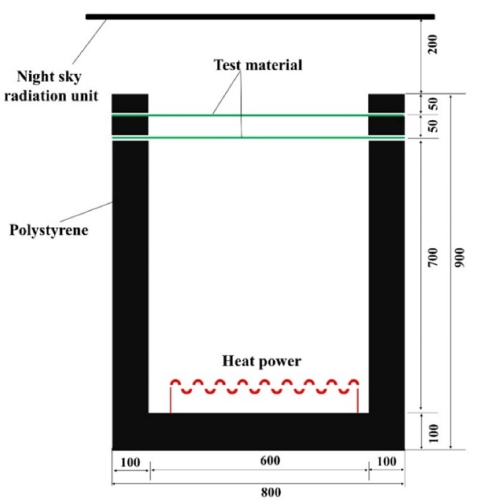
A calibrated laboratory hot box apparatus, designed in a previous study (Diop et al., 2014), can be seen in Fig. 1. It was used to measure the U-value of single- and double-layered polyethylene (PE) for validation purposes. The whole apparatus was designed according to the American Society for Testing and Materials (ATSM) standards C-236-89 (ATSM, 1993). The dimensions of the hot box were 800 × 800×900mm3, with the base and walls made of 100-mm thick polystyrene insulation material. To achieve a desirable internal temperature with reference to that outside the hot box, a heating device was introduced from the bottom. The experiments were conducted during nighttime to observe the radiative heat loss during this time. A unit of dimensions 1000×1000mm2 was placed 200mm above the hot box. It was made of stainless steel, and coolant was used inside the unit to achieve the desired sky temperature. Fig. 2 shows the schematic of the hot box. Detailed information about its construction and setup can be found in (Diop et al., 2012).
2. BES modeling
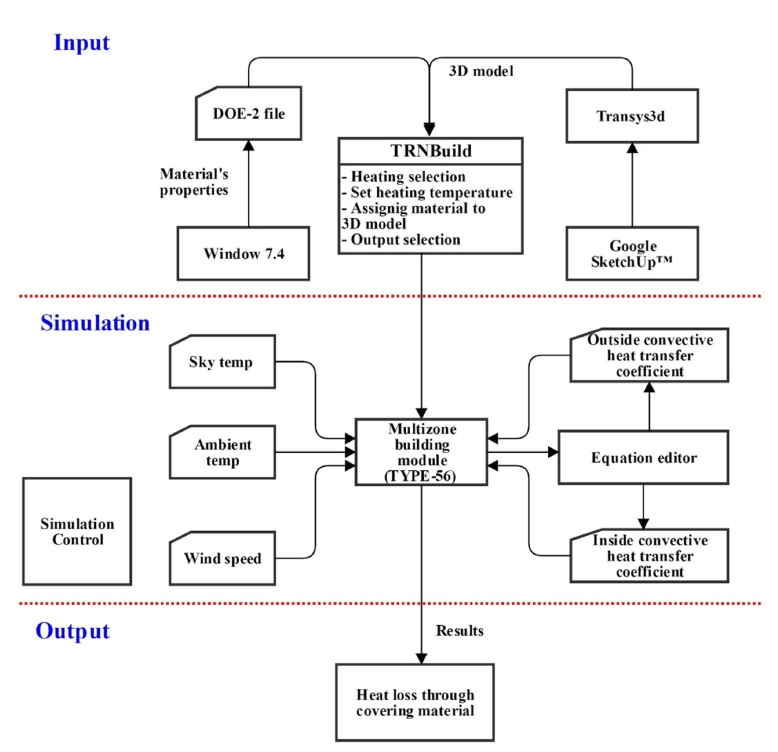
A BES model, designed and calibrated in our previous study (Rasheed et al., 2017) for the investigation of U-values of the covering materials of the greenhouse, was used to run the simulations for the thermal screens. The model was developed by utilizing TRNSYS 18, as a BES program. For this study, we used following features of TRNSYS 18, simulation studio, TRNBuild, and the following programs were applied for pre-processing the simulations: Berkeley Lab Window 7.4 software, Google SketchUp™, and Trnsys3d. Fig. 3 shows the flow chart of the complete modeling process. Simulation Studio was used to link all the components by applying external weather conditions to the hot box using TYPE 56. TYPE 56 is a building component of TRNSYS, which opens in TRNBuild to capture basic information pertaining to the project. In addition, we added a 3D model of a greenhouse, prepared using Transys3d, a plugin for Google SketchUp™. To analyze the thermal screens, we prepared a DOE-2 file (readable by TRNBuild) using Berkeley Lab Window 7.4 software.
3. Simulation
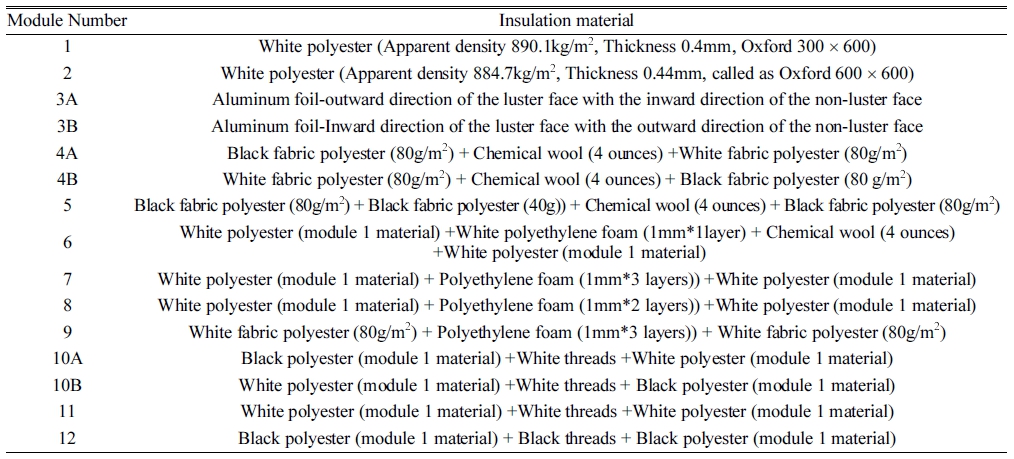
Table 1 shows the various components of the thermal screens. Table 2 shows the physical and thermal properties of the different thermal screens. Information about the tested thermal screens was sourced from (Kim et al., 2009). The BES model was validated by comparing the simulation to the experimental results of the single- and doublelayered PE material with and without night sky radiation.
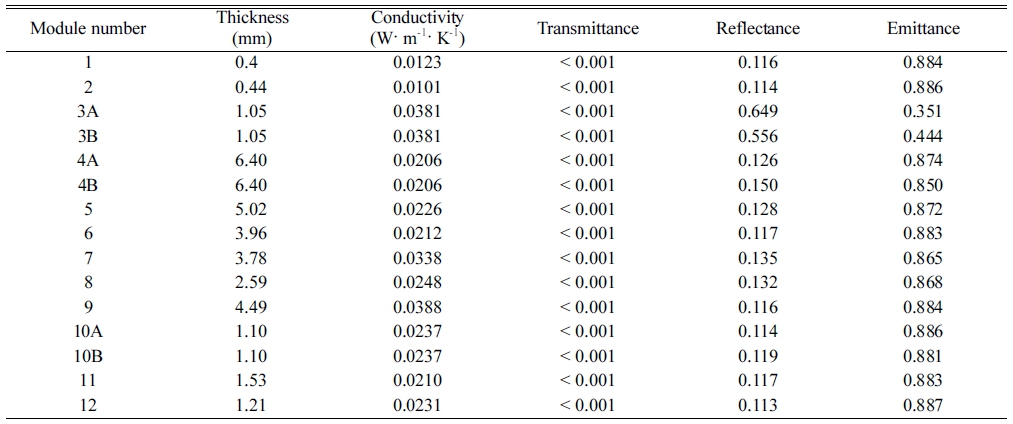
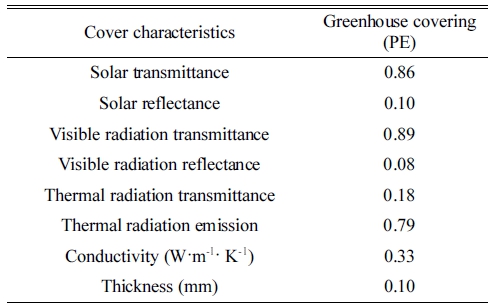
The calibrated and validated model was then used to investigate the U-values of the single thermal screens presented in Table 1, using the thermal properties shown in Table 2. Further investigations were conducted to calculate the U-values of the single thermal screens with combinations of single-layered PE material. The thermal properties of the PE material are shown in Table 3 (Valera et al., 2008).
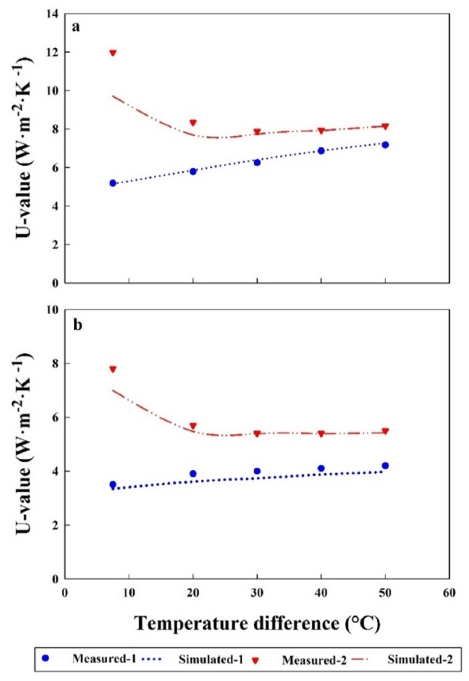
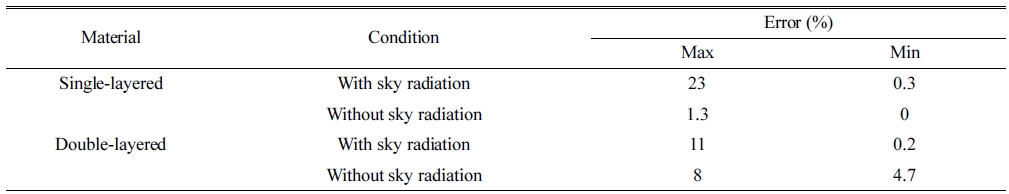
Figs. 4a and 4b show the computed and experimentally observed U-values of single- and double-layered PE, respectively. The outside temperature was fixed to 0°C, and the sky temperature was fixed to -20°C to observe night sky radiation effect. In addition, to simulate the effect of no night sky radiation, the sky temperature was fixed to 0°C, similar to the outside temperature. The results of both conditions were obtained for inside-to-outside temperature difference ranging from 10 to 50°C. Table 4 shows the validation results in terms of percentage error. The overall validation results show good agreement between the simulated and experimental findings. The minimum errors for the single- and double-layered PE in the absence of night sky radiation are 0 and 4%, whereas the maximum corresponding values are 1.3 and 8%, respectively. In the presence of night sky radiation, the minimum error values are 0.3 and 0.2%, and the maximum values are 23 and 11%, respectively. The higher errors occurred for night sky radiation, for the lower inside-to-outside temperature difference for both the single and double layers. This can be attributed to the fact that during the laboratory experiments, the sky temperature was not constant at the required temperature of -20°C; the distribution of night sky temperature on the screen ranged from -18 to -22°C. On the contrary, during the simulation, the sky temperature was fixed exactly to -20°C. In addition, while the radiative heat loss difference between the BES-computed values and the experimental values was the same for all the inside-to-outside temperature differences, the difference between the validation results increased as the inside-to-outside temperature decreased (Rasheed et al., 2017).
The validation results point to the suitability of the proposed model for calculating the U-values of any material. Furthermore, simulations were carried out for all the thermal screens detailed in Table 1. Figs. 5a and 5b show the U-values of the single-layer thermal screen. Figs. 5c and 5d show the U-values of the double-layered materials used in the greenhouse (i.e., the thermal screen combined with PE greenhouse covering). The results of both the single- and double-layered screens without night sky radiation showed an increasing trend for the U-value as the inside-to-outside temperature difference increased, as shown in Figs. 5a and 5c. This occurred because of the increasing convective heat transfer coefficient due to the increasing surface temperature of the material. In addition, this increasing trend was similar to that observed in a previous study (Lee et al., 2015). Figs. 5b and 5d show variation in the U-values of the single- and double-layered thermal screens when the simulations were carried out for a sky temperature of -20°C (i.e., assuming the presence of night sky radiation). The results showed that for the lower inside-to-outside temperature difference, the U-value was very high, and as the inside-to-outside temperature difference increased, the Uvalue started decreasing and became stabilized after reaching a temperature difference of 20°C. Moreover, the Uvalue of the thermal screens was high for all the inside-tooutside temperature differences in the presence of night sky radiation than without it. This trend is also in line with the findings of previous studies (Feuilloley and Issanchou, 1996;Diop et al., 2014).
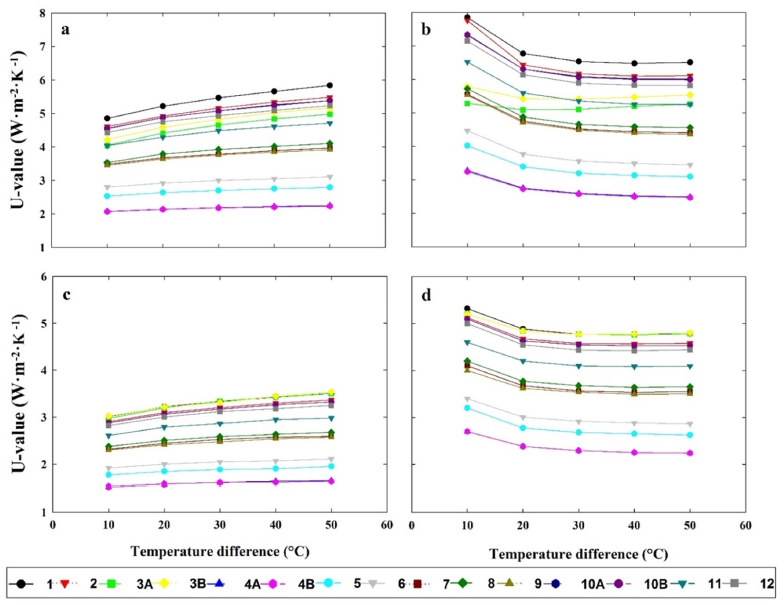
Fig. 5
U-values of thermal screens according to the inside-to-outside temperature difference for (a) single-layer thermal screen in the absence of night sky radiation, (b) single-layer thermal screen in the presence of night sky radiation, (c) double-layer thermal screen in the absence of night sky radiation, and (d) double-layer thermal screen in the presence of night sky radiation.
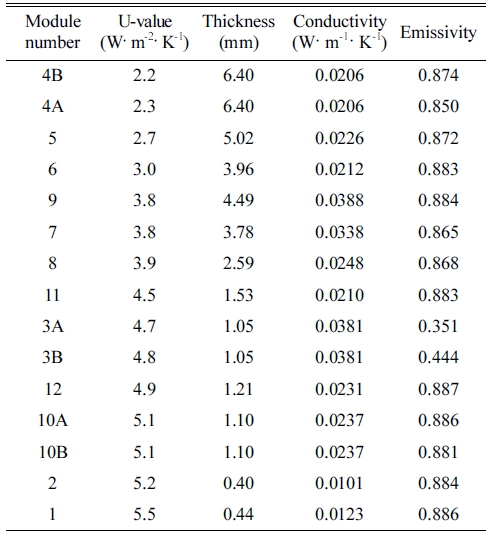
Table 5 presents the U-values, of all tested single-layered thermal screens at 30°C inside-to-outside temperature difference, sorted in ascending order. It includes consideration of the thickness, thermal conductivity, and emissivity of all the thermal screens. The results showed that materials in modules 4B and 4A show the lowest U-values. Thus, it can be concluded that the thickness and thermal conductivity of the materials have a greater influence on their Uvalues; higher thickness and lower thermal conductivity caused less heat loss from the material. The U-value of material 6 is less than 10 even though its thickness is less than that of material 9, the reason being that the thermal conductivity of material 9 is higher than that of material 6. The thermal conductivities of materials 1 and 2 are among the lowest but due to their lower thicknesses, their U-values are higher than those of all other materials. Moreover, thermal screens 4A and 4B have the same thickness and thermal conductivity, but their U-values are not the same because their emissivities are different. The same reasoning applies to thermal screens 3A and 3B.
We compared the trend in U-values for the tested materials with the results of a previous study (Kim et al., 2009) conducted with the same materials. Kim et al. (2009) compared the variation in the inside temperature of the experimental box for each thermal screen material when the same heating was provided. They observed that material 7 recorded the highest inside temperature, and therefore, the lowest U-value. Material 7 had higher thermal conductivity and was less thick than materials 4B, 4A, 5, 6, and 9. Better performance has been noted for materials with low thermal conductivity (Kumar and Suman, 2013), and those with higher thickness will show less heat loss. We can conclude that, materials 4B and 4A will show the better performance than others as the results noted less U-values than the others.
The U-value calculation by BES model is highly dependent on thermal properties of the material. Prior to this study, validated data for thermal screen properties were lacking. In this study, we used thermal properties of different thermal screen materials provided in a previous study and presented our results accordingly. Our future work will include measurements of the properties of different thermal screens available in the market and calculation of their U-values to help farmers select the best thermal material from among them.
