

Introduction
Materials and Methods
1. Growing conditions
2. Irrigation treatment
3. Measurement of plant growth parameters
4. Measurement of fruit growth parameters
5. Statistical analysis
Results and Discussion
Conclusion
Introduction
Irrigation is one of the most important factors for the production of horticultural crops. The optimal supply of irrigation water is a key feature for high horticultural productivity with efficient water use, and the reduction of negative impact due to the percolation and leaching of excess water (Zou et al., 2013; Seidel et al., 2017). The drip irrigation method is considered a possible solution to facing water scarcity problems and increasing water use efficiencies in crop production (Van der Kooij et al., 2013; Ortega-Reig et al., 2017). Tomato is a horticultural crop, having a large production volume globally. The cultivated area of tomatoes in Korea was 6,058 hectare (ha) which was the second- largest cultivated area among horticultural crops in the greenhouse, and the total production was 388,657 tons (MAFRA, 2020). Notably, tomato cultivation in Korea was 100% converted into controlled agriculture from traditional methods in 2010. After conversion, the average production of tomato per hectare is around 65 tons (61.6 to 70.7 tons), showing a difference depending on the year. Nowadays, growers need a stable production system including irrigation management in the protected greenhouse to increase the quality and yield of tomatoes.
Different solid substrates are adequate as a growing medium providing the necessary support for plant root structure. Substrate culture has advantages, for example, controlling the root environment and facilitating the stable production of high-quality vegetables and fruits (Arancon et al., 2015; Lim et al., 2020; Majid et al., 2021). In 2018, the total cultivated area of controlled agriculture in Korea was 3,409 ha with 87.7% using substrate culture (MAFRA, 2020). Furthermore, the irrigation method is non-circulating in substrate culture, requiring a continuous water supply with nutrients (Arancon et al., 2019). Sometimes, NaCl, KCl, or seawater are applied to control the EC of the growing medium (Park and Kim, 2002; Seo and Kim, 2004; Choi et al., 2017). Moreover, after water consumption by plants, discharge drainage causes environmental pollution because of its chemical features (Grewal et al., 2011; Kumar and Choi, 2014). For this reason, irrigation management is crucial to control the root environment as well as the physical and chemical properties of the growing substrate (Rouphael et al., 2006).
Korean farms use different solid substrates for plant cultivation such as coir (35.1%), perlite (29.1%), rock wool (10.0%) and other (20.9%) (MAFRA, 2020). As a growing medium, perlite takes the attention of the growers because of its high permeability, low buffering capacity, and ease to control plant’s root zone environment (Lee at al., 2010; Silber et al., 2010) In addition, perlite adsorbs fewer inorganic ions, and growers are able to use it for a long time compared to coir and rock wool medium (Asaduzzaman et al., 2013). The amount of water present in the root zone of a plant is a vital factor for the plant’s development. Excess and deficiency of water adversely affected plant physiological activities which lead to decreased plant growth and productivity (Danso et al., 2015; Phukan et al., 2016). Researchers showed that the fruit setting on different horticultural crops greatly reduced under water scarcity and water logging conditions, and fruit drop was increased (Williams, 2012; Khattab et al., 2012; Klein et al., 2015; Zhen et al., 2020). Fruit quality also highly depends on water availability in the root zone in terms of total ascorbic acid, soluble solid, acidity and color index (Suárez et al., 2010; Nangare et al., 2016; Rasheed et al., 2018; Ren et al., 2021).
Tomato is a nutritious food with soluble solids content, which is one of the main features of its quality (Beckles, 2012; Sagor et al., 2016). Soluble solids content in tomatoes highly depends on variety and cultivation method, including intercultural operation and moisture content in the root zone (Nuruddin et al., 2003; Ripoll et al., 2016; Bertin and Genard, 2018). The amount of irrigation affects fruit yield, color, flavor, and soluble acid content in tomatoes (Gao et al., 2019). In substrate medium, minimizing the volume of irrigation is an effective technique to improve the soluble solids content of fruits (Li et al., 2001; Choi et al., 2018). However, previous studies reported that the improvement of soluble solids content in fruits by reducing the amount of irrigation sometimes suppressed plant water absorption, increased blossom–end rot, and decreased water use efficiency (Park and Kim 2002; Li et al., 2001; Kang et al., 2006). So, proper management of irrigation volume in tomato plants is very crucial for the growers to get profitable production from a substrate culture. But related information is still limited in Korea and globally. For this reason, this experiment was conducted to investigate the effect of irrigation volume on plant growth characteristics, yield, and soluble solids content of tomatoes grown in the substrate using perlite.
Materials and Methods
1. Growing conditions
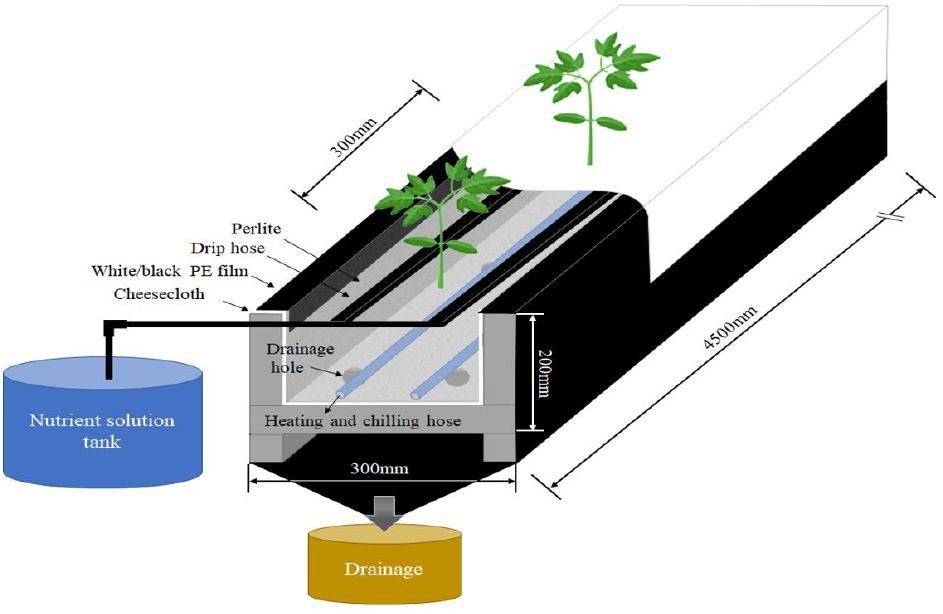
This experiment was conducted in a greenhouse (width 12.5 m × length 70 m × height 460 cm, covered by transparent plastic sheet) located in Sinbuk-eup, Chuncheon-si, Korea. Large size tomato (Solanum lycopersicum L.) seeds (cv. Saekomi, Boonong Seed Company, Korea) were sown on 24 October 2019. Seedlings were grafted with rootstock ‘Tank’ (Boonong Seed Company, Korea) on 7 December 2019. Healthy grafted seedlings (plant height 20 – 23 cm, around 10 leaves) were transplanted into growing beds on 4 January 2020 for cultivation in 100% perlite medium where 80% were large sized (2.5 – 5.0 mm) and 20% were small-sized (1.2 – 2.0 mm). Seedlings were planted in the beds (Fig. 1) at 30 cm of intervals and grown until 6 June 2020. Each bed length was 45 m and the width was 30 cm. The height of the growing bed was 20 cm. Heating and chilling hoses (set at the bottom of the bed) were used for temperature regulation in the growing bed. Light, temperature, and humidity in the greenhouse were measured using a data logger (WatchDog 1450, Spectrum Technologies, Aurora, IL, USA) at 50 cm height. During the cultivation period, the daily average amount of light in the greenhouse was 836.1 J·cm-2·d-1, the average daily temperature was 20±2 °C and the relative humidity was 65±3%. Plants were grown by one stem training, and after the 7th flower cluster bloomed (April 10), the top three leaves were left and pinched.
2. Irrigation treatment
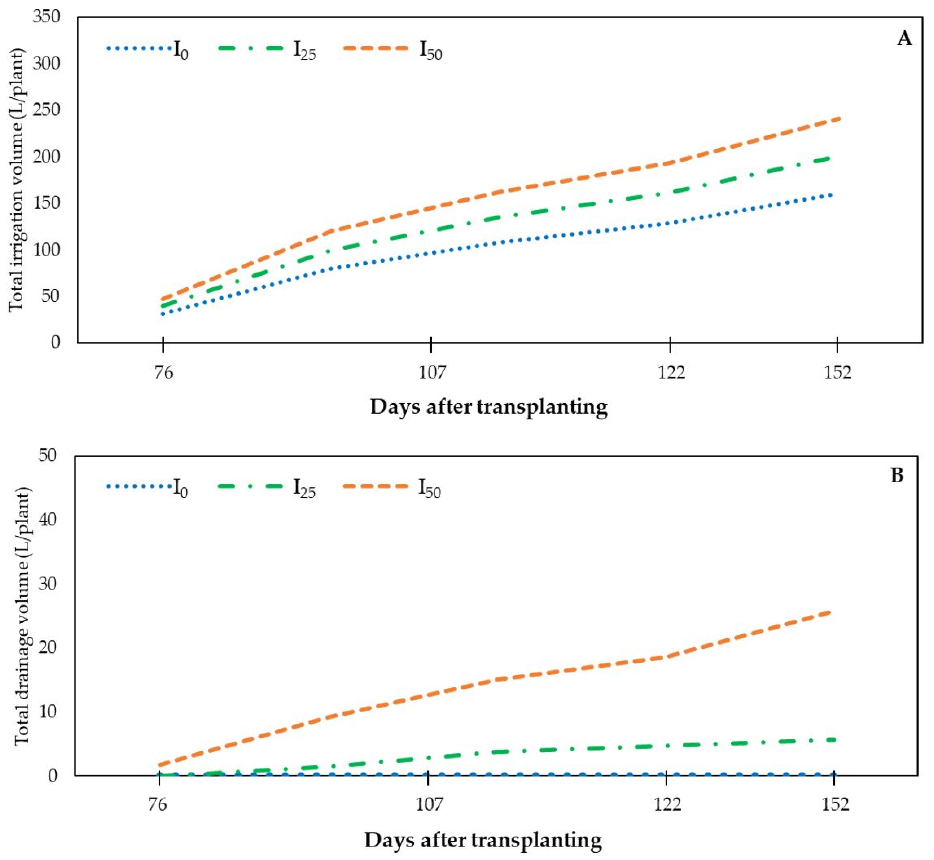
We applied irrigation water mixed with nutrients, preparing and using the Yamazaki tomato nutrient solution (N-P-K-Ca-Mg = 7.7-2.0-4.0-3.0-2.0 me·L-1, Mie, Japan). Irrigation operation was done with drip-hose lines (diameter 13 mm, Netafim, Korea) on the bed to supply water with nutrients in a non-circulating way. Applications consisted of three- different irrigation treatments: I0, I25 and I50 (Fig. 2A). The I0 treatment was selected to ensure no or limited drainage (Fig. 2B). Compared to the I0 treatment, the 25% and 50% larger amounts of irrigation were followed up corresponding to the I25 and I50 treatments (Fig. 2A). The number of two, three and four drip hose lines were used for controlling irrigation intensity in I0, I25 and I50 treatments respectively. Every bed has fifteen plants. We monitored the water volume for irrigation in a timer-controlled manner (up to 130 mL for one drip hose line at 40-60 min intervals based on weather during the day 8 am to 5 pm) adjusting the EC and pH levels of irrigation with the nutrient solution control system (Netaplex, Netafim, Korea). EC level of irrigation water at the beginning of transplantation was 2.5-2.6 dS·m-1, and from 20 May 2020, gradually decreased to 2.2 dS·m-1, adjusting the pH value of the irrigation water to 5.9 – 6.1 for the entire period. Drainage water from every bed was collected by using a pipe in the bottom of the bed and stored in a container through a funnel (Fig. 1).
3. Measurement of plant growth parameters
At the vegetative stage of the plant (80 days after treatment), we measured plant growth characteristics. Plant height, leaf length, and leaf width were measured using a ruler. We measured the chlorophyll concentration in the upper- leaves of the plant (three fully opened, healthy leaves were selected from a plant and made an average, and each leaf obtained was the average of 3 readings from the upper side of the leaf blade) with a chlorophyll meter (SPAD 502, Minolta, Japan). Measures of stem diameter were at 30 cm from the base of the plant using a digital caliper 117 (CD-20APX; Mitutoyo Corp., Kanagawa, Japan).
4. Measurement of fruit growth parameters
Every day we harvested the tomatoes from 23 March 2020 to 5 June 2020; the sequence of fruit harvest was at three different clusters during the treatment period for the analysis of fruit characteristics on the 111th, 132nd, and 143rd days after treatment. Fruit color reflected by tomato was measured by TES 135A colorimeter (TES Electrical Electronic Co. Ltd., Taipei, Taiwan) and described in terms of hunter L, a, and b values. ‘L’ denotes brightness, ‘+a’ denotes red, ‘-a’ denotes green, ‘+b’ denotes yellow, and ‘-b’ denotes blue. We measured the firmness of fruit with a digital fruit hardness tester FR-5105 (Lutron Electronic Enterprise Co. Ltd., Taipei, Taiwan). The above was done by compression with a three mm-diameter cylindrical probe, measuring the maximum compression force (just at the moment when the device penetrates the epicarp) in Newtons (N).
After measuring the firmness, every fruit were cut into eight pieces and made juice using mortar and pestle for measuring soluble solids content (ºBrix) and acidity. Digital pocket refractometers ATAGO PAL-1 (Atago Co. Ltd., Tokyo, Japan) was used for measuring soluble solids content and PAL-BX/ACID1 (Atago Co. Ltd., Tokyo, Japan) was used for measuring acidity (%) in tomatoes.
The number of fruits and fruit weight were measured. Fruit yield was calculated (excluding those fruits that were less than 100 g and deformed). fruit yield per plant was computed by summing up the fruit weight (g) from each harvest of each plant and it is presented as the average of plants per treatment. The fresh weight of the fruit was measured using an electronic balance. The dry weight of the fruit was determined after drying the samples in an oven at 60°C to a constant weight.
The water content, dry matter percentage, water consumption and water use efficiency of fruit were calculated by the following formula:
Water content (%) = {(fresh weight ‒ dry weight) / fresh weight} × 100
Dry matter (%) = (dry weight / fresh weight) × 100
Water consumption of fruit (mL·g-1·plant-1) = applied irrigation volume (mL·plant-1) / total fruit weight (g·plant-1)
Water use efficiency of fruit (g·L-1·plant-1) = total fruit weight (g·plant-1) / applied irrigation volume-leachate (L· plant-1).
5. Statistical analysis
Effects of treatments were analyzed using SAS program (Statistical Analysis System, version 9.3, SAS Institute, Cary, NC, USA). Significant differences among the means were examined using ANOVA (Analysis of variance) followed by Duncan’s multiple range test (DMRT) at p ≤ 0.05. OriginLab 10.0 software (OriginLab, Northampton, MA, USA) was used for principal component analysis (PCA).
Results and Discussion
Different levels of irrigation treatments affected the plant growth characteristics of the tomato plant (Table 1). Plant height, leaf -length, and leaf width were significantly higher in plants irrigated at 25% (I25) or 50% (I50) higher volume than in control (I0). Furthermore, stem diameter and chlorophyll content did not reflect significant differences among treatments. Decreased plant height, leaf length, and leaf width in I0 treatment may be an adaptive role of plants under limited water. Other studies (van Iersel and Nemali, 2004; Alvarez et al., 2009) showed that plant growth is generally decreased when the availability of soil water is limited. In addition, deficit irrigation greatly impacts on plant height compared to leaf width, resulting in a greater reduction in vertical growth than in horizontal growth. An et al. (2005) reported that a low drainage ratio is good for plant growth; in contrast, long-term low drainage causes water stress conditions and inhibits nutrient absorption by roots, causing a decline in plant growth and development. Limited water decreases the plant growth of tomato plants by the reduction of transpiration (Imana et al., 2010).
Table 1.
Effect of irrigation volume on plant growth characteristics of tomato at 80 days after treatment.
| Treatment |
Plant height (cm) |
Stem diameter (mm) |
Leaf length (cm) |
Leaf width (cm) |
Chlorophyll content (SPAD value) |
| I0 | 170.6z by | 8.9 a | 36.5 b | 32.5 b | 44.1 a |
| I25 | 195.5 a | 9.6 a | 52.3 a | 47.5 a | 40.9 a |
| I50 | 191.7 a | 10.1 a | 52.8 a | 51.2 a | 42.2 a |
Furthermore, plant height, leaf length, and leaf width were not significantly different between I25 and I50 treatments (Table 1). Moreover, irrigation and drainage volumes were lower in I25-treated plants compared to I50 treatment (Fig. 2). Kim et al. (2011) showed that tomatoes grown in perlite medium under different watering amounts in one-time irrigation using different drainage ratios affected the growth and development of plants. In addition, they reported high irrigation with a drainage ratio below 15% was favorable for the plant. In this experiment, the growth of the plant was comparatively better in the I25 treatment than in others (Table 2) with a low drainage ratio (Fig. 2B). Furthermore, Kim et al. (2011) reported that root development and yield were highest when the drainage ratio was stable. Jeong et al. (2002) reported that the drainage ratio in a substrate culture was decreased when they applied the total amount of water by multiple irrigations (more frequent) compared to one irrigation (less frequent) in a day. Alvarez et al. (2009) noted that the application of proper irrigation saves water and reduces unwanted excessive growth of plants. In this experiment, the total amount of supplied irrigation per plant was 160.9 L, 201.2 L, and 241.4 L for I0, I25 and I50 treatments, respectively (Fig. 2). So, after the treatment period, the irrigated water difference per plant between I0 and I25 irrigation treatment, besides the I25 and I50 irrigation treatment, was around 40 L. In addition, around 80 L of irrigated water per plant was the difference between I0 and I50 irrigation treatment. This amount of difference is considered crucial to making cost-effective production by optimizing water use efficiency and irrigation cost.
Table 2.
Effect of irrigation volume on fruit characteristics of tomato in perlite hydroponics.
| Treatment | Hunter value |
Firmness (N/ϕ5 mm) |
Dry matter (%) |
Water content (%) | ||
| L | a | b | ||||
| 111 DAT | ||||||
| I0 | 42.0z ay | 22.2 a | 21.8 a | 23.0 a | 8.5 a | 91.5 b |
| I25 | 41.2 a | 22.8 a | 18.6 a | 16.9 b | 6.1 b | 93.9 a |
| I50 | 43.4 a | 18.2 b | 19.1 a | 22.7 a | 5.7 b | 94.3 a |
| 132 DAT | ||||||
| I0 | 40.8 a | 30.0 a | 19.9 a | 16.5 a | 8.4 a | 91.6 b |
| I25 | 38.5 a | 26.4 b | 14.8 a | 12.1 a | 6.5 b | 93.6 a |
| I50 | 36.3 a | 23.5 b | 12.2 a | 12.7 a | 5.7 b | 94.3 a |
| 143 DAT | ||||||
| I0 | 33.7 a | 22.3 a | 15.8 a | 14.0 a | 8.7 a | 91.3 b |
| I25 | 36.4 a | 22.5 a | 13.8 a | 13.2 a | 7.1 b | 92.9 a |
| I50 | 36.2 a | 21.0 a | 13.0 a | 15.6 a | 6.6 c | 93.4 a |
The fruit characteristics of tomatoes were examined from three different harvesting clusters when harvesting was done on 111th, 132nd and 143rd days of treatment which correspond to 2nd and 3rd clusters, respectively in Table 2. It was observed that hunter value ‘a’ in 111th and 132nd days after treatment harvested tomatoes were significantly greater in the I0 treated plants than in I25 and I50 treated plants (Table 2). However, there was no significant difference in hunter value ‘L’ and ‘b’ by the treatments. The hunter ‘L’, ‘a’ and ‘b’ values of tomato were used for color determination. Generally, tomatoes’ visual appearance and color strongly influence consumer opinion about the fruit quality. Hunter ‘L’ and ‘a’ indicate the lightness and redness of a fruit, respectively. The degree of redness in a tomato is mainly attributed by the accumulation of lycopene pigments (Nisha et al., 2011). Lycopene concentration in tomatoes is an indicator of quality and is beneficial for consumers because lycopene has antioxidant properties (Shi et al., 2007).
Dry matter of tomatoes was highest in all clusters of tomatoes treated with I0 treatment (Table 2). Boas et al. (2017) reported that water deficit reduced the yield of tomatoes but increased their dry matter content. However, the moisture content of 111th and 132nd days after treatment harvested tomatoes was lower in I0-treated plants than in other treatments (Table 2).
Furthermore, the soluble solids content was significantly higher in all harvested clusters of tomatoes in I0-treated plants compared to those grown in I25 and I50 treatments (Fig. 3A). Sugar accumulation in fruit is associated with enzyme activities, specifically sucrose-metabolizing enzymes (Zhang et al., 2012). Ripoll et al. (2014) reviewed that water deficit stimulates secondary metabolism and enzymatic activities of plants to enhance plant defense mechanism and resulted in soluble solids content increased in fruit. Maybe the lower irrigation is a reason for greater soluble solids content in I0-treated plants (Figs. 2A, 3A). Choi et al. (2016) showed that low irrigation with a low drainage ratio increased the soluble solids content in tomatoes. The acidity of tomatoes was significantly higher in I0-treated plants than those grown in I25 and I50 treatments in all harvested clusters (Fig. 3B). Low irrigation in I0 treatment may be the reason for high acidity in I0-treated tomatoes. Subramanian et al. (2006) showed that the acidity of tomatoes was increased under water deficit conditions compared to well-watered when plants are grown in soil. High soluble solids content and acidity in I0-treated tomatoes may be related to each other. Huang et al. (2022) reported that the acidity and soluble solids content of apples were increased under deficit irrigation. Furthermore, the soluble solids content and acidity accumulation of tomatoes both showed a similar trend when plants were grown in a soilless system at different potassium levels (Caretto et al., 2008).
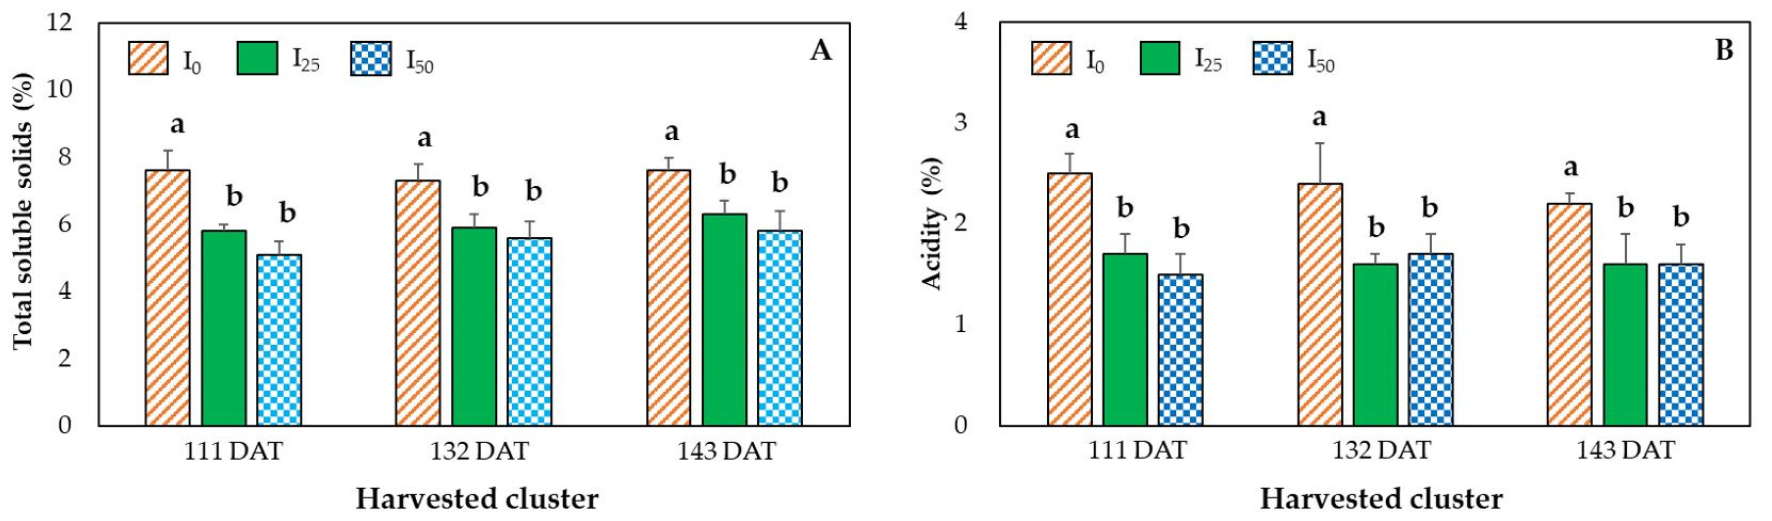
Fig. 3.
Effect of irrigation volume on soluble solids content (A) and acidity (B) of fruits. Lines above the bar represent the standard deviation of the mean (n = 5). Means above each bar followed by the same letters are not significantly different by Duncan’s multiple range test (DMRT) at p ≤ 0.05. DAT = Days after treatment.
The number of big-size fruits (greater than 180 g) was lower but small-size fruits (<100 g) was higher in I0-treated plants than in those grown in other treatments (Table 3). On the other hand, the number of big size fruits was highest and the number of small size fruits was lowest in plants those were grown in I25 treatment. There was no significant difference in the total number of harvested fruits among different irrigation I0, I25 and I50.
Table 3.
Effect of irrigation volume on number of fruits per plant grown in perlite medium.
| Treatment | Number of fruits per plant | |||
| <100 g | 101-180 g | >180 g | Total | |
| I0 | 6.2z ay | 20.6 a | 6.8 c | 33.6 a |
| I25 | 1.0 c | 15.6 b | 17.6 a | 34.2 a |
| I50 | 4.2 b | 18.8 a | 12.4 b | 35.4 a |
The average weight of fruits was lowest in those plants treated with the I0 treatment (Fig. 4). In addition, the total yield reflected the lowest value in I0 treated plants. Nevertheless, our results suggest that the observed average weight of fruit and fruit yield of tomatoes were not statistically different between the I25 and I50 treatments. Hwang et al. (2012) showed that the average weight of tomatoes decreased with a small amount of irrigation treatment than in the control treatment in hydroponic culture (rock wool medium). Kim et al. (2011) reported good growth of tomatoes in perlite medium when the drainage ratio was less than 15%. Our findings are in line with their findings. In this experiment, the average weight of I25-treated fruits was slightly greater when compared to those grown in I50 treatment (Table 4) with low drainage in I25 treatment compared to I50 because of lower irrigation.
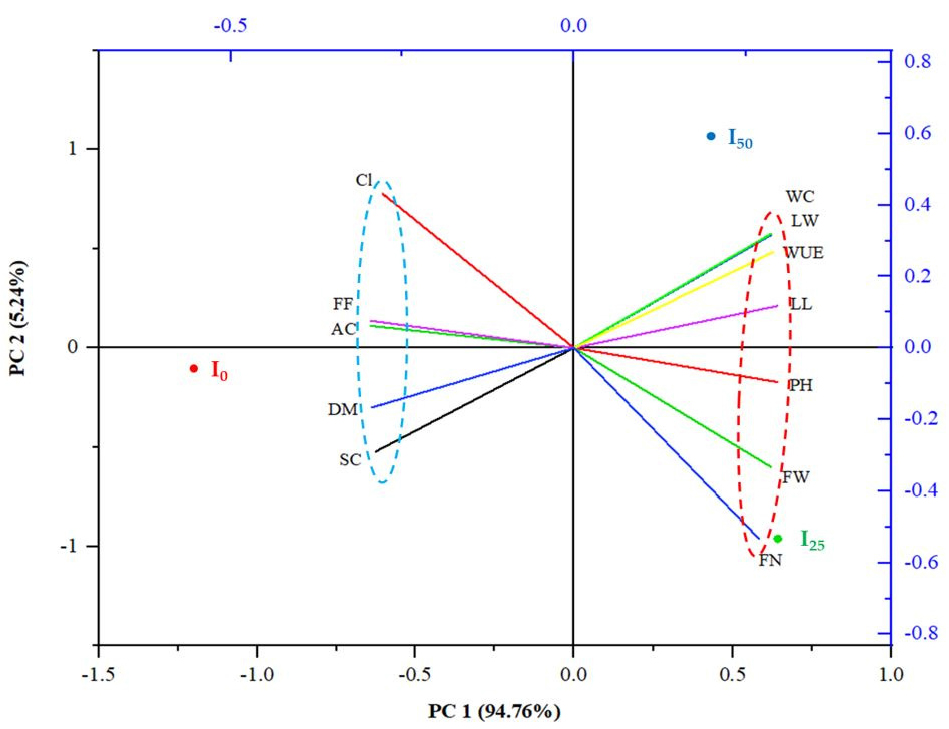
Fig. 4.
Principal component analysis (PCA) to elucidate the variable treatment relationships among the three treatments. The lines starting from the central point of the biplots in the PCA have the attributes to display the negative or positive associations of the variables, and their proximity specifies the degree of correlation with specific treatment. PH, plant height; LL, leaf length; LW, leaf width; CL, chlorophyll content; FN, fruit number; FW, fruit weight; FF, fruit firmness; SC, soluble solids content; AC, acidity; DM, dry matter; WC, water content; WUE, water use efficiency.
Table 4.
Effect of irrigation volume on average fruit weight, total fruit weight, water consumption and water use efficiency of tomato.
The water consumption of plant was 40.2, 34.7, and 38.1 mL·g1·plant-1 in I0, I25 and I50 treatment, respectively (Table 4). In addition, the water use efficiency of plant was 25.4, 30.7, and 31.7 g·L-1·plant-1 in I0, I25 and I50 treated plants. Notably, the water use efficiency of plant was lowest in the I0 treatment. However, the water use efficiency of plant was not significantly different between the I25 and I50 treatments.
We applied a principal component analysis (PCA) to uncover the correlation of the different growth characteristics of plant and harvested fruits with the irrigation volume treatments (Fig. 4). The PCA is a multivariate data analysis to create implicit artificial variables by combining highly correlated variables. Due to the different units of measure between variables, variables with large variances can be interpreted as important variables (Kim et al., 2013). The PCA, however, best explains the variance of the entire data. The elements of PC1 and PC2 described 94.76% and 5.24% of the variability in the data, respectively. The PCA biplot illustrated a clear separation of the parameters. The result showed that soluble solids content and acidity were positively correlated, and their response is closer to the I0 treatment than others. Other research also showed that soluble solids content and acidity in fruits has a positive correlation (Anthon and Barrett, 2012; Quinet et al., 2019). In addition, there is a positive relation between dry matter and the soluble solids content of tomatoes (Table 4). In other studies, with fruits, the dry matter correlated positively with soluble solids content (Ścibisz et al., 2011; Turhan et al., 2011). Furthermore, the graph shows that plant height, fruit weight, fruit number have a positive correlation being closer to I25 and I50 treatments when compared to the I0 treatment (Fig. 4). The biplot also showed that water content of fruits maintained a negative correlation with soluble solids content and acidity.
Conclusion
Although soluble solids content and acidity were higher in I0-treated plants, it is not preferable for plant growth and yield of tomatoes. I25 treatment was the most effective because growth characteristics, production of big fruit size, fruit yield, and water use efficiency were better and not significantly different compared to the I50 treatment. In addition, approximately a 40 L irrigation difference per plant was between the I25 and I50 treated plants. So, considering the yield and quality of fruits and irrigation amount the I25 treatment is more helpful to reduce water and nutrient usage than the I50 treatment. In future research, we will investigate the irrigation effect on tomato plants grown in perlite and other growing mediums, as well as, their impact on physiological response and the bioactive compounds in fruits.
