Protected Horticulture and Plant Factory. 30 April 2016. 106-110
https://doi.org/10.12791/KSBEC.2016.25.2.106

ABSTRACT


MAIN

서 론

번행초과인 common ice plant는 다육식물로 아프리카, 서아시아와 유럽 등이 원산지이다. 잎과 줄기는 황산화 활성 능력(Agarie 등, 2009)이 있으며, 최적의 환경조건 을 갖춘 완전제어형 식물생산시스템에서 생산하기 위한 연구가 많이 시도되고 있다(Cha 등, 2014).

작물 생육 모델 중 하나인 선형지수(expolinear) 모델은 많은 작물에 적용되어 왔다(Dennett와 Ishag, 1998; Goudriaan과 Monteith, 1990; Ishag 와 Dennett, 1998; Lee 등, 2003). 선형지수 생육 모델식의 요인에는 작물 생장율(crop growth rate, CGR), 상대생장률(relative growth rate, RGR)과 시간이 포함된다. 선형지수 생육 모 델식에서 시간은 환경에 영향을 받기 때문에, 시간함수보 다는 다른 환경함수로 표기하는 경우가 있다. Lee 등(2003)는 온실과 같은 작물생산시스템에서 선형지수 생육 모델이 광사용효율(light use efficiency, LUE), 엽면적지 수(leaf area index, LAI)와 일사량당 상대생장률로 표기 될 수 있다고 하였다. 또한 이러한 요인 함수들은 재식밀 도에 영향을 받는다고 보고하였다(Goudriaan과 Monteith, 1990; Lee 등, 2003; Papadopoulos와 Pararajasingham, 1997). 그러나 지상부와 지하부 환경이 완전제어되는 작 물생산시스템에서는 시간함수로 선형지수 함수를 이용하 는 것이 좋을 것으로 판단된다. 따라서, 재식밀도에 따라 생육량을 알 수 있다면, 작물 생육을 예측할 수 있고 수 확시기도 예측할 수 있을 것이다.

재식밀도는 작물의 생육과 수량에 영향을 주는 중요한 요인 중 하나이다(Kahn 등, 1997; Leskovar 등, 2000; Maynard와 Scott, 1998; Reiners와 Riggs, 1999; Schultheis 등, 1999). 일반적으로 재식밀도가 증가할수록 단위면적당 수량도 증가한 반면에 식물체당 상품수량은 감소한다라는 보고가 있다(Kulter 등, 2001; Locascio와Stall, 1994; Motsenbocker, 1996). 작물 생산 시스템을 설계하는 데 있어서 생육과 상품수량을 고려한 적정 재 식밀도를 제시해야 하지만, 생육단계에 따라 재식밀도를 변화시킴으로서 작물의 생육과 생산성을 예측할 필요도 있다. 그러나, 대부분의 식물공장 시스템은 재식밀도가 정해져 있는 고정 시스템이 많기 때문에 생육단계에 따 른 재식밀도를 변화시키기 위해서는 이동형 시스템이 필 요하다고 생각된다. 재식밀도가 고정된 시스템에서 재식 밀도에 따른 생육상태로 작물생산성, 상품수량 및 수확 시기를 예측할 수 있는 모델식 개발은 중요하며, 이러한 목적을 위해 작물 생리학이나 작물 생육 제어와 같은 기술을 가진 생육 모델 등이 이용될 수 있다(Huevelink, 1995; Lee 등, 2003; Marcelis 등, 1998).

본 연구의 목적은 완전제어형 식물공장에서 수경재배 한 common ice plant의 생육과 생산성을 손쉽게 예측하 기 위해 재식밀도에 따른 생육량을 예측하고 생육에 대 한 수확시기를 손쉽게 알 수 있는 재식밀도-생육-수확 (Planting density-Growth-Harvest, PGH) 도표를 개발하 기 위함이다.

재료 및 방법

1. 식물재료

자가채종한 common ice plant 종자를 우레탄 스폰지 (2.5×2.5×2.5cm)에 파종하였다. 실험은 2012년 5월 25일 파종하여 6월 12일 제주대학교에 설치한 완전제어형 식 물 생장 시스템(700×500×300cm, L×W×H)에서 수행하 였다.

2. 완전제어형 식물 생산 시스템

인공광원으로 3파장 형광등(55W, Philips Co. Ltd., Amsterdam, the Netherlands)을 사용하였다. 광도 (photosynthetic photon flux, PPF), 온도, 상대습도, CO2 농도는 각각 광도 센서(LI-190, Li-cor, Lincoln, Nebraska, USA), 온습도 센서(HMP45AC, Campbell Scientific, Logan UT, USA)와 CO2 센서(GMP222, Vaisala, Helsinki, Finland)로 측정하였다. 광도 설정은 180μmol·m-2·s-1로 12시간 일장으로 설정하였다. 실내온 도와 상대습도 및 CO2 농도는 각각 20~25°C, 60~70% 와 600~900μmol·mol-1로 관리하였다. 광도, 온도, 상대 습도, 이산화탄소 농도 자료는 데이터수집장치(CR-1000, Campbell Scientific, Logan UT, USA)를 이용하여 매 10분마다 평균하여 1시간마다 매일 수집하였다.

순환식 수경재배 방식인 박막수경(240×60×200cm, L×W×H) 시스템으로 10분 간격으로 배양액을 순환시켰 다. 본엽이 출현한 후부터 배양액을 공급해 주었으며, 매 1-2일 마다 배양액의 EC와 pH는 각각 1.0dS·m-1과 5.5-6.5로 관리하였다. 배양액은 실험종료까지 바꾸지 않 았다.

3. 재식밀도에 따른 생육과 수량

4가지의 재식밀도에 따라 생육과 수량을 분석하였다. 열간의 간격을 15cm로 고정한 후, 15×10cm(67plants/m2), 15×15cm(44plants/m2), 15×20cm(33plants/m2)와 15×25cm (27plants/m2) 재식거리로 실험하였다. 건물중은 건조기 (VS-1202D2, Vision Scientific, Korea)에서 72시간 70°C 에서 건조한 후 측정하였다.

실험설계는 완전임의배치법으로 설계하였으며, 통계처 리는 SAS 프로그램(Release 9.01, SAS institute Inc., Cary, NC. USA)을 이용하였으며, 모델식의 계수는 SAS 프로그램으로 Gauss-Newton 방법으로 찾았다.

4. 모델식 이용

작물 생육을 정량화하기 위해 선형지수(expolinear) 함 수를 사용하였다. 시간에 따른 건물중 변화는 다음과 같 이 계산하였다(Goudriaan과 Monteith, 1990).

(1)
W=Cm/ Rm·ln{1 + exp (Rm·(t − tb))}

여기에서, W는 단위면적당 건물중(g·m-2), t는 정식 후 일수, Cm는 작물생장률(CGR, g·m-2·d-1), Rm는 상대생장 률(RGR, g·g-1·d-1)과 tb는 생육이 직선이 되는 시점(lost time, d)이다.

(2)
Y = – 1.8+41.1 · SDW

여기에서, Y는 식물체당 생체중(g/plant)이고 SDW는 식 물체당 건물중(g/plant)이다.

결과 및 고찰

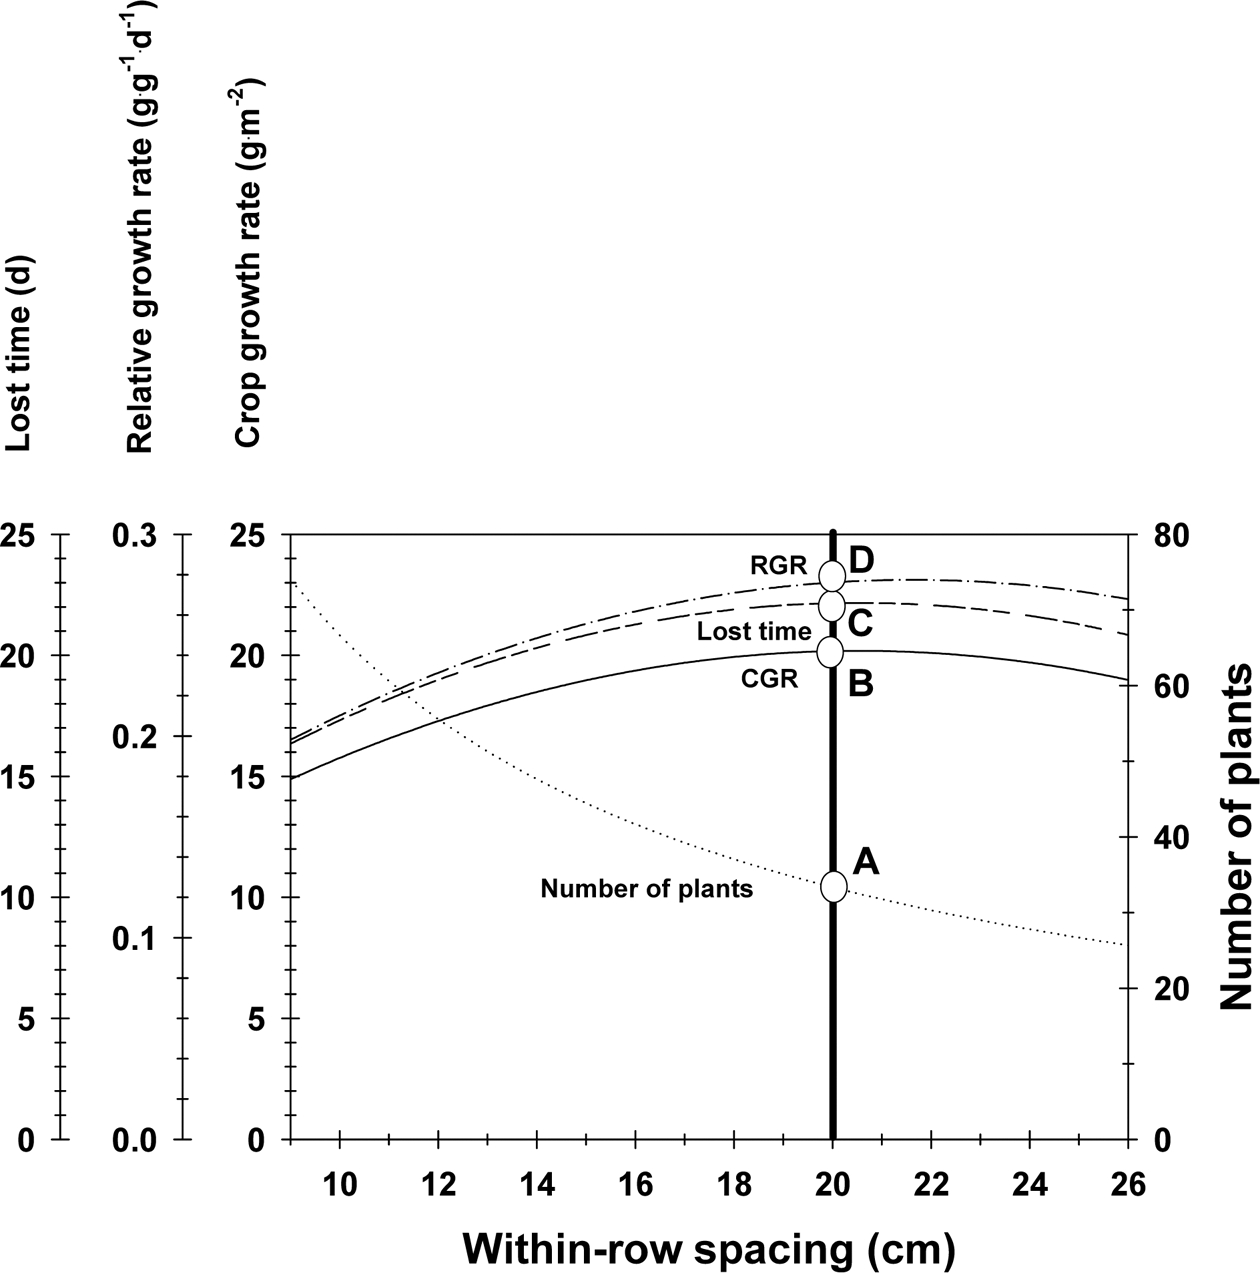
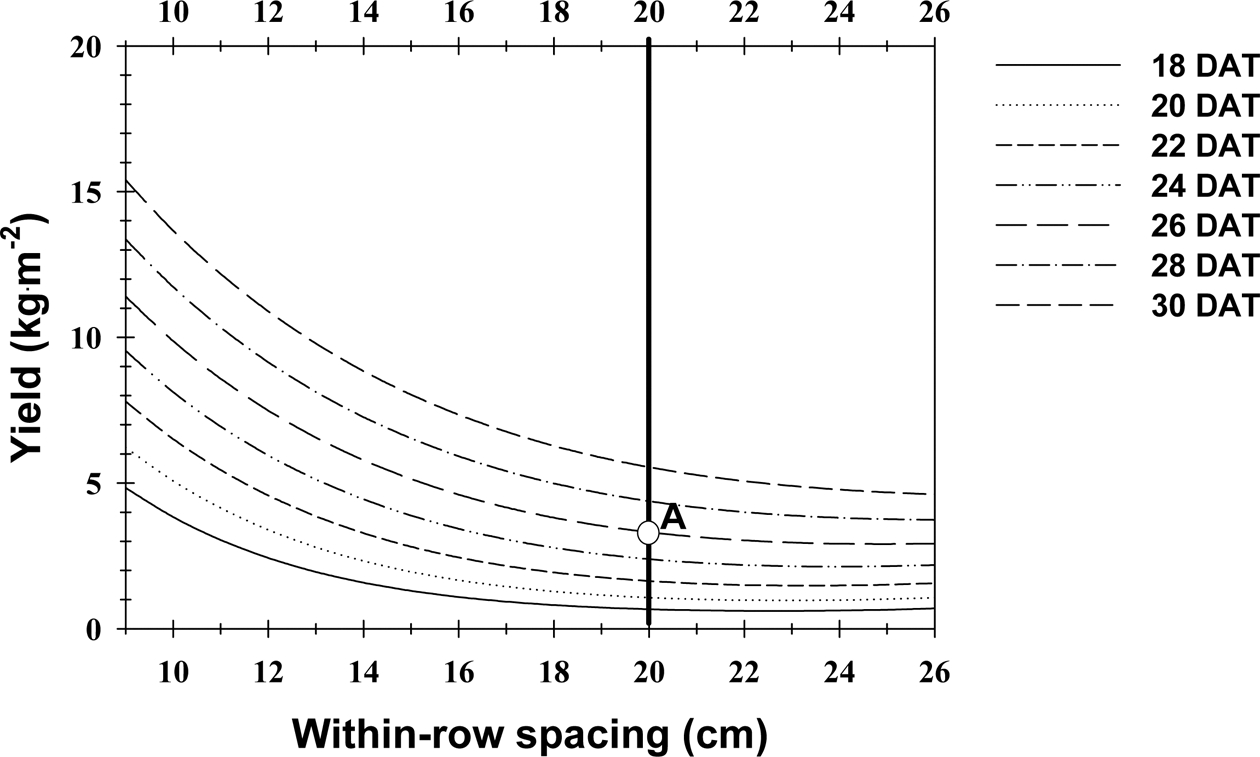
생육요인과 재식밀도와의 관계를 분석하였다. CGR, RGR과 lost time는 재식밀도에 따라 변하였으며, 변화 곡선은 이차 함수를 보였다. 등식 1를 바탕으로 한 이차 함수에서 CGR, RGR과 lost time의 최고값은 각각 열내 간격 21cm, 22cm와 21cm이었다(Fig. 1). 즉 최적의 재 식밀도는 열간 간격 15cm와 열내 간격 21cm임을 구할 수 있었다. 재식밀도가 증가할수록 어느 한계까지는 식 물체당 생체중과 건물중은 증가하는 경향이었으며(Fig. 2). 단위면적당 생체중인 수량 또한 같은 경향을 보였다 (Fig. 3). Reiners와 Riggs(1999)도 재식밀도가 높으면 높 을수록 적정 재식밀도까지 수량이 증가한다고 하였다.

https://cdn.apub.kr/journalsite/sites/phpf/2016-025-02/KSBEC-25-2-106/images/KSBEC-25-2-106_F1.jpg
Fig. 1.

Estimation of growth factors of common ice plant with planting density. A, B, C, and D indicate the number of plant, crop growth rate, lost time and relative growth rate at withinrow spacing = 20cm, respectively.

본 연구에서 Fig. 2와 Fig. 3를 통해 경제적인 측면에 서는 열간 간격 15cm와 열내 간격 10cm가 가장 좋았다. 그러나, 재식밀도가 높은 15×10cm 처리구에서 잎이 포 개짐과 측지 발생에 따라 상품이 나빠지는 경향을 보였 다(자료미제시). 등식 1를 통해 생육량이 좋은 적절한 재식밀도를 알았으나, Fig. 3에서 가장 높은 수확량을 보인 적절한 재식밀도와는 다른 결과를 보였다. 따라서, 적절한 재식밀도는 제시하기 위해서는 생육량과 상품률 를 고려하는 방법이 필요할 것으로 판단된다. 또한 common ice plant의 이용 목적에 따라서도 적절한 재식 밀도가 제시되어야 할 것이다.
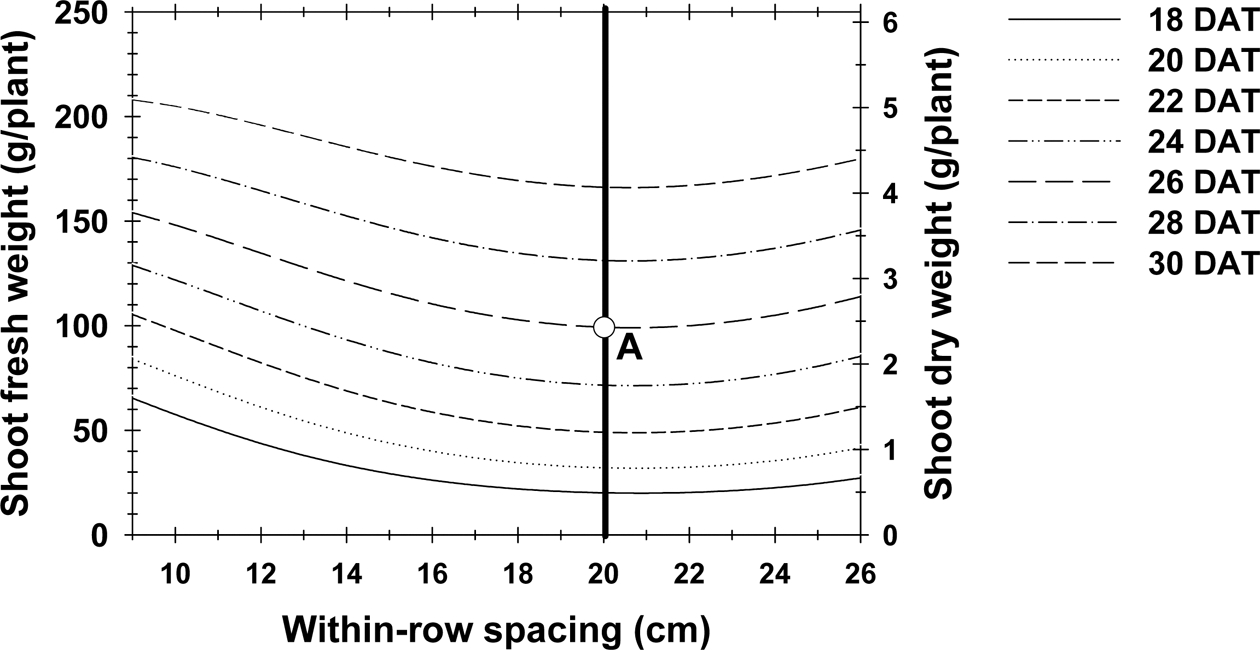
https://cdn.apub.kr/journalsite/sites/phpf/2016-025-02/KSBEC-25-2-106/images/KSBEC-25-2-106_F2.jpg
Fig. 2.

Relationship among shoot fresh weight per plant, shoot dry weight per plant, days after transplanting (DAT), and planting density. A indicate the harvesting time = 26 DAT and shoot dry weight per plant = 2.5g at within-row spacing (WRS) = 20cm and shoot fresh weight per plant at harvest = 100g, respectively. DAT means days after transplanting.

https://cdn.apub.kr/journalsite/sites/phpf/2016-025-02/KSBEC-25-2-106/images/KSBEC-25-2-106_F3.jpg
Fig. 3.

Relationship among the yield, day after transplanting (DAT) and planting density. A indicate the yield = 3.2kg·m-2 and harvesting time = 26 DAT at within-row spacing (WRS) = 20cm and shoot fresh weight per plant at harvest = 100g, respectively.

생육자료와 모델식을 기초로 PGH(Planting density- Growth-Harvest) 도표를 만들 수 있었다. 이 도표들(Figs. 1, 23)을 사용함으로써, 2가지 요인만 알고 있으면 쉽 게 CGR, RGR, lost time, 단위면적당 수량과 수확시기를 알 수 있다. 예를 들면, 열내 간격이 20cm이고 식물체당 생체중이 100g일 경우, Figs. 1, 23을 이용하여, 생육 요인과 수확요인들을 예측할 수 있다(Table 1).

Table 1.

Growth and harvest factors at within-row spacing = 20cm and fresh weight per plant at harvest = 100g (Figs.1, 2 and 3).

Growth factorHarvest factor

Within-row spacing20cmShoot fresh weight100g/plant
Planting density33plants/m2Shoot dry weight2.5g/plant
Crop growth rate20g•m-2•d-1Harvesting time26 DAT
Relative growth rate0.27g•g-1•d-1Yield3.2kg•m-2
Lost time22 days

DAT means days after transplanting.

재식밀도는 작물의 생육과 수량에 영향을 주는 요인 중 하나이다(Leskovar 등, 2000; Maynard와 Scott, 1998). 적정 재식밀도를 결정하기 위해서는 일사량, 재배시스템 과 품종 같은 다양한 요인들을 고려해야 한다(Cavero 등, 2001; Sanders 등, 1999). 또한 완전제어형 식물공장 시스템에서는 작물에 대한 적정 재배조건을 제시한다면, 이러한 도표의 활용도가 높아질 것으로 생각된다.

사 사

본 논문은 2010년 한국연구재단 신진연구지원사업 (연 구장비지원) (과제번호 : 1345115074)의 지원에 의해 이 루어진 것임.

References

1
Agarie, S., A. kawaguchi, A. Kodera, H. Sunagawa, H. Kojima, A. Nose, and T. nakahara. 2009. Potential of the common ice plant, Mesembryanthemum crystallinum as a new high-functional food as evaluated by polyol accumulation. Plant Prod. Sci. 12:37-46.
10.1626/pps.12.37
2
Cha, M.K., J.S. Kim, and Y.Y. Cho. 2014. Growth model of common ice plant (Mesembryanthemum crystallinum L.) using expolinear functions in a closed-type plant production system. Kor. J. Hort. Sci. Technol. 32:493-498 (in Korean).
10.7235/hort.2014.14013
3
Cavero, J., R.G. Ortega, and M. Gutierrez. 2001. Plant density affects yield, yield components, and color of direct-seeded paprika pepper. HortScience 36:76-79.
10.21273/HORTSCI.36.1.76
4
Dennett, M.D. and K.H.M. Ishag. 1998. Use of the expolinear growth model to analyze the growth of faba bean, peas and lentils at three densities: Predictive use of the model. Ann. Bot. 82:507-512.
10.1006/anbo.1998.0709
5
Goudriaan, J. and J.L. Monteith. 1990. A mathematical function for crop growth based on light interception and leaf area expansion. Ann. Bot. 66:695-701.
10.1093/oxfordjournals.aob.a088084
6
Heuvelink, E. 1995. Effect of plant density on biomass allocation to the fruits in tomato (Lycopersicon esculentum Mill.). Sci. Hort. 64:193-201.
10.1016/0304-4238(95)00839-X
7
Heuvelink, E. and L.F. M. Marcelis. 1989. Dry matter distribution in tomato and cucumber. Acta Hort. 260:149-157.
10.17660/ActaHortic.1989.260.8
8
Ishag, K.H.M. and M.D. Dennett. 1998. Use of the expolinear growth model to analyze the growth of faba bean, peas and lentils at three densities: Fitting the model. Ann. Bot. 82:497-505.
10.1006/anbo.1998.0708
9
Kahn, B.A., J.R. Cooksey, and J.E. Motes. 1997. Within-row spacing effects on traits of importance to mechanical harvest in paprika-type peppers. Sci. Hort. 69:31-39.
10.1016/S0304-4238(96)00981-8
10
Kultur, F., H.C. Harrison, and J.E. Staub. 2001. Spacing and genotype affect fruit sugar concentration, yield, and fruit size of muskmelon. HortScience 36:274-278.
10.21273/HORTSCI.36.2.274
11
Lee, J.H., J. Goudriaan, and H. Challa. 2003. Using the expolinear growth equation for modeling crop growth in yearround cut chrysanthemum. Ann. Bot. 92:697-708.
10.1093/aob/mcg19514514517PMC4244859
12
Leskovar, D.I., L.A. Stein, and F.J. Dainello. 2000. Planting systems influence growth dynamics and quality of fresh market spinach. HortScience 35:1238-1240.
10.21273/HORTSCI.35.7.1238
13
Locascio, S.J. and W.M. Stall. 1994. Bell pepper yield as influenced by plant spacing and row arrangement. J. Amer. Soc. Hort. Sci. 119:899-902.
10.21273/JASHS.119.5.899
14
Marcelis, L.F.M., E. Heuvelink, and J. Goudriaan. 1998. Modelling biomass production and yield of horticultural crops: A review. Sci. Hort. 74:83-111.
10.1016/S0304-4238(98)00083-1
15
Maynard, E.T. and W.D. Scott. 1998. Plant spacing affects yield of 'Superstar' muskmelon. HortScience 33:52-54.
16
Motsenbocker, C.E. 1996. In-row plant spacing affects growth and yield of pepperoncini pepper. HortScience 31:198-200.
10.21273/HORTSCI.31.2.198
17
Papadopoulos, A.P. and S. Pararajasingham. 1997. The influence of plant spacing on light interception and use in greenhouse tomato (Lycopersicon esculentum Mill.): A review. Sci. Hort. 69:1-29.
10.1016/S0304-4238(96)00983-1
18
Reiners, S. and D.I.M. Riggs. 1999. Plant population affects yield and fruit size of pumpkin. HortScience 34:1076-1078.
10.21273/HORTSCI.34.6.1076
19
Sanders, D.C., J.D. Cure, and J.R. Schultheis. 1999. Yield response of watermelon to plant density, planting pattern, and polyethylene mulch. HortScience 34:1221-1223.
10.21273/HORTSCI.34.7.1221
20
Schultheis, J.R., S.A. Walters, D.E. Adams, and E.A. Esters. 1999. In-row plant spacing and date of harvest of 'Beauregard' sweet potato affect yield and return on investment. HortScience 34:1229-1233.
10.21273/HORTSCI.34.7.1229
페이지 상단으로 이동하기