

Introduction
Materials and Methods
1. Planting material and Experimental site
2. Cultivation Conditions and management
3. Supplemental LED
4. Growth and yield assessment
5. Water soluble vitamin analysis
6. Statistical Analysis
Results and Discussion
1. Environmental conditions in the greenhouse
2. Effect of LED supplemental lighting regime on the growth and yield of paprika
Conclusion
Introduction
Paprika (Capsicum annuum L.) is a high-value horticultural crop widely cultivated in greenhouse environments where temperature, humidity, and light can be precisely managed. In Korea, paprika is one of the most economically important fruit vegetables produced under protected cultivation, with an annual output of approximately 80,000 tons from about 700 hectares of cultivated area. In addition to meeting domestic demand, paprika is a key export value crop, particularly to Japan, contributing significantly to agricultural trade income (Korea Agro-Fisheries & Food Trade Corporation, 2024). Paprika fruit is rich in antioxidants, carotenoids, and vitamins, including vitamin C and various B-complex vitamins, making it popular as a health-promoting food product (Deepa et al., 2006; Howard et al., 2000). Despite the advantages of greenhouse cultivation, paprika production during the winter season remains vulnerable to reduced solar radiation. Low temperatures, frequent cloudy days, and shorter daylight hours severely limit photosynthesis and plant productivity. Furthermore, the use of thermal curtains and condensation-prevention materials to reduce heating costs further decreases light transmission by more than 20% on average (Papadakis et al., 1992). As a high light-requiring crop with a light saturation point of approximately 800-1,000 μmol·m-2·s-1 and a compensation point around 200 μmol·m-2·s-1, paprika is particularly susceptible to the negative effects of insufficient light during winter. This can result in reduced biomass accumulation, delayed fruit setting and development, and ultimately lower yield and fruit quality (Goo et al., 2024). To mitigate these constraints, supplemental lighting using artificial light sources is increasingly employed in greenhouse production. Light-emitting diode (LED) technology is gaining popularity due to its high energy efficiency, low thermal emission, and spectral specificity, allowing safe application close to the crop canopy (Johkan et al., 2010). LED lights typically combine blue (400-500 nm) and red (600-700 nm) wavelengths; blue light promotes stomatal opening and leaf area development, while red light enhances photosynthesis and reproductive growth. These wavelength-specific effects enable precise control over plant physiological responses. Numerous studies have demonstrated the positive effects of LED lighting on crop performance. For example, Kwon et al., 2023 found that 16-hour LED lighting with red and blue light during the winter season significantly increased internode length, dry weight, and fruit yield of paprika compared to non-illuminated controls. Furthermore, Wang et al., 2022, highlighted that the timing of supplemental lighting (morning vs. afternoon) differentially affects photosynthetic activity and energy utilization, suggesting that not only light quality and intensity, but also timing, is crucial for optimizing plant growth and yield. In European countries, particularly in northern regions with limited natural sunlight, LED lighting has been actively adopted in high-wire fruit vegetables such as tomatoes and cucumbers. Wu et al., 2016 reported that LED lighting using red and blue wavelengths increased total fruit yield by more than 20% and enhanced sugar content in tomato fruit. These results highlight the physiological and economic potential of LED lighting for horticultural crops grown under light deficit conditions. While supplemental lighting systems have been studied and applied extensively in advanced horticultural systems abroad, empirical data tailored to the structural and environmental characteristics of Korean greenhouses remain limited. Studies that integrate lighting regimes to evaluate their effects on paprika growth, yield, and fruit quality under commercial production conditions are scarce. Therefore, this study aimed to investigate the effects of different LED lighting regimes (morning, afternoon, and whole day) on the vegetative growth, reproductive development, yield, and water-soluble vitamin content of paprika grown in a commercial greenhouse during the winter season. The outcomes of this study are expected to contribute to the development of effective and economically feasible LED lighting strategies, offering practical solutions for greenhouse growers operating under light-limited conditions.
Materials and Methods
1. Planting material and Experimental site
The experimental crop used in this study was a red paprika (Capsicum annuum L.) cultivar ‘Sirocco’ (Enza Zaden Co., Netherlands). The experiment was conducted at a smart greenhouse facility located in Sosang-ri, Yongdeok-myeon, Uiryeong-gun, Gyeongsangnam-do, Korea. The total area of the greenhouse was 12,540 m2, with a ridge height of 6 m and sidewall height of 4 m. The greenhouse was oriented in the north-south direction and covered with a high- transmittance polyethylene (PE) film. Environmental conditions such as temperature, humidity, and solar radiation were monitored and controlled in real time using an integrated greenhouse control system (Magma, Green CS co., Ltd., Korea).
2. Cultivation Conditions and management
Seeds of paprika were sown into rockwool plug. And seedlings were grown into rockwool cubes (10 × 10 × 6.5 cm) under natural light conditions. The seedlings were raised for approximately 40 days, during which the day and night temperatures were maintained at 24 ± 2°C and 18 ± 2°C, respectively. Uniform seedlings were selected for transplanting based on their growth condition. Transplanting was performed into cocopeat slabs (100 × 15 × 12 cm, Happy Farmers, Korea) composed of a 1:1 (v/v) mixture of chip and dust. The planting density was set at 3.5 plants·m-2. Irrigation was automated in proportion to solar radiation, with an average supply of 80-100 mL per 100 J. The electrical conductivity (EC) and pH of the nutrient solution were maintained at 2.7-3.5 dS·m-1 and 5.6, respectively. During the cultivation period, the greenhouse environment was maintained at a daytime temperature of 25 ± 3°C, nighttime temperature of 17 ± 2°C, and an average temperature of 20 ± 2°C. The relative humidity was controlled within a range of 60-80%. Plants were trained using a two-stem ‘V’ system, with branching induced at the 4th to 5th node, and fruit set beginning from the third branching node. No fruit thinning was conducted, and all naturally set fruits were retained. To ensure adequate leaf area, one main stem leaf and one lateral leaf were retained at each fruiting node, and excess leaves were removed. Other cultivation practices followed the standard commercial recommendations provided by the Rural Development Administration (RDA, Korea).
3. Supplemental LED
The supplemental lighting system consisted of circular LED lamps (CPFLL150, D&W Special Lighting, Korea) with a diameter of 36 cm and a power consumption of 150 W. The spectral distribution of the LEDs was primarily concentrated in the photosynthetically active radiation regions of blue (400-500 nm) and red (600-700 nm) light. The green to yellow spectrum (500-580 nm) exhibited relatively low intensity, while a pronounced spike was also observed in the near-infrared region around 770 nm, indicating a broad-spectrum light source. (Table 1). Four lighting treatments were established to assess the effects of timing on plant growth and productivity: morning (T1, 05:00-10:00), evening (T2, 16:00-21:00), and full-day (T3, 06:00-22:00), each with a control group receiving no supplemental lighting (T0) (Fig. 1, Table 2). The LED fixtures were installed 1.0 m above the plant canopy and were adjusted weekly as the plant growth progresses. The light intensity at each treatment was measured at three positions: (1) midway between the front and back of the LED lamp, (2) directly beneath the lamp, and (3) the midpoint between these two locations. The average value of these measurements was used as the representative photosynthetic photon flux density (PPFD) for each treatment. The distance between lighting units was set at 2.5 m to ensure consistent coverage. The experiment was laid out in a completely randomized design (CRD) with three replications per treatment. Each replicate consisted of three paprika plants. All treatments were managed under identical environmental control settings to minimize external variability. Growth and yield parameters were assessed periodically throughout the growing season following transplanting.
Table 1.
Spectral characteristics of the LED light source used in this experiment.
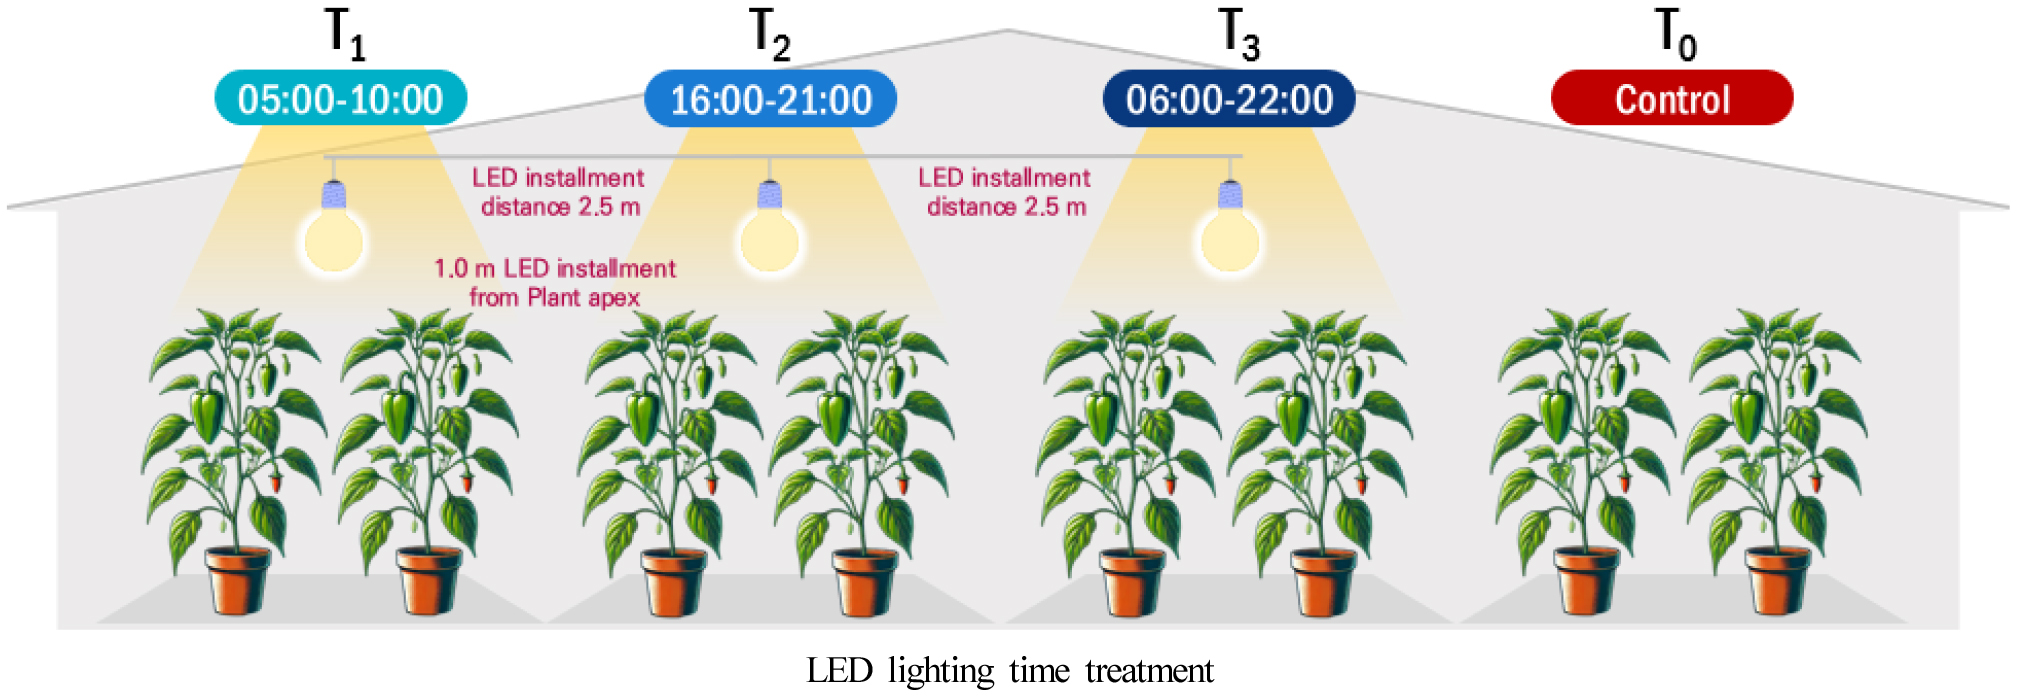
Table 2.
LED supplemental lighting treatments and characteristics in this experiment.
4. Growth and yield assessment
Growth-related parameters were measured every two weeks, up to 20 weeks of the growth stage for a total of 10 indices. For each treatment, three representative plants with uniform growth were randomly selected for measurement. To evaluate vegetative growth, plant height, leaf length, leaf width, number of fully expanded leaves, total leaf area, and leaf shape index were measured. Plant height was measured from the base of the stem to the apical meristem. Leaf length and width were measured on the third fully expanded leaf below the shoot apex. Leaf number was determined by counting all visible leaves above the soil surface. Leaf area was measured using a leaf area meter (LI-3100, LI-COR, USA) in a destructive method. The leaf shape index was calculated as the ratio of leaf length to leaf width. Reproductive development was assessed by measuring stem diameter (basal diameter immediately below the top flowering node), the position of the flowering node (count of internodes from the base to the uppermost inflorescence), and the length between the shoot apex and terminal inflorescence (LSTI). Fruit-related traits included number of set fruits, harvested fruit number, cumulative harvested fruit number, individual fruit weight, total yield per plant, marketable fruit rate, and non-marketable fruit rate. The number of fruits set was determined by counting developing fruits, while harvested fruit number was recorded during each harvest. The cumulative number of harvested fruits was calculated as the sum over the growing period. Fruit weight was recorded per individual fruit, and total yield per plant was calculated by dividing total fruit weight by number of plants. Marketable and non-marketable rates (%) were determined based on fruit size, color uniformity, and shape defects.
5. Water soluble vitamin analysis
To analyze the effect of lighting timing on fruit quality, water-soluble vitamin contents (B1, B2, B3, B5, B6, and C) were measured. Mature fruits were harvested 40 days after the onset of supplemental lighting in each treatment. The fruit samples were freeze-dried, and 50 mg of dry powder was used for analysis. One milliliter of internal standard solution (1 mg·mL-1) was added to each sample. The extraction solvent consisted of 650 μL methanol, 700 μL 10 mM ammonium acetate, and 50 μL of 0.1% butylated hydroxytoluene (BHT). Samples were vortexed for 5 min, then subjected to sonication (Ultrasonicator, 2510RDTH, BransonicⓇ, Danbury, USA) for 5 min at room temperature. After centrifugation at 4,000 rpm for 5 min (MICRO 17TR, Hanil, Korea), the supernatant was collected and filtered through a PTFE syringe filter (SMI-Lab Hut Co., Ltd., Maisemore, UK). Vitamin concentrations were quantified using liquid chromatography-tandem mass spectrometry (LC-MS/MS) following the method of (Cellar et al., 2016).
6. Statistical Analysis
Data was analyzed using SAS statistical software (version 9.4; SAS Institute Inc., Cary, NC, USA). One-way analysis of variance (ANOVA) was conducted to determine the effects of treatments. When significant differences were found, means were separated using Duncan’s multiple range test (DMRT) at the 5% significance level (P< 0.05). All figures present the results as means ± standard error (SE).
Results and Discussion
1. Environmental conditions in the greenhouse
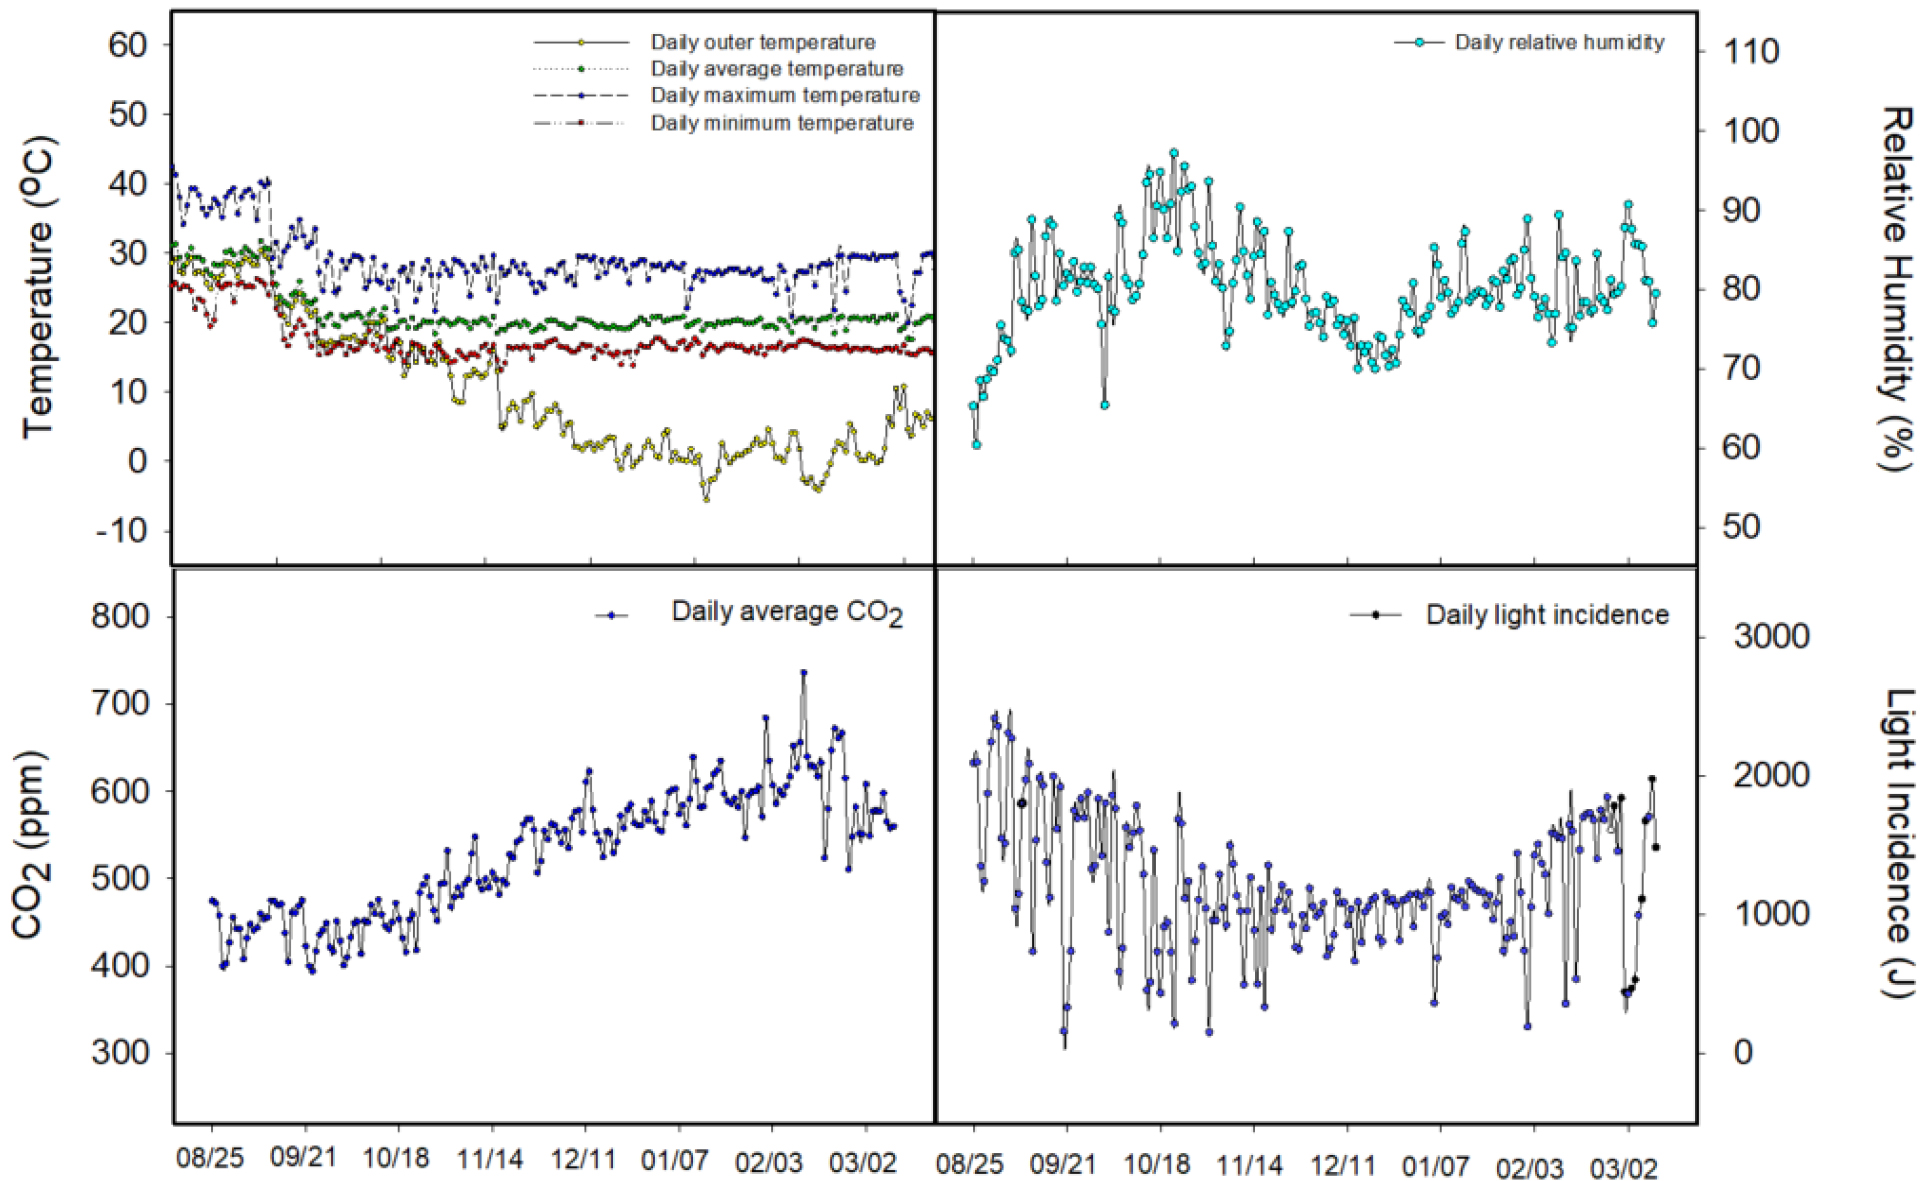
The average daily air temperature within the greenhouse was maintained at 20 ± 2℃, with daytime maximum temperatures ranging from 25 to 30℃ and night time minimum temperatures ranging between 12 and 18℃ (Fig. 2). These values largely fell within the optimal temperature range for paprika growth, which is generally reported as 24-26℃ during the day and 16-18℃ at night. Although outside temperatures dropped below -5℃ from late November, the internal environment remained stable due to effective heating system regulation, providing a favorable thermal condition for continued plant development. The relative humidity (RH) inside the greenhouse was maintained between 60% and 80% on average. However, beginning in November, RH tended to increase slightly due to the reduced external temperature and greater temperature difference between inside and outside, resulting in condensation of water vapor. Peak RH occasionally exceeded 85% during mid-December. This level of humidity may increase the risk of disease outbreaks, as suggested by (Ávalos-Sánchez et al., 2023). Thus, requiring proper ventilation and dehumidification strategies during this period. CO2 concentrations started at around 400-500 ppm during the early stages of cultivation but gradually increased to approximately 600-750 ppm by December. This elevation was likely due to reduced ventilation during colder months and the implementation of CO2 enrichment to maintain concentrations at around 600 ppm, which is known to enhance photosynthetic activity in C3 crops including paprika (Wang et al., 2022a). Regarding light availability, daily solar radiation levels remained relatively high (2,000-2,500 J·cm-2·day-1) until mid-September but began to decline steadily thereafter. From November to January, radiation levels dropped to as low as 1,000-1,500 J·cm-2·day-1 due to seasonal reductions in day length and the use of thermal screens to conserve heat. These values were insufficient to meet the light compensation point of paprika, which is approximately 200 μmol·m-2·s-1 in photosynthetic photon flux density (PPFD), indicating suboptimal conditions for photosynthesis during the winter season. This light limitation may lead to reduced vegetative growth and fruit set, as also reported by Goo and Park (2024), who demonstrated that low winter light intensity severely hinders paprika productivity. In this context, the application of LED lighting during light-limited periods is considered not only a supplemental light source but also a critical strategy to stabilize growth and yield.
2. Effect of LED supplemental lighting regime on the growth and yield of paprika
2.1 Changes in plant height, leaf length, leaf width, and leaf shape index
Significant differences were observed among treatments in key vegetative parameters including plant height, leaf length and leaf width mostly during the last few weeks growth stage rather than earlier weeks (Table 3). At early stages, there were no significant differences in plant height among treatments. However, from week 16 onward, plant height diverged notably depending on the lighting regime. At 20 weeks, significant difference in plant height was visible between T0 and T3 only. Interestingly, T3 plants showed a 13% reduction in height compared to T0, suggesting that prolonged lighting suppressed stem elongation. As per Wu et al., 2025, note that the suppression of plant height in response to light is a complex process influenced by the overall spectral composition. Leaf length was similar among treatments during the early growth period, but from week 12 onward, T1 and T2 treatments showed longer leaves comparable to control (T0). Especially, T1 achieved the greatest leaf length (17.1 cm at week 18 and 16.8 cm at week 20). Morning lighting in T1 likely synchronized with the natural increase in solar irradiance, enhancing photosynthetic efficiency and promoting cell elongation and vascular development. In contrast, T3 lighting appeared to induce photoinhibition during the later stages of growth, limiting leaf elongation and accelerating reproductive transition. Leaf width also showed distinct differences as growth progressed. Leaf width was relatively higher in T2 consistently, especially during the final four weeks. In contrast, T1 and T3 displayed a significant reduction after week 10. LSI , a parameter related to light capture and stomatal patterning, ranged between 1.5 and 1.9 across all treatments, with no statistically significant differences. Further analysis of leaf number and total leaf area revealed that supplemental lighting led to a relatively higher values compared to control. A 9.5% increase in number of leaves was observed in T1 over T0. Notably, T1 plants consistently had more leaves than the control from week 4, which was statistically more significant since week 16 (p <0.05). These findings support the hypothesis that morning lighting, aligned with the onset of natural daylight, enhances photosynthetic activity and accelerates leaf initiation (Wang et al., 2022) (Table 4). Total leaf area was also higher in plants with supplemental light as growth progressed, though statistically significant difference was only visible up to 8 weeks. T1 and T2 had 8.1% and 7.3% higher leaf area than T0, respectively. This suggests that supplemental lighting contributed not only to leaf number but also to enhanced photosynthetically active surface area. Morning supplemental lighting (T1) appears to advance the onset of daily photosynthesis by balancing early low solar radiation levels, allowing for enhanced assimilation and partitioning (Tiwari et al., 2022). This is consistent with prior reports that synchronization between environmental light cues and plant circadian rhythms maximizes growth efficiency (Dodd et al., 2005). In contrast, prolonged lighting in T3 may have triggered photoinhibition or light stress, activating photoprotective mechanisms rather than promoting growth (Goh et al., 2012; Murata et al., 2007; Sharma et al., 2023). Interestingly, while LED treatments (T1-T3) significantly increased leaf number compared to the control, total leaf area did not differ substantially among treatments. This suggests that although more leaves were produced under LED treatments, individual leaf size may have been reduced, resulting in similar overall leaf area. Such a trade-off between number of leaves and size has also been reported in prior studies (Hernández and Kubota, 2016; Massa et al., 2008), indicating that lighting conditions influence internode elongation and leaf expansion dynamics.
Table 3.
Effect of supplemental lighting periods on plant height, leaf length, leaf width and leaf shape index (LSI) of paprika under greenhouse conditions.
| Treatmentz | Weeks after treatment (WAT) | ||||||||||
| 0 | 2 | 4 | 6 | 8 | 10 | 12 | 14 | 16 | 18 | 20 | |
| Plant height (cm) | |||||||||||
| T0 | 108.2 ay | 123.8 a | 138.0 a | 150.0 a | 164.3 a | 175.8 a | 186.7 a | 200.4 a | 222.7 a | 235.8 a | 246.8 a |
| T1 | 108.2 a | 121.4 a | 138.1 a | 152.7 a | 167.4 a | 181.4 a | 194.7 a | 206.2 a | 215.9 a | 230.0 a | 243.7 a |
| T2 | 108.2 a | 122.4 a | 135.1 a | 145.1 a | 156.3 a | 166.9 a | 179.0 a | 193.7 a | 205.7 ab | 222.4 ab | 235.2 a |
| T3 | 108.2 a | 121.2 a | 132.7 a | 142.0 a | 150.4 a | 160.4 a | 170.4 a | 182.7 a | 192.9 b | 206.2 b | 214.7 b |
| Leaf length (cm) | |||||||||||
| T0 | 23.4 ay | 22.1 b | 21.4 a | 17.6 a | 17.4 a | 16.7 a | 16.9 a | 18.0 a | 16.6 a | 16.8 a | 16.6 ab |
| T1 | 23.4 a | 23.1 a | 21.3 a | 17.8 a | 17.4 a | 16.9 a | 16.2 ab | 16.0 bc | 15.1 a | 17.1 a | 16.8 a |
| T2 | 23.4 a | 22.9 a | 19.6 a | 18.0 a | 15.6 a | 14.7 a | 15.1 bc | 16.3 b | 15.7 a | 15.4 b | 16.2 b |
| T3 | 23.4 a | 23.3 a | 20.2 a | 18.2 a | 15.8 a | 15.1 a | 14.9 c | 14.9 c | 15.1 a | 15.8 b | 15.6 c |
| Leaf width (cm) | |||||||||||
| T0 | 13.1 ay | 11.9 a | 11.6 a | 11.6 a | 11.2 a | 10.5 a | 10.5 a | 11.7 a | 10.1 a | 10.4 ab | 10.3 ab |
| T1 | 13.1 a | 12.4 a | 11.5 a | 11.7 a | 11.0 a | 10.6 a | 10.2 ab | 9.9 b | 9.6 a | 9.3 b | 9.8 bc |
| T2 | 13.1 a | 12.8 a | 11.4 a | 11.5 a | 9.4 a | 9.6 a | 9.7 bc | 9.9 b | 9.8 a | 11.1 a | 10.4 a |
| T3 | 13.1 a | 12.3 a | 11.4 a | 11.6 a | 9.9 a | 9.6 a | 9.6 c | 9.3 c | 9.7 a | 9.3 b | 9.6 c |
| Leaf shape index (LSI) | |||||||||||
| T0 | 1.9 ay | 1.9 a | 1.8 a | 1.5 a | 1.6 b | 1.6 a | 1.6 a | 1.5 b | 1.6 a | 1.6 a | 1.6 a |
| T1 | 1.9 a | 1.9 a | 1.9 a | 1.5 a | 1.6 b | 1.6 a | 1.6 a | 1.6 a | 1.6 a | 1.7 a | 1.7 a |
| T2 | 1.9 a | 1.8 a | 1.7 a | 1.6 a | 1.7 a | 1.5 a | 1.6 a | 1.6 a | 1.6 a | 1.6 a | 1.6 a |
| T3 | 1.9 a | 1.9 a | 1.8 a | 1.6 a | 1.6 b | 1.6 a | 1.6 a | 1.6 ab | 1.6 a | 1.6 a | 1.6 a |
Table 4.
Effect of supplemental lighting periods on number of leaves and leaf area of paprika under greenhouse conditions.
| Treatmentz | Weeks after treatment (WAT) | ||||||||||||||||||||
| 0 | 2 | 4 | 6 | 8 | 10 | 12 | 14 | 16 | 18 | 20 | |||||||||||
| Number of leaves | |||||||||||||||||||||
| T0 | 12.2 ay | 15.1 c | 18.9 c | 23.1 a | 26.7 b | 30.9 a | 34.9 a | 38.0 a | 40.0 b | 44.0 b | 47.1 b | ||||||||||
| T1 | 12.2 a | 16.0 ab | 20.2 b | 24.7 a | 28.7 ab | 32.9 a | 36.7 a | 40.0 a | 44.0 a | 46.4 a | 51.6 a | ||||||||||
| T2 | 12.2 a | 16.7 a | 21.1 ab | 25.1 a | 29.6 a | 32.7 a | 35.8 a | 38.9 a | 41.1 ab | 45.8 a | 50.4 a | ||||||||||
| T3 | 12.2 a | 15.8 bc | 21.3 a | 25.6 a | 29.8 a | 33.3 a | 35.6 a | 39.6 a | 43.6 a | 46.2 a | 50.7 a | ||||||||||
| Leaf area (m2) | |||||||||||||||||||||
| T0 | 0.48 a | 0.52 b | 0.63 b | 0.73 b | 0.81 b | 0.90 a | 0.98 a | 1.06 a | 1.09 a | 1.17 a | 1.24 a | ||||||||||
| T1 | 0.48 a | 0.60 a | 0.72 a | 0.82 a | 0.91 a | 1.00 a | 1.07 a | 1.13 a | 1.20 a | 1.24 a | 1.34 a | ||||||||||
| T2 | 0.48 a | 0.64 a | 0.75 a | 0.85 a | 0.93 a | 0.98 a | 1.04 a | 1.10 a | 1.14 a | 1.24 a | 1.33 a | ||||||||||
| T3 | 0.48 a | 0.59 a | 0.74 a | 0.84 a | 0.91 a | 0.98 a | 1.01 a | 1.08 a | 1.14 a | 1.19 a | 1.27 a | ||||||||||
2.2 Changes in stem diameter, LSTI, flowering node, and fruit set in paprika
The timing of supplemental LED lighting had significant effects on several physiological traits closely associated with reproductive growth in paprika (Table 5). Stem diameter, an indicator of plant vigor and vascular development, plays a crucial role in supporting reproductive structures. From the second week onward, the T3 treatment (06:00-22:00, 16 h full-day lighting) consistently exhibited the widest stems (up to 7.6 mm), maintaining stable values throughout the cultivation period. This suggests that prolonged lighting promoted photosynthetic assimilate allocation to the shoot system, thereby enhancing stem development (Hernández and Kubota, 2016). The improved stem robustness under T3 is likely to support reproductive stability by increasing mechanical strength and conductive efficiency. LSTI, a parameter representing the transition from vegetative to reproductive growth, showed notable differences among treatments. Shorter LSTI values indicate earlier reproductive development. Though inconsistent, significance was observed since week 8 when T1 treatment showed significantly longer LSTI compared to control, while T2 and T3 declined significantly in the last 6-week period. This trend implies that stable and extended light exposure in T3 promoted assimilate translocation to developing floral structures, thereby accelerating the onset of reproductive growth (Goto, 2012). In contrast, the control group (T0) exhibited the longest LSTI, indicating prolonged vegetative growth due to insufficient light conditions, which delayed reproductive organ development (Park et al., 2011). Previous studies have similarly reported that low temperature or limited light can result in delayed floral transition and elongated LSTI in paprika (Hernández and Kubota, 2016). A higher flowering node is generally associated with greater reproductive potential. But significantly higher flowering node position than control was not observed. These results suggest that LED lighting promotes internode elongation and node differentiation, leading to an upward shift in flowering position. Similar increases in flowering node in response to supplemental lighting have been reported previously (Heuvelink and Dorais, 2005). In this study, LED lighting advanced flowering node positions by approximately two nodes, which not only reflects earlier flowering but also potentially contributes to greater fruit set and yield. Fruit set, a direct indicator of reproductive success and productivity, was significantly affected by LED treatments. All treatments showed a steady increase in fruit number from week 2 onward, with T3 yielding the highest number of fruits (6.4 fruits per plant) by week 20 than T0 (5.6 fruits). Though it was not significant, the higher number of fruits set indicate that supplemental lighting enhanced photosynthetic efficiency and stabilized floral development, contributing to improved fruit retention and setting. Goto (2012), and Bantis et al. (2018) also reported that LED lighting stabilizes floral morphogenesis and enhances fruit development, which supports the current results. These findings demonstrate that the full-day lighting treatment (T3) promoted internode elongation and raised the flowering node position, ultimately resulting in the highest fruit set. However, T3 was less effective in promoting vegetative traits such as plant height and leaf area, suggesting the need for a customized lighting strategy based on crop developmental stage and target yield components.
Table 5.
Effect of supplemental lighting periods on stem diameter, LSTI, flowering nodes and number of fruits set in paprika under greenhouse conditions.
| Treatmentz | Weeks after treatment (WAT) | ||||||||||
| 0 | 2 | 4 | 6 | 8 | 10 | 12 | 14 | 16 | 18 | 20 | |
| Stem diameter (mm) | |||||||||||
| T0 | 7.3 ay | 7.1 b | 6.3 a | 6.0 a | 5.8 a | 5.4 a | 5.8 a | 6.0 a | 5.4 a | 5.5 a | 5.2 a |
| T1 | 7.3 a | 6.8 b | 6.7 a | 6.7 a | 6.4 a | 6.2 a | 5.7 a | 5.7 a | 5.4 a | 6.0 a | 5.3 a |
| T2 | 7.3 a | 7.0 b | 6.3 a | 5.5 a | 5.2 a | 5.2 a | 5.5 a | 5.5 a | 5.3 a | 5.6 a | 5.2 a |
| T3 | 7.3 a | 7.6 a | 6.8 a | 6.0 a | 5.1 a | 5.2 a | 5.5 a | 5.9 a | 5.7 a | 5.8 a | 5.1 a |
| LSTI (cm) | |||||||||||
| T0 | 6.6 a | 5.8 a | 5.4 a | 4.1 a | 4.1 ab | 3.4 a | 4.5 a | 5.2 a | 5.4 a | 6.4 a | 6.3 a |
| T1 | 6.6 a | 5.3 a | 5.9 a | 6.4 a | 5.9 a | 5.3 a | 4.7 a | 3.9 a | 4.4 b | 5.2 b | 5.1 b |
| T2 | 6.6 a | 7.9 a | 4.6 a | 5.6 a | 2.7 b | 3.4 a | 5.7 a | 6.7 a | 4.2 b | 5.3 b | 4.9 b |
| T3 | 6.6 a | 6.9 a | 5.9 a | 4.4 a | 2.8 b | 3.2 a | 4.2 a | 5.0 a | 4.4 b | 5.3 b | 4.2 b |
| Flowering node | |||||||||||
| T0 | 7.0 a | 8.7 a | 10.4 c | 12.6 a | 14.3 b | 16.4 a | 18.4 a | 19.9 a | 20.9 a | 22.9 a | 24.4 a |
| T1 | 7.0 a | 9.0 a | 11.1 b | 13.3 a | 15.3 ab | 17.4 a | 19.3 a | 21.0 a | 23.0 a | 24.2 a | 26.8 a |
| T2 | 7.0 a | 9.3 a | 11.6 ab | 13.6 a | 15.8 a | 17.3 a | 18.9 a | 20.1 a | 21.6 a | 23.9 a | 25.8 a |
| T3 | 7.0 a | 8.9 a | 11.7 a | 13.8 a | 15.9 a | 17.7 a | 18.8 a | 20.7 a | 22.4 a | 24.1 a | 26.2 a |
| Number of fruits set | |||||||||||
| T0 | - | 8.2 a | 8.1 a | 7.8 a | 7.4 a | 4.7 a | 4.0 a | 3.8 a | 5.1 a | 5.8 a | 5.6 a |
| T1 | - | 10.3 a | 9.7 a | 8.4 a | 7.9 a | 5.4 a | 4.2 a | 4.0 a | 5.1 a | 6.3 a | 6.0 a |
| T2 | - | 9.9 a | 10.8 a | 8.8 a | 9.0 a | 4.4 a | 3.7 a | 3.6 a | 5.2 a | 5.4 a | 6.2 a |
| T3 | - | 10.8 a | 10.1 a | 8.3 a | 8.9 a | 5.8 a | 4.3 a | 4.1 a | 6.7 a | 6.1 a | 6.4 a |
2.3 Changes in cumulative number of fruits, yield, fruit weight, and productivity
All LED lighting treatments (T1, T2, and T3) exhibited higher yield per plant than the control (T0), with the 16-hour lighting treatment (T3) showing the most substantial increase in yield (Table 6).
Table 6.
Effect of supplemental lighting periods on cumulative number of harvested fruits, fruit weight and yield per plant of paprika under greenhouse conditions.
| Treatmentz | Weeks after treatment (WAT) | ||||||||||
| 0 | 2 | 4 | 6 | 8 | 10 | 12 | 14 | 16 | 18 | 20 | |
| Cumulative number of harvested fruits | |||||||||||
| T0 | - | - | - | 0.2 ay | 2.4 a | 3.1 c | 4.0 c | 4.0 a | 5.3 a | 6.2 b | 7.3 b |
| T1 | - | - | - | 1.1 a | 2.7 a | 4.0 bc | 4.9 bc | 5.1 a | 6.4 a | 7.6 a | 9.8 a |
| T2 | - | - | - | 1.3 a | 2.4 a | 4.9 ab | 6.0 ab | 6.2 a | 7.3 a | 8.4 a | 9.3 a |
| T3 | - | - | - | 0.4 a | 2.9 a | 5.8 a | 7.1 a | 7.6 a | 8.9 a | 9.6 a | 10.1 a |
| Fruit weight (g) | |||||||||||
| T0 | - | - | - | 187.0 b | 186.7 ab | 195.5 c | 226.3 a | 242.5 a | 237.9 a | 244.3 a | 241.5 a |
| T1 | - | - | - | 189.2 ab | 190.3 bc | 196.5 bc | 226.3 a | 240.0 a | 239.6 a | 247.9 a | 240.2 a |
| T2 | - | - | - | 189.0 a | 193.6 c | 196.5 ab | 228.4 a | 243.5 a | 239.2 a | 250.9 a | 243.0 a |
| T3 | - | - | - | 193.0 a | 194.2 a | 196.1 a | 237.6 a | 244.0 a | 248.6 a | 251.0 a | 248.4 a |
| Yield per plant (g) | |||||||||||
| T0 | - | - | - | 41.6 b | 497.9 a | 584.8 c | 785.9 c | 785.9 c | 1103.1 b | 1320.2 b | 1588.6 b |
| T1 | - | - | - | 210.2 a | 506.2 a | 768.2 b | 969.3 b | 1022.7 b | 1342.1 ab | 1617.6 ab | 2151.3 a |
| T2 | - | - | - | 252.0 a | 467.1 a | 947.6 ab | 1201.3 ab | 1255.4 ab | 1521.2 a | 1800.1 a | 2010.6 a |
| T3 | - | - | - | 85.8 ab | 560.4 a | 1226.9 a | 1443.7 a | 1552.1 a | 1883.6 a | 2050.9 a | 2271.7 a |
The cumulative number of harvested fruits began to increase from the 8th week after light application. By the 10th week, the number of fruits harvested per plant was 3.1 in T0, while T1, T2, and T3 showed 4.0, 4.9, and 5.8 fruits, respectively. These results imply that supplemental LED lighting promoted the transition to reproductive growth and stabilized fruit set, leading to earlier harvests. At week 20, T3 recorded the highest cumulative fruit number (10.1), followed by T1 (9.8), T2 (9.3), and T0 (7.3). Compared to the control, T3 achieved a 38.4% increase in fruit number, indicating that 16-hour lighting regime effectively improved fruit set and yield performance. These findings are consistent with previous studies (Hernández and Kubota, 2016), that LED lighting promotes flowering and fruit set in horticultural crops. Bantis et al. (2018) demonstrated that supplemental lighting enhanced the light saturation point of paprika, leading to increased productivity. In addition, Zhang et al. (2015) found that providing supplemental light after sunset contributed to greater assimilate accumulation and yield improvement. The low productivity in the control group may be attributed to reliance on natural light only, which, during the winter season, likely delayed flowering and increased the risk of fruit drop, resulting in reduced cumulative yield. In contrast, the LED lighting treatments maintained physiological stability and helped meet the light compensation point, thereby improving fruit set stability and total harvest. Average fruit weight also showed a slight increasing trend depending on the lighting treatment. The T3 group recorded the highest average fruit weight at 248.4 g, a 2.9% increase compared to T0 (241.5 g). T2 showed a slight increase to 243.0 g (+0.6%). Although the differences among treatments were not statistically large, the higher fruit weight in T3 may reflect enhanced assimilate accumulation under prolonged high sunlight conditions (Bantis et al., 2018). Yield per plant, a key indicator of productivity, was also highest in T3 at 2,271.7 g, representing a 683.1 g (+43.0%) increase over T0 (1,588.6 g). T1 and T2 recorded 2,151.3 g (+35.4%) and 2,010.6 g (+26.6%), respectively. These results suggest that LED lighting effectively stimulated photosynthetic assimilation and biomass accumulation, contributing to improved fruit yield.
2.4 Changes in marketable fruit ratio
Overall, LED lighting increased the proportion of marketable fruits across all treatment groups compared to the no supplemental lighting as in control (T0). These results are in line with previous studies by Massa et al. (2008) and Hernández and Kubota (2016) who reported that LED light sources under low-light conditions promoted the proper development of reproductive organs and improved fruit quality. Lu et al. (2012) further emphasized that appropriate LED lighting regimes mitigated diurnal light fluctuations, thereby reducing light stress and improving both yield and the ratio of marketable fruits. A similar trend was observed in the present study.
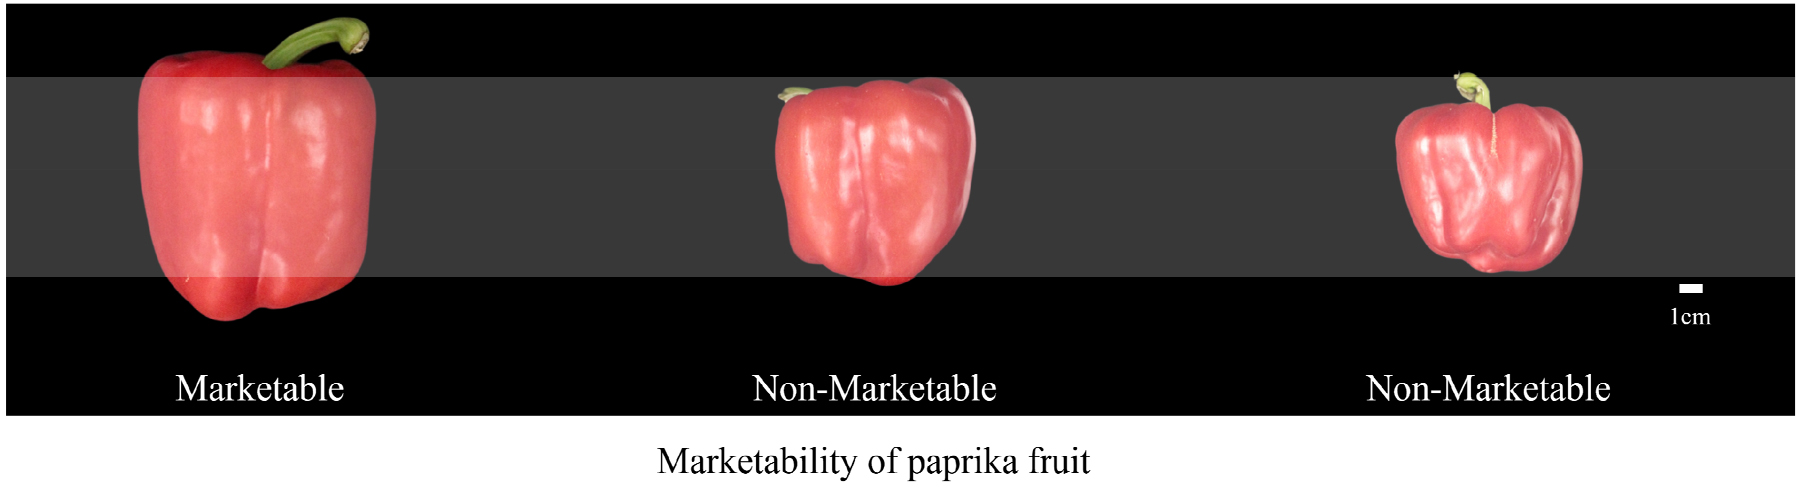
In the control treatment (T0), an average of 7.3 fruits per plant were harvested, among which 6.3 fruits (86.0%) were classified as marketable. The remaining fruits were considered non-marketable due to physiological disorders such as fruit malformation or fruit drop. All LED-regimed groups exhibited improved marketable fruit ratios compared to the control, with the 16-hour lighting regime (T3: 06:00-22:00) showing the most significant improvement. In T3, 9.3 out of 10.1 fruits per plant were marketable, corresponding to a marketable ratio of 92.0%, which was approximately 6 percentage points higher than T0 (Fig. 3).
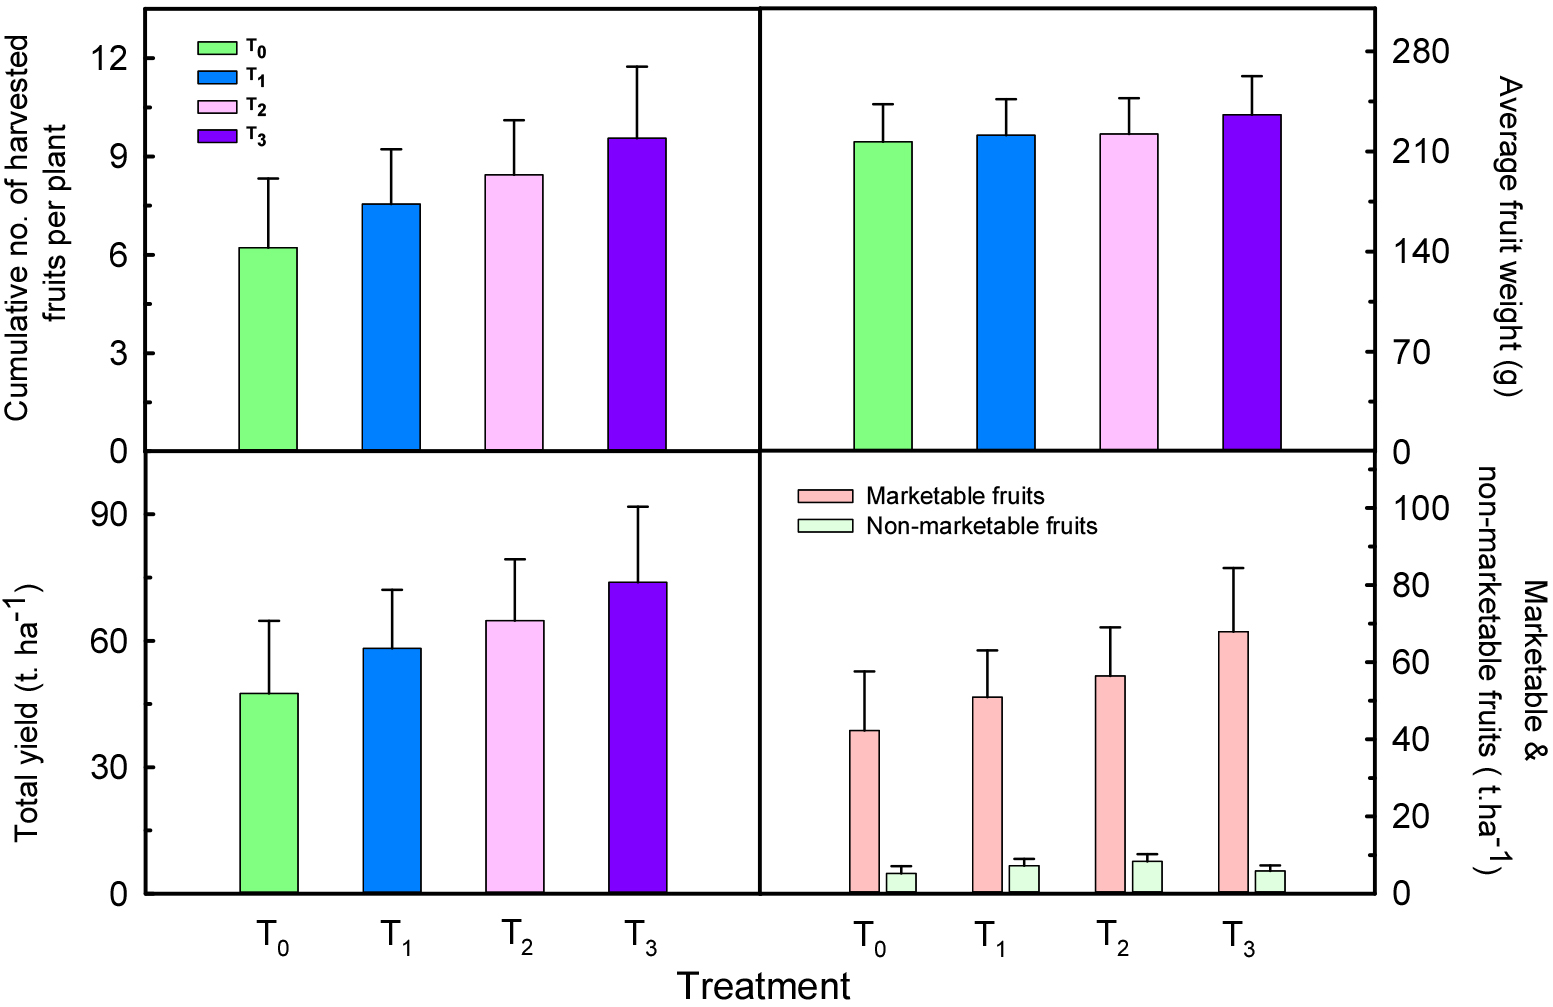
Fig. 3.
Effects of different LED lighting periods on cumulative no. of harvested fruits, average fruit weight, average yield in tons per hectare and marketable and non-marketable fruits of paprika at various weeks after treatment. T0 (Control), T1 (05:00-10:00), T2 (16:00-21:00), and T3 (06:00-22:00), measured biweekly for 20 weeks. Error bars represent the standard error of the mean (n = 9).
Both T1 (morning lighting) and T2 (evening lighting) also showed improved marketable ratios of 87.5% and 87.1%, respectively, but the highest effect was observed in T3. This may be attributed to the continuous light supply throughout the day in T3, which likely enhanced physiological stability and improved uniformity in flowering and fruit set, thereby reducing fruit drop and malformation. When converted to marketable yield per hectare, T0 was estimated at 40.9 tons, whereas T1, T2, and T3 recorded 55.0, 56.4, and 67.9 tons, respectively. These differences indicate that LED lighting can result in economically significant improvements beyond total fruit yield. In particular, T3 not only increased total yield but also reduced the incidence of malformed fruits and physiological disorders, contributing to a higher proportion of high-quality fruits. The ratio of marketable to non-marketable fruits also varied clearly among treatments. T3 recorded the highest marketable ratio (92.0%), followed by T1 (87.5%), T2 (87.1%), and T0 (86.0%). These findings are consistent with those of Nguyen et al. (2021), who reported that LED lighting normalized fruit development and suppressed malformation by stabilizing the light environment. Overall, 16-hour lighting regime (T3) was most effective in enhancing both the quantity and quality of fruits, contributing to stable reproductive development and improved light use efficiency (Fig. 4).
2.5 Changes in water-soluble vitamin contents of paprika fruits
Paprika is a functional vegetable rich in various water- soluble vitamins, including vitamin C and B-complex vitamins, which are known to play vital roles in antioxidant activity, immune enhancement, neural function, and energy metabolism (Marín et al., 2004; Navarro et al., 2006; Howard et al., 2000; Lee et al., 1995). The content of these functional compounds in paprika is highly sensitive to light conditions during cultivation. Light quality, intensity, and photoperiod are considered key factors influencing the biosynthesis of vitamins and secondary metabolites (Hernández and Kubota, 2016). Therefore, this study investigated the effects of different LED lighting time periods on the contents of water-soluble vitamins (B1, B2, B5, B6, B9, and C) in paprika fruits (Table 7).
Table 7.
Effect of supplemental lighting periods on water soluble vitamin content of paprika fruit cultivated under greenhouse conditions.
| Treatmentz | Vitamin B1 | Vitamin B2 | Vitamin B5 | Vitamin B6 | Vitamin B9 | Vitamin C |
| Concentration (mg·kg-1) | ||||||
| T0 | 0.45 ± 0.04y | 0.52 ± 0.09 | 8.57 ± 0.4 | 0.01 ± 0.003 | 0.52 ± 0.02 | 2.88 ± 0.2 |
| T1 | 0.49 ± 0.07 | 0.64 ± 0.005 | 11.9 ± 0.5 | 0.02 ± 0.002 | 0.42 ± 0.04 | 2.76 ± 0.2 |
| T2 | 0.40 ± 0.04 | 0.61 ± 0.07 | 10.9 ± 0.2 | 0.02 ± 0.003 | 0.32 ± 0.01 | 2.30 ± 0.3 |
| T3 | 0.36 ± 0.02 | 0.83 ± 0.03 | 10.1 ± 0.8 | 0.02 ± 0.0003 | 0.37 ± 0.02 | 2.86 ± 0.1 |
Vitamin B1 (thiamine) content was highest under the morning lighting treatment (T1, 05:00-10:00), reaching 0.49 mg·kg-1, which was 8.9% higher than the control (T0, 0.45 mg·kg-1). This result suggests that early morning lighting may have stimulated carbohydrate metabolism, thereby enhancing the biosynthesis of vitamin B1. As a coenzyme involved in energy metabolism, the synthesis of vitamin B1 is likely influenced by the accumulation of photoassimilates associated with the timing of light exposure. Vitamin B2 (riboflavin) content was highest in the 16-hour lighting treatment (T3, 06:00-22:00), at 0.83 mg·kg-1, representing a 62.7% increase compared to the control (0.52 mg·kg-1). Vitamin B2 functions as a component of flavin enzymes involved in redox reactions. A prolonged and stable light environment in T3 likely promoted the biosynthesis of this vitamin (Hernández and Kubota, 2016). Vitamin B5 (pantothenic acid) content was higher under both T1 and T2 treatments, measuring 11.9 mg·kg-1 and 10.9 mg·kg-1, respectively, compared to 8.57 mg·kg-1 in T0. These findings indicate that supplemental lighting may stimulate the biosynthetic pathway of vitamin B5, a precursor of coenzyme A, and support energy metabolism via enhanced enzyme activity (Bian et al., 2015; Dou et al., 2017; Leonardi and Jackowski, 2007). Although vitamins B6 (pyridoxine) and B9 (folate) did not show distinct differences among treatments, relatively higher levels were observed in T1 and T2. This suggests that shorter supplemental lighting periods in the morning and evening might have had indirect effects on their biosynthesis. These vitamins, like enzymatic cofactors, may be regulated in response to the daily rhythm of light exposure. In contrast, vitamin C (ascorbic acid) content was highest in the control group (T0), with a value of 2.88 mg·kg-1 and tended to decrease with longer lighting durations. The lowest concentration (1.86 mg·kg-1) was recorded in the T3 treatment. This decline may be attributed to increased ROS (reactive oxygen species) accumulation due to prolonged artificial light exposure, leading to enhanced antioxidant consumption or repression of ascorbate biosynthesis under photooxidative stress (Müller-Moulé, 2008; Niyogi, 1999; Smirnoff, 2018). Overall, the timing of LED supplemental lighting significantly affected the accumulation of key water-soluble vitamins in paprika fruits, with distinct patterns depending on vitamin type. Morning lighting (T1) was effective in increasing the contents of vitamins B1 and B5, while prolonged lighting (T3) was favorable for vitamin B2 synthesis but appeared to suppress vitamin C accumulation.
Conclusion
Under winter greenhouse conditions with limited natural light, LED lighting significantly enhances paprika productivity and marketability. A stage-specific lighting strategy is recommended: morning lighting (05:00-10:00) effectively supports early vegetative growth and floral transition, while prolonged lighting (06:00-22:00) during reproductive stages maximizes fruit set, yield, and quality. This tailored approach balances energy use and crop development, optimizing overall yield and profitability in winter greenhouse paprika production.
