

Introduction
Materials and Methods
1. Experimental materials and environmental conditions
2. Growth survey
3. Applied growth model
4. Statistical analysis
Results and Discussion
Introduction
Several methods have been investigated to predict plant growth during cultivation. Growth has been modeled using expolinear or sigmoidal functional equations (Kim et al., 2018; Lee et al., 2003). Methods using growth characteristics, such as leaf length, leaf width, and petiole length (Cho et al., 2007; Jung et al., 2016) have been used along with non-destructive prediction analysis methods using video or images (Tackenberg, 2007). Recently, artificial neural networks have been used to predict plant fresh weight (Moon et al., 2020). Additionally, fresh weight has been studied by measuring real-time changes in the weight at each growth stage during crop cultivation in a plant factory (Kim et al., 2016). Plant factories have an advantage in predicting growth because environmental factors, such as light, air temperature, and relative humidity, carbon dioxide concentration, culture medium, suitable for cultivation can be manually set and precise controlled. Predicting the crop growth is necessary for planned cultivation and quality control of crops in plant factories.
Perilla [Perilla frutescens (L.) Britt.] is an annual herbaceous plant belonging to the family Lamiaceae. It required an eco-friendly cultivation method because its leaves are mainly used as a “Ssam” (wrapped) vegetable (Ann et al., 2020; Sul et al., 2022). Plant factories, which artificially control the plant growth environment, create optimal conditions for plant growth and represent an optimal nutritional system that is free from pests and diseases. Therefore, stable and eco-friendly cultivation of perilla is possible in plant factories. Particularly, research on growth models is essential because a closed-type plant factory system can promote crop production throughout the year. However, such studies are still limited.
Therefore, this study aimed to find an appropriate independent variable for growth prediction and perform growth modeling using an expolinear function to predict the growth of perilla in a closed-type plant factory.
Materials and Methods
1. Experimental materials and environmental conditions
Hydroponic system using a nutrient film technique (2.4 × 0.6 × 2.0 m, length × width × height) was applied in a closed-type plant factory at Jeju National University. Perilla seeds (Perilla frutescens (L.) Britt; baby perilla, Danong, Korea) were sown on a urethane sponge (2.5 × 2.5 × 2.5 cm), and plant with four true leaves were planted in a cultivation bed at a planting density of 44.4 plants/m2 (15 × 15 cm). A tube-type light-emitting diode (LED, HT204, ESLEDs, Korea) was used as the artificial light source in the experiment. Photosynthetic photon flux density was measured using a quantum sensor (LI-190R, LI-COR, Lincoln, NE, USA). The light source was set at a height of 35 cm. The light intensity was set 130 µmol·m-2·s-1, and the light quality was fixed at a ratio of 7:1:2 (red:green:blue). The day/night photoperiod was fixed at 12/12 h.
Hoagland's solution was used as the culture medium, with the pH adjusted in the rage of 5.5-6.5, and the electrical conductivity adjusted to 1.0 dS·m-1 every 1-2 d. Temperature and relative humidity of the cultivation environment were maintained at 19-21℃ and 55-65%, respectively, using a temperature and humidity sensor (HMP60, Vaisala, Finland). Carbon dioxide concentration was measured using a carbon dioxide concentration sensor (GMP252, Vaisala) are the concentration change was maintained in the range of 600-700 µmol·mol-1.
2. Growth survey
Twelve growth surveys were conducted on 7, 14, 18, 21, 25, 28, 32, 35, 39, 42, and 46 DAT (days after transplanting). In each survey, fresh weight, dry weight, leaf number, leaf area, leaf length, leaf width, plant height, and node number of six samples were investigated. The total leaf area was measured using a leaf area meter (LI-3000A, Li-Cor). Dry weight was measured after drying the plant samples at 70℃ for 72 h in an oven (VS-1202D2, Vision Scientific, Korea).
3. Applied growth model
The expolinear equation proposed by Goudriaan and Monteith (1990) was used for assessing the changes in growth (Eq. 1).
where W is the dry weight (g·m-2), Cm is the crop growth rate (g·m-2·d-1), Rm is the relative growth rate (g·g-1·d-1), t is the number of days after transplanting, and tb is the point at which the leaves overlap (lost time, d).
4. Statistical analysis
Statistical analysis was performed using a Statistical Analysis System (SAS Ver9.4, SAS Institute Inc., Cary, NC, USA). Pearson's correlation coefficient was used to analyze the correlation between different growth factors. Significance between mean values was analyzed at the 5% level by Duncan's multiple range test.
Results and Discussion
After transplanting perilla in the plant factory, the changes in the growth rate were measured for 46 DAT before flower bud differentiation (Fig. 1).

Leaf length and width increased linearly with the number of days after transplanting, and the growth rate decreased after approximately 40 DAT. The leaf number gradually increased initially after transplanting but increased rapidly from approximately 15 DAT until flower bud differentiation occurred. Moreover, the number of nodes increased gradually in a linear manner from the initial but increased rapidly from the 20 DAT. Plant height increased linearly until flower bud differentiation occurred. The growth rate of the leaf area deceased from approximately 40 DAT. Thus, an overall sigmoid growth pattern was observed (Fig. 2).

Pearson's correlation coefficient (Table 1) was determined to assess the linear correlation among the growth characteristics of fresh weight, dry weight, leaf number, leaf area, leaf length, leaf width, plant height, and node number. The correlation between fresh and dry weight was the highest (r = 0.996). Further, fresh weight showed a high positive correlation with leaf area (r = 0.988), followed by plant height (r = 0.949), number of leaves (r = 0.911), number of nodes (r = 0.887), leaf length (r = 0.705), and leaf width (r = 0.722). Leaf area showed a high positive correlation with plant height (r = 0.981). Moreover, because the plant length considers all node lengths, a high positive correlation was observed with the number of nodes (r = 0.978).
Table 1.
Correlation analysis between growth characteristics.
| Dry weight | Number of leaves | Leaf area | Leaf length | Leaf width | Plant height | Number of nodes | |
| Fresh weigh | 0.996*** | 0.911*** | 0.988*** | 0.705** | 0.722** | 0.949*** | 0.887*** |
| Dry weight | 0.875*** | 0.969*** | 0.661** | 0.679** | 0.920*** | 0.850*** | |
| Number of leaves | 0.954*** | 0.900*** | 0.902*** | 0.989*** | 0.979*** | ||
| Leaf area | 0.771*** | 0.788*** | 0.981*** | 0.933*** | |||
| Leaf length | 0.996*** | 0.874*** | 0.936*** | ||||
| Leaf width | 0.886*** | 0.942*** | |||||
| Plant height | 0.978*** | ||||||
| Number of nodes |
The change in dry and fresh weights of perilla according to the number of days after transplanting gradually increased initially, but an expolinear function was observed that increased rapidly after 25-30 d. The modeling coefficients of dry and fresh weights were calculated using Equation (1) (Fig. 3).

Previous studies have used the expolinear function to predict the output of various crops (Cha et al., 2014; Goudriaan and Monteith, 1990). Although crop growth followed a sigmoid trend, the growth rate could be predicted by the expolinear function because the plant harvest time is advanced in a closed-type plant factory (Cha et al., 2014)
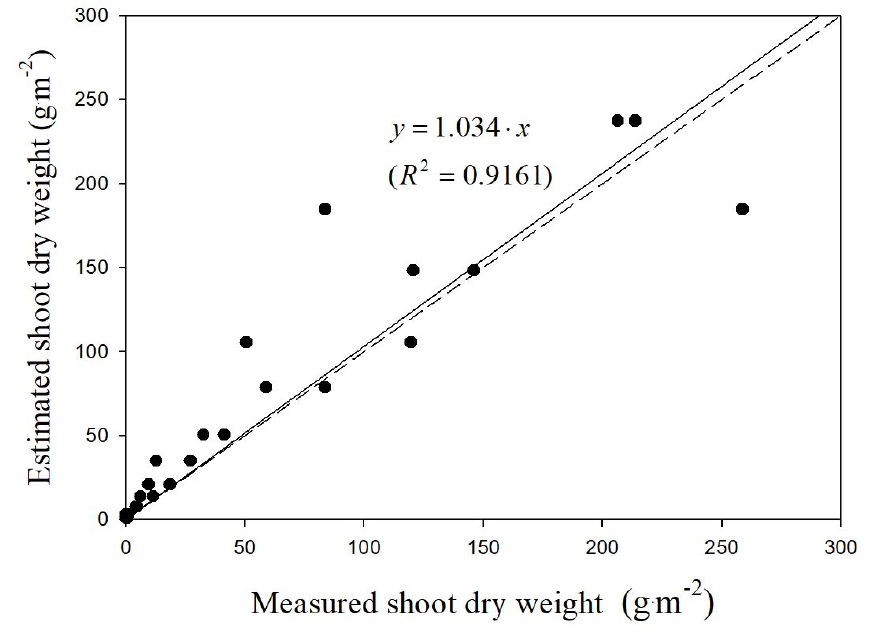
When the weight predicted using the model equation was compared with the measured value to verify the model equation, an error occurred as the weight increased. Thus, values more than the actual value could be predicted. After verifying the model formula, dry weight was predicted to be 3.4% higher than the measured value, and fresh weight was predicted to be 9.1% lower than the measured value. Further, the coefficients of determination of dry and fresh weights were 0.92 and 0.85, respectively (Figs. 4 and 5).

The correlation analysis between growth characteristics indicated a high correlation between the dry weight and fresh weight, followed by leaf area and plant length. Further, the relationship between fresh weight and leaf area could be expressed as a linear regression equation (y = 24.5 x + 92.5) (Fig. 6).

Contrastingly, the relationship between fresh weight and plant length could be expressed as a quadratic regression equation (y = 1.05x2-15.8x) (Fig. 7). The error in the value predicted by plant height increased over time compared to the error in the value predicted by leaf area. When the measured and predicted values of fresh weight were compared, the coefficient of determination of the predicted value for leaf area was 0.996 (Fig. 8), and that of the predicted value for plant height was 0.978 (Fig. 9).


Choi et al. (2003) reported the perilla growth increased as the light intensity increased in a range of 90-360 µmol·m-2·s-1. This was consistent with the results of a previous study, which reported that the perilla growth increased as the light intensity increased in the treatment group in a range of 60-320 µmol·m-2·s-1 (Sul et al., 2022). However, the light intensity in this study was set to 130 µmol·m-2·s-1, Therefore, changes in the plant growth should be studied according to changes in light intensity. Nguyen and Oh (2021) reported the perilla growth was similar when the blue light ratio was less than 30%. In this study, the blue light ratio was set to 20%. In addition, similar to Park et al. (2013), who reported that the Red/Blue/White LED light source was suitable for perilla growth and anthocyanin accumulation, in this study, we supplied a green light ratio of 10%. However, the growth rate differed depending on the type and ratio of the light source. Therefore, further research on the effects of different light ratios should be investigated. Perilla is known as a short-day plant. A previous study (Sul et al., 2022) compared perilla growth by considering treatment groups with 9:15, 12:12, 15:9, and 18:6 LED photoperiod ratios; subsequently, fresh weight, dry weight, leaf area, leaf number and plant height significantly increased. However, electrical energy use efficiency and light use efficiency did not significantly differ in all treatment groups with a day length of more than 12 h (Sul et al., 2022). Therefore, in this study, a 12 h day length was used to model perilla growth.
In conclusion, in this study, growth modeling was performed using an expolinear function to predict perilla growth. The values predicted by modeling and regression were verified by comparison with the measured values. Consequently, the regression equation using leaf area and plant height showed a higher coefficient of determination than the modeling equation using the expolinear function. Measurements of the leaf area or plant height improved the model accuracy because the growth rate in the plant factory could be predicted according to the number of days after transplanting. However, an efficient non-destructive measurement method should be investigated to predict perilla growth.
