

Introduction
Plant factories using artificial lights are highly energyintensive production systems (Mills, 2012). These production systems require efficient production management (Li et al., 2016). Because photosynthetic rate is an indicator of the growth state and growth rate of crops, it plays an important role in constructing an efficient production system. Several models have already been established for photosynthesis and growth in various plant cultivation systems (Caporn 1989; Shimizu et al., 2008). Lettuce is one of the most suitable model crops for cultivation in plant factories, and the photosynthesis of lettuce has often been studied (Jung et al., 2016).
Existing photosynthesis models are shown as simple saturation curves using the two variables of light intensity and CO2 concentration. The models based on light intensity and CO2 concentration have been studied as rectangular hyperbolas (Acock et al., 1971; Thornley, 1976; Acock and Allen, 1985; Goudriaan et al., 1985). Recently, there have been studies on harmonizing the canopy level from the leaf photosynthesis level in crop modeling (Hikosaka et al., 2016). Since the light intensity depends on the position of leaves in the canopy, measuring the photosynthetic rate of a single leaf has limitations in representing the entire crop photosynthesis. The canopy photosynthetic rate is more closely related to crop yield than to the leaf photosynthetic rate. Therefore, when using photosynthesis models as an indicator of crop growth, it is necessary to measure the canopy photosynthetic rate in plant factories.
Most of the current photosynthesis models have rarely reflected time even though the crop response to growth stages is different (Perez-Peña and Tarara, 2015) and the efficiency of light utilization decreases as leaf area increases (Green, 1987; Leadly et al., 1990; Jung et al., 2016). In particular, it is important to maximize the resource utilization efficiency of plant factories, so the photosynthetic rate of cultivated crops should be known (Kozai, 2013). Also, understanding the change in light use efficiency of crops over time helps to establish the cultivation strategy of plant factories. Niinemets (2016) reported photo-plasticity, in which photosynthetic capacity varies with leaf age. Therefore, relative factors for photosynthetic reaction over time should be applied to models.
To express the photosynthetic rate for light intensity and CO2 concentration, rectangular hyperbola equations and negative exponential equations have been used. These two equations are suitable for representing situations in which the rate of photosynthesis gradually increases to a specific saturation point. Thornley (1974) and Kaitala et al. (1982) suggested a simple model for the chemical reactions that take place in light and dark reactions of photosynthesis. This model is known to be suitable for expressing the photosynthetic rate with changes in light intensity and CO2 concentration, but there are limitations to tracking changes in other environmental factors, such as temperature and growth stage.
Modifying the existing rectangular hyperbola model would be suitable for expressing the effects of other environmental factors. Although the widely used Farquhar, von Caemmerer, and Berry (FvCB) photosynthetic model expresses the change in photosynthetic rate according to various environmental factors (Farquhar et al., 1980), it does not provide a simple form that can include the three variables of light intensity, CO2 concentration, and growth stage. Jung et al. (2017) established a photosynthetic rate model with light intensity, temperature, and growth period, but it is still necessary to construct a model including CO2 concentrations, which are more important for photosynthesis. The objectives of this study were to analyze canopy photosynthetic rates at various combinations of CO2 concentration, light intensity, and growth stage and to develop a canopy photosynthetic rate model based on a rectangular hyperbola equation.
Materials and Methods
1. Plant and Cultivation Conditions
Romain lettuce (Lactuca sativa L. cv. Asia Heuk Romaine) was hydroponically grown with deep-flow technique systems in plant factory modules at Seoul National University. Yamazaki nutrient solutions with an electrical conductivity of 1.2 dS·m-1 were supplied to the plants. Light-emitting diodes with a red : blue : white = 8 : 1 : 1 light spectrum were used as light sources (FGL-B1200; FC Poibe Co., Ltd., Seoul, Korea). Light intensity and air temperature in the growth chamber were maintained at 150 ± 20μmol·m-2·s-1 (light : dark = 16 h : 8 h) and 21 ± 1°C, respectively. The CO2 concentration were maintained at 1,000μmol·mol-1 for inducing more photosynthesis and relative humidity were maintained at 70 ± 5%. One hundred lettuce plants were grown for 20 days after transplanting (DAT) at a planting density of 16 plants·m-2.
2. Measurement of Canopy Photosynthetic Rates
Lettuce plants were placed in three identical closed acrylic chambers (1.0 × 0.8 × 0.5m) to measure the canopy photosynthetic rate. Four growth stages of lettuce were used for the measurements: 5, 10, 15, and 20 DAT. For calculating the canopy photosynthetic rate, changes in the CO2 concentration inside the chamber were measured with a combination of light intensity and CO2 concentration: five light intensities (60, 130, 200, 270, and 340μmol·m-2·s-1) and five CO2 concentrations (600, 1,000, 1,400, 1,800, and 2,200μmol·mol-1). In order to obtain the canopy photosynthetic rate, the CO2 consumption amount during the measurement period, excluding time lag, was multiplied by the chamber volume and divided by leaf area (Takahashi et al., 2008). Reductions in the internal CO2 concentration due to the leakage of the chamber were calibrated by using the measured air exchange rate (0.0077h-1). The CO2 emission due to root respiration was considered negligible because it was around 0.69% of the total CO2 consumption. The temperature and relative humidity were measured by using a sensor (S-VT200B; Soha Tech, Seoul, Korea) and collected with a datalogger (Campbell Scientific, Inc., Logan, UT, USA) every 5s. The air pressure inside the chambers was 1,013hPa. The temperature was controlled by Peltier devices, which were attached to the side wall of the chamber. Increases in relative humidity due to transpiration were controlled by silica gel installed in the chamber. Wind speeds around the plants were maintained at 0.3-0.5m·s-1. The change in CO2 concentration inside each chamber was measured by using a CO2 gas analyzer (LI-820; LI-COR, Lincoln, NE, USA) every 5 seconds.
3. Establishment of a Three-Variable Simple Multiplication Model
One-variable models for the photosynthetic rate obtained by measuring the light intensity, temperature, or growth stage are known as a rectangular hyperbola, quadratic, and exponential model, respectively. In a previous study, a three-variable simple multiplication model was constructed to express the lettuce canopy photosynthetic rate (Jung et al., 2017). Since the temperature inside the chamber was kept constant in previous study, the simple multiplication model can be summarized as follows:
where P is canopy photosynthetic rate (μmolCO2·m-2·s-1), I is light intensity (μmol·m-2·s-1), C is CO2 concentration (μmol·mol-1), t is DAT (d), and R is dark respiration (μmol- CO2·m-2·s-1); a, b, and c are regression parameters. Nonlinear regression analysis was performed in the SPSS (IBM, New York, NY, USA) statistical program using the measured canopy photosynthetic rate according to light intensity, CO2 concentration, and growth stage.
4. Establishment of a Three-Variable Modified Rectangular Hyperbola Model
A rectangular hyperbola model constructed by Acock et al. (1976) and supplemented by Kaitala et al. (1982) is expressed as follows:
where α and β are photochemical efficiency (μmolCO2·mol-1) and carboxylation conductance (s-1), respectively.
The photochemical efficiency, carboxylation conductance, and dark respiration obtained by nonlinear regression analysis are shown on a two-dimensional plane with the growth stage as the X axis (Fig. 3). The photochemical efficiency, carboxylation conductance, and dark respiration were determined using empirical equations (Jung et al., 2017):
where a1, a2, b11, b2, c1, and c2 are regression parameters. The regression coefficients were determined through the nonlinear regression analysis of photochemical efficiency, carboxylation conductance, and dark respiration. The modified rectangular hyperbola model was constructed by substituting Eqs. 3-5 into Eq. 2.
5. Validation of the Canopy Photosynthetic Rate Models
One hundred additional lettuce plants were cultivated under the same environmental conditions as for the measurement of the canopy photosynthetic rate. The R2 value was obtained through a regression analysis of the measured and estimated canopy photosynthetic rates.
Results
1. Changes in Shoot Fresh Weight and Leaf Area with Growth Stage
As the growth stage progressed, the fresh weight and leaf area of the lettuce exponentially increased and reached 97.3 ± 2.94g and 872.0 ± 44.50cm2 at 20 DAT, respectively. (Fig. 1). The fresh weight and leaf area were regressed to the following exponential models with days after transplanting as the growth stage:
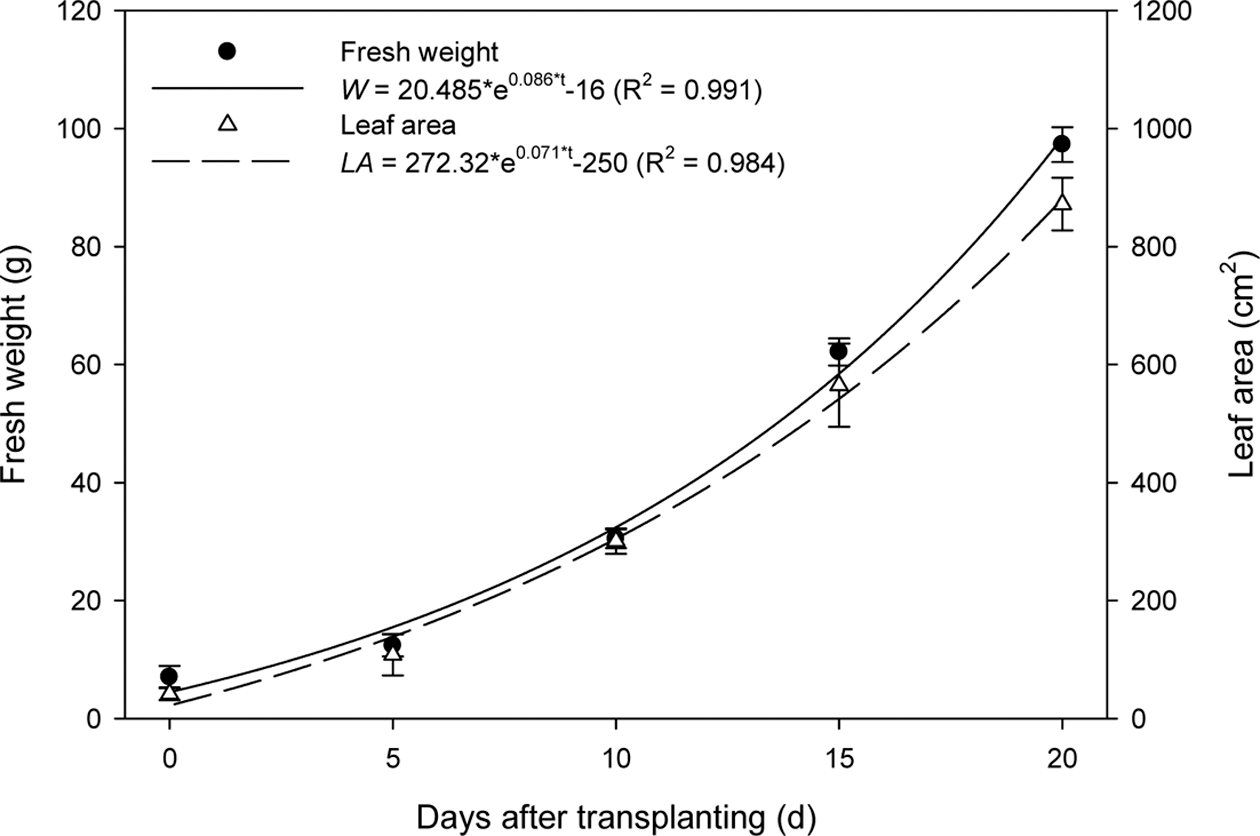
where W is fresh weight (g) and LA is leaf area (cm2). Regression analysis showed that the R2 values of Eqs. 6 and 7 were 0.991 and 0.984, respectively.
2. Regression Results of Simple Multiplication and Modified Rectangular Hyperbola Models
The canopy photosynthetic rate of the lettuce was plotted on a three-dimensional space using light intensity and CO2 concentrations as the X and Y axes (Fig. 2). In the figure, black dots show the canopy photosynthetic rate obtained from actual measurement and the curved surface is the estimated canopy photosynthetic rate acquired from the simple multiplication model. The simple multiplication model (curved surface) was determined by Eq. 8:
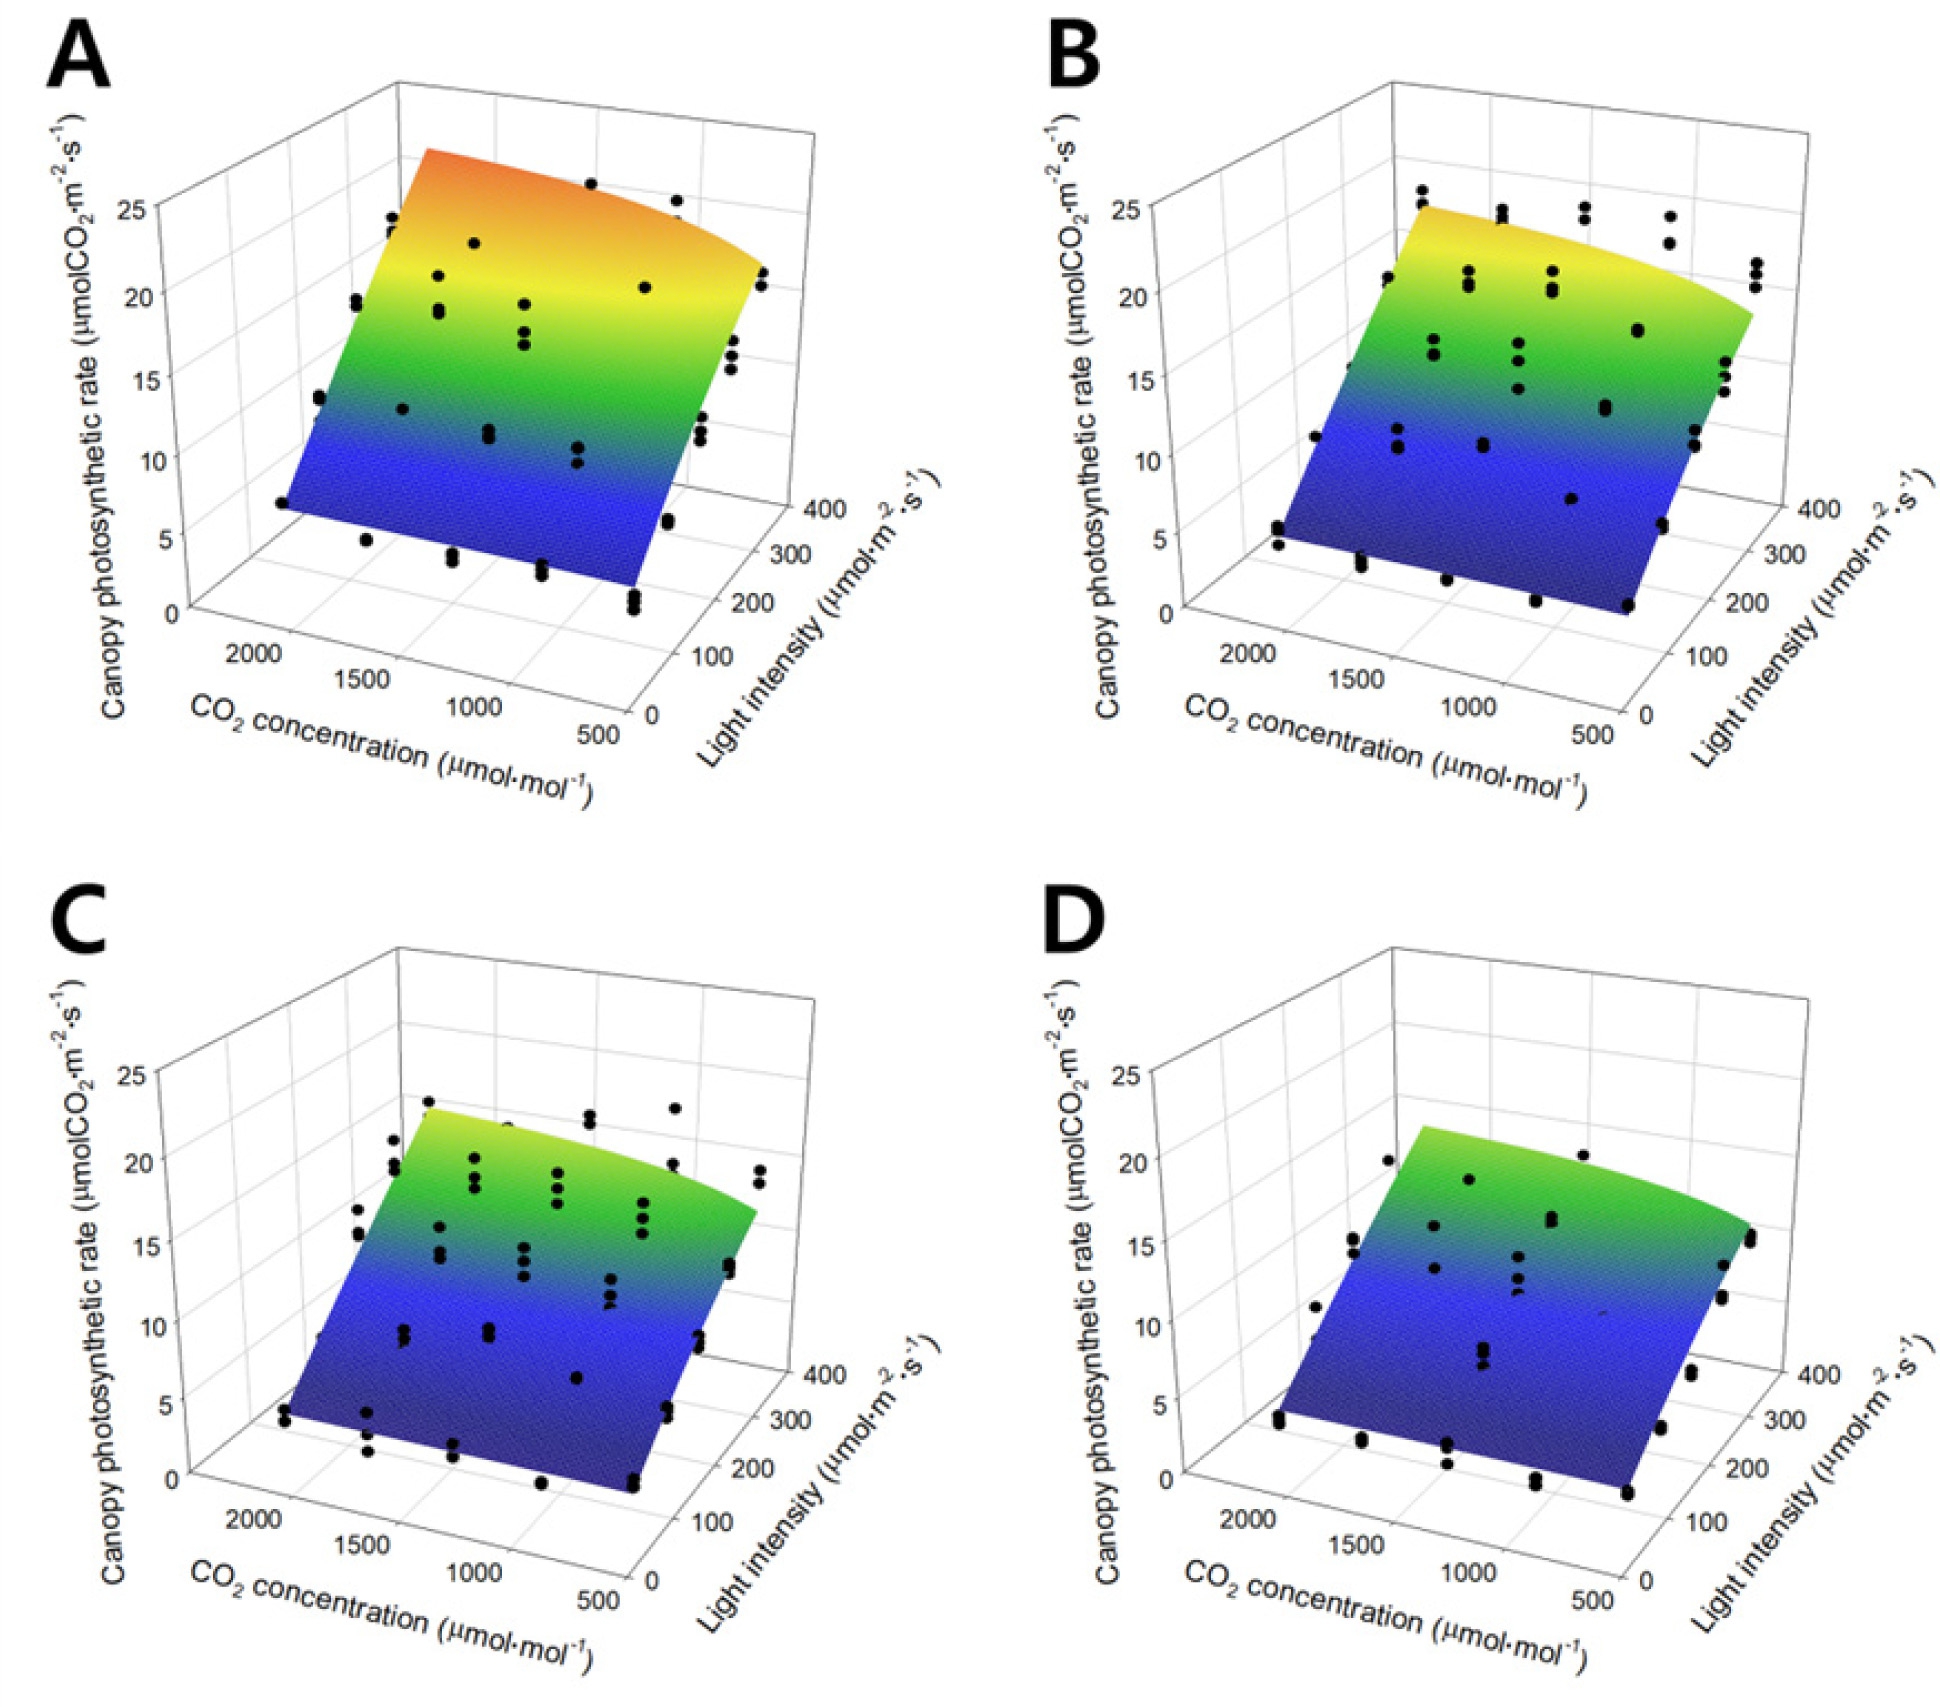
Regression analysis of Eq. 8 resulted in an R2 value of 0.918. As light intensity increased, the canopy photosynthetic rate linearly increased. As the CO2 concentration increased, the canopy photosynthetic rate increased and finally saturated. As the growth stage progressed, the maximum canopy photosynthetic rate decreased, while the saturation pattern of the canopy photosynthetic rate with light intensity and CO2 concentration was maintained.
The photochemical efficiency, carboxylation conductance, and dark respiration are shown on a two-dimensional plane by substituting the regression coefficients in Table 1 (Fig. 3). The photochemical efficiency exponentially decreased as the growth stage progressed (Fig. 3A). The carboxylation conductance and dark respiration appear as quadratic curves, which increased and decreased as the growth stage progressed (Figs. 3B and 3C). In the canopy photosynthetic rates plotted on the three-dimensional space with light intensity and CO2 concentration (Fig. 4), the black dots show the canopy photosynthetic rate obtained from actual measurement and the curved surface is the estimated canopy photosynthetic rate acquired from the modified rectangular hyperbola model. The modified rectangular hyperbola model is expressed by Eq. 9. As light intensity increased, the canopy photosynthetic rate linearly increased. As the CO2 concentration increased, the canopy photosynthetic rate increased and gradually saturated. As the growth stage progressed, the maximum canopy photosynthetic rate decreased, while the saturation pattern of the canopy photosynthetic rate with light intensity and CO2 concentration was maintained.
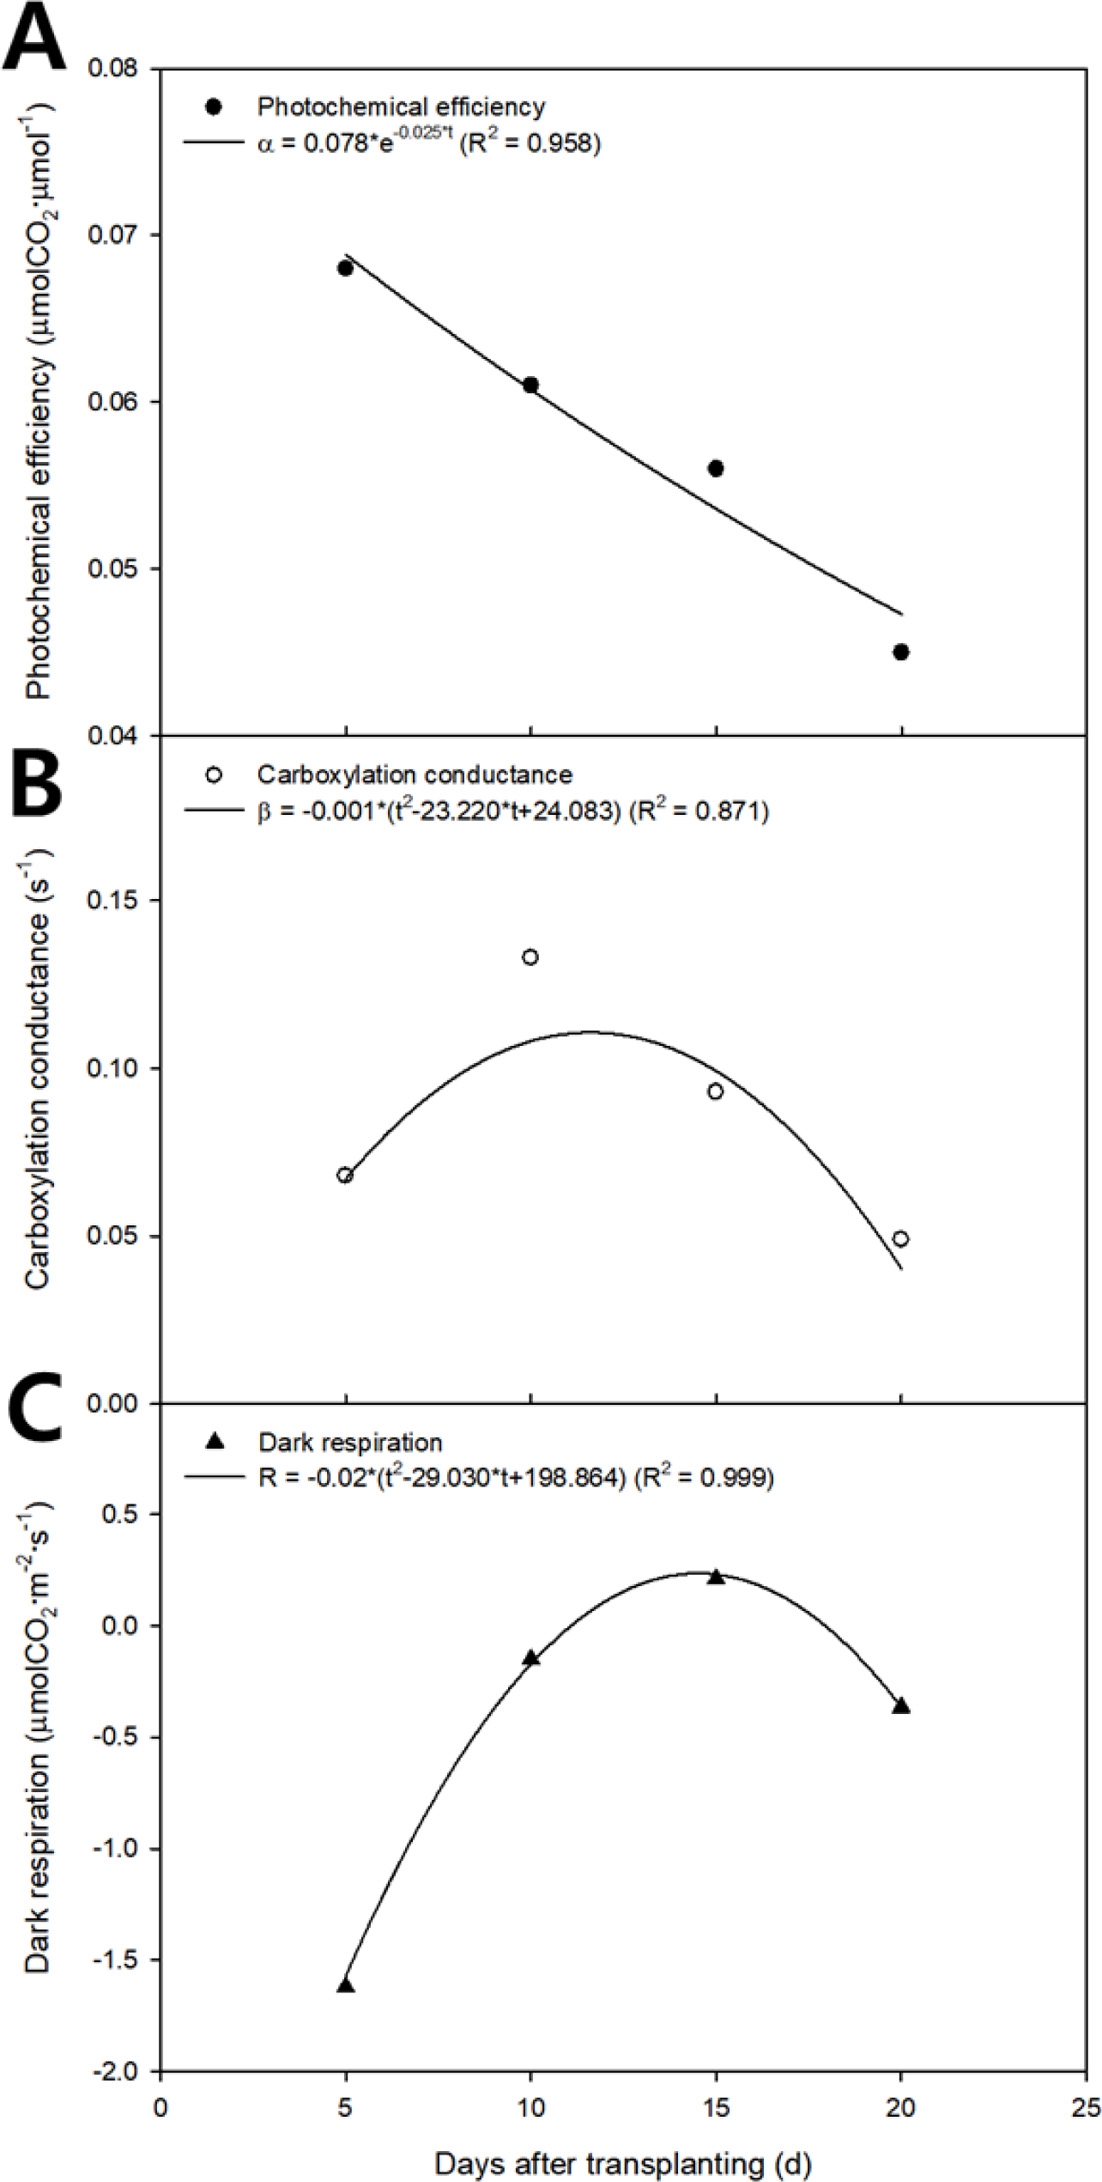
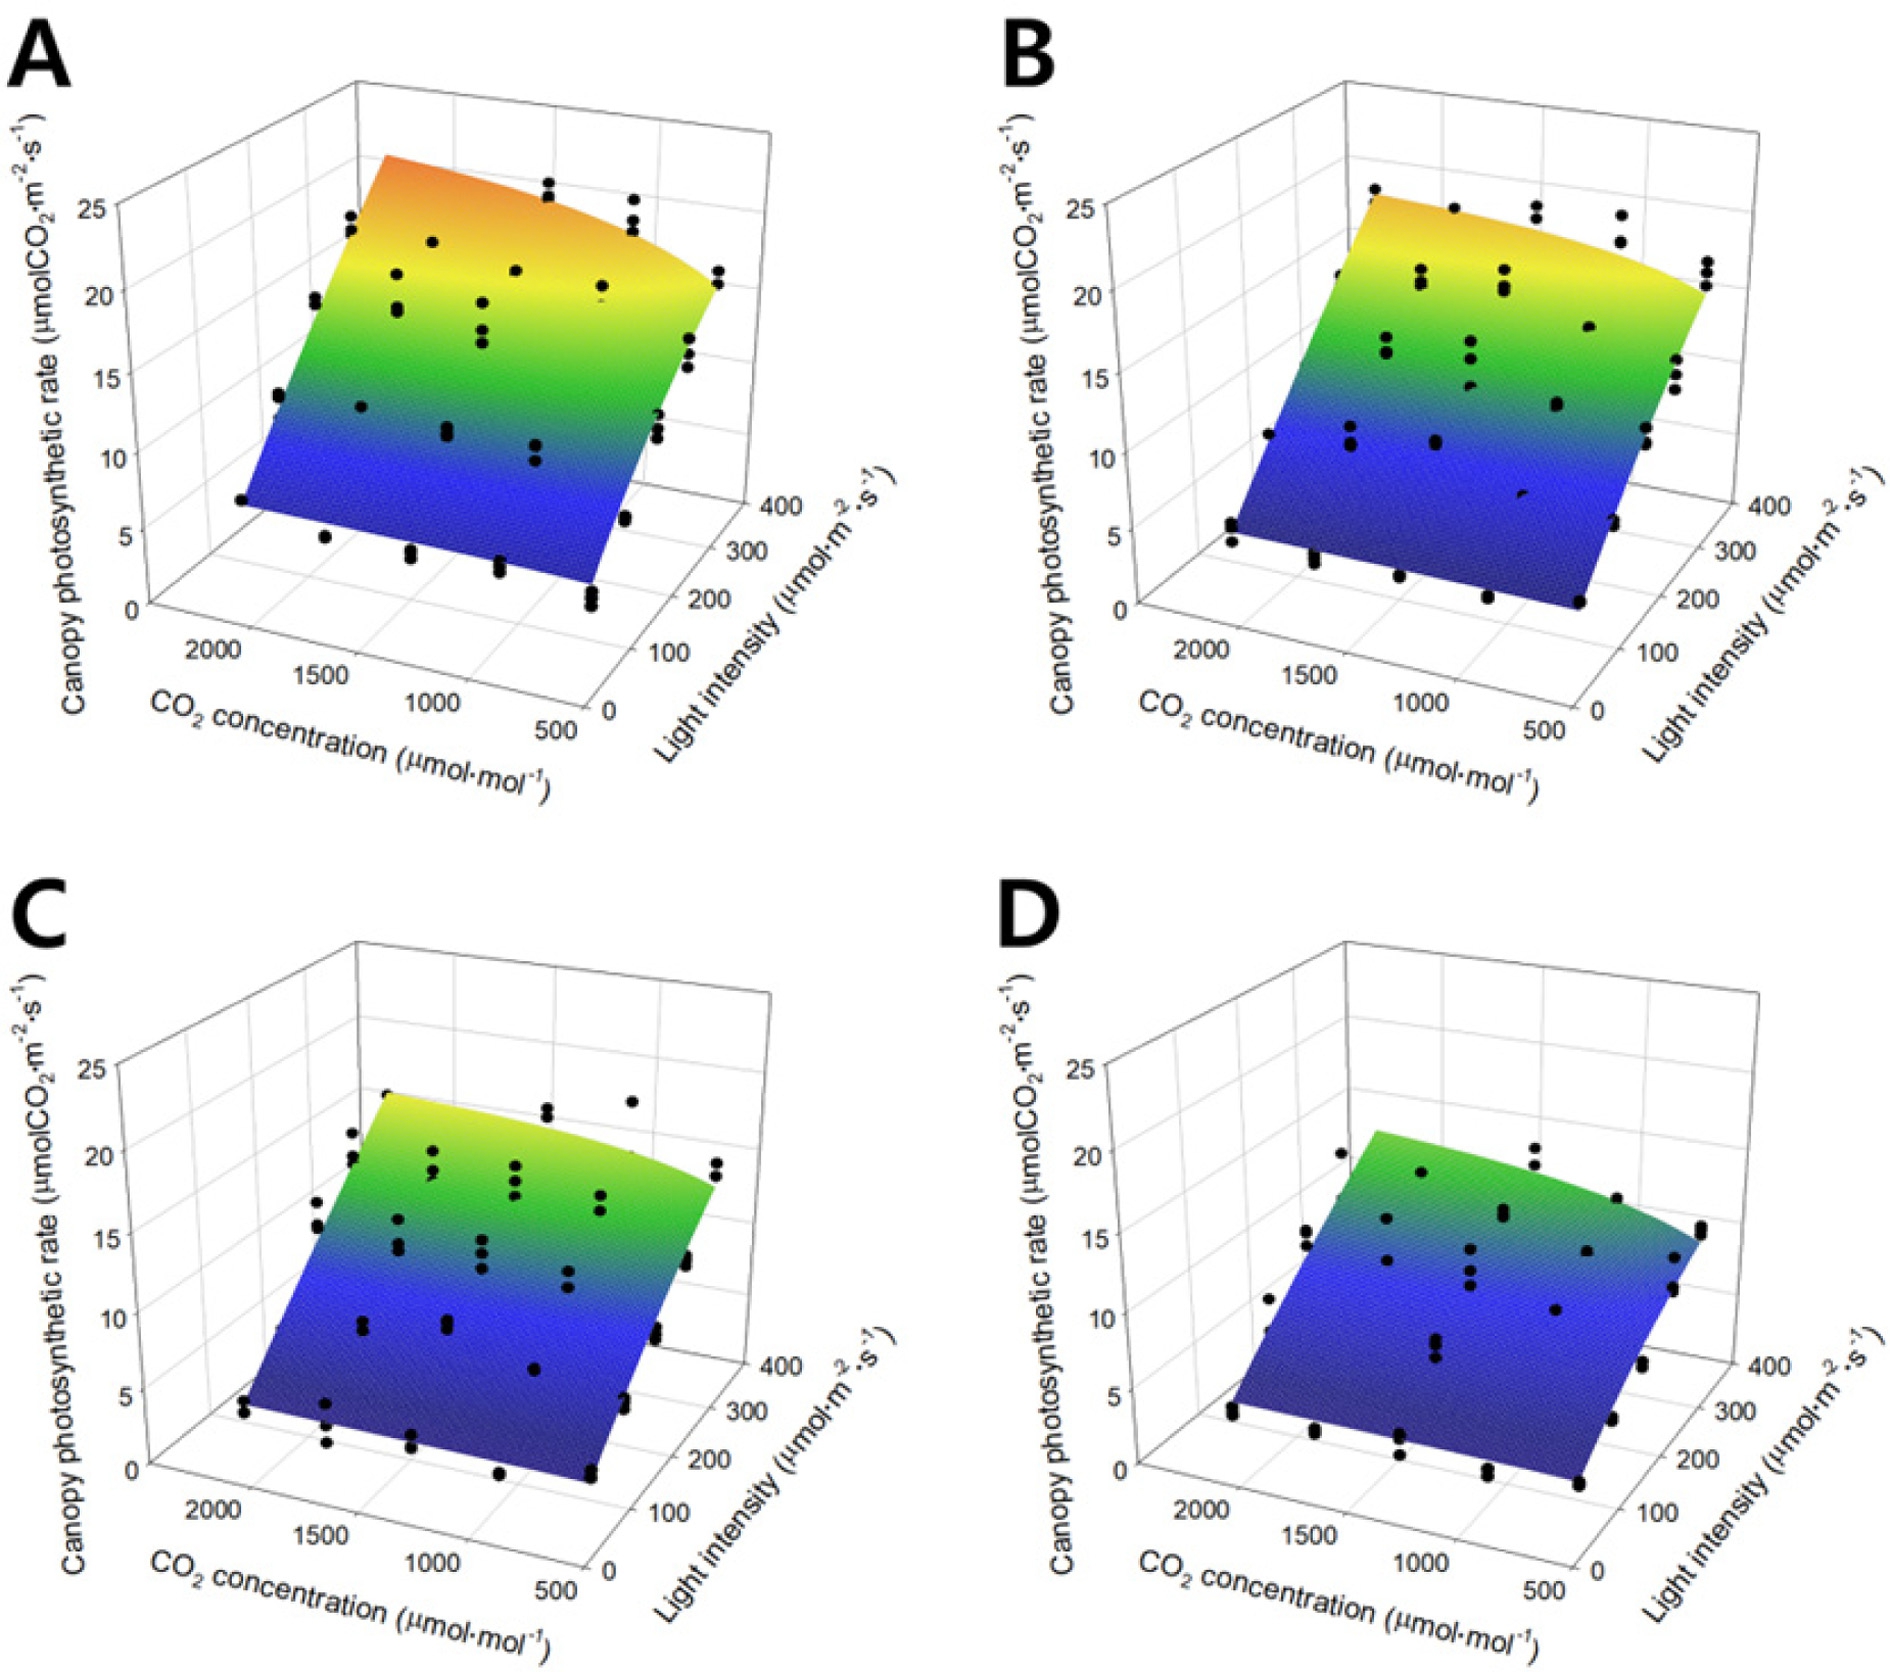
Table 1. Regression coefficients and R2 values calculated through regression analysis in the modified rectangular hyperbola model according to growth stage.
3. Validation of the Canopy Photosynthetic Rate Models
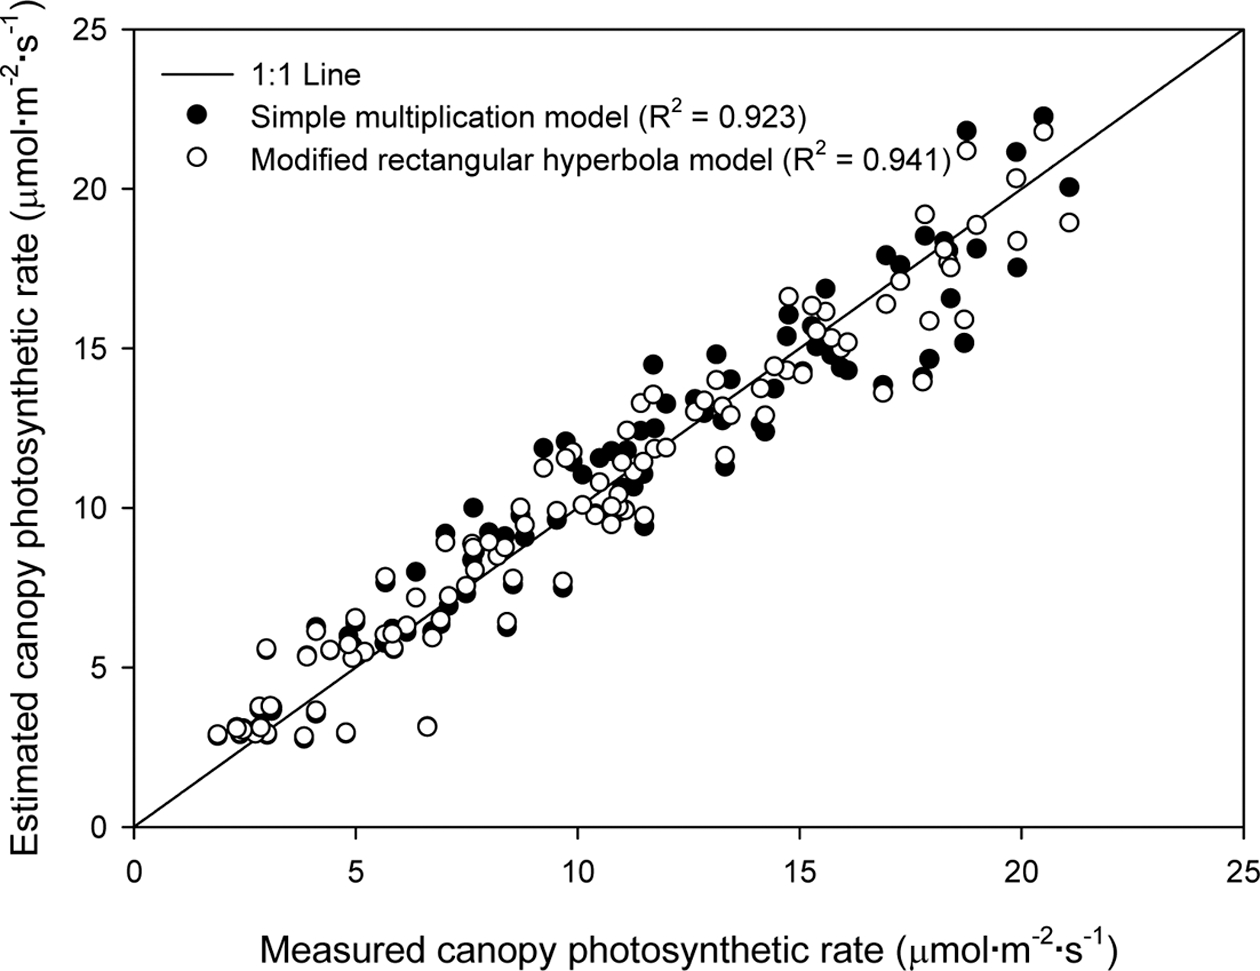
For validation, the regression analysis result for the two models was plotted on the 1 : 1 line (Fig. 5). The R2 value and RMSE of the simple multiplication model was 0.923 and 2.114, and the R2 value and RMSE of the modified rectangular hyperbola model was 0.941 and 1.622, which was slightly higher than that of the simple multiplication model. The canopy photosynthetic rates ranged from 2.5-23μmol·m-2·s-1 for both measured and calculated values.
Discussion
The plant growth stage is considered important when constructing practical photosynthetic models because plants have different responses at different growth stages. Fresh weight and leaf area were used as indicators for classification into germination, vegetation, and reproduction stages (Mokhtarpour et al., 2010), and the photosynthetic rate was also used (Li et al., 2009; Kim et al., 2013). Although the classification of growth stages can vary depending on the characteristics of the plants, Lin (2001) reported that fresh weight was the most economic key element in classifying leaf vegetables. Therefore, it was appropriate to separate the growth stage of leaf vegetables by fresh weight in this study.
The R2 values of canopy photosynthetic rates obtained by using the developed models varied from 0.95 to 0.78 at each stage with slight overestimations (Fig. 4). This seems to be because the characteristics of the canopy structure were not sufficiently considered in the photosynthesis model (Monsi et al., 1973). Kim et al. (2016) indicated that the photosynthetic rate has a close relationship with the absorption, reflection, and penetration of light in the canopy structure. Therefore, a more precise estimation of light interception by the canopy could increase the R2 values.
Olessen and Grevesen (1997) also reported that light extinction coefficients differed depending on plant type. Previous research has indicated light extinction coefficients of 0.63-0.86 for certain vegetables, such as tomato, cucumber, and paprika, and 0.40-0.65 for cauliflower. The light extinction coefficients depend on leaf and canopy conditions as well as environmental factors. Particularly in closed plant production systems, light interception significantly differs depending on the levels of light reflection and light diffusion.
Among various environmental factors, light is the most influential variable in plant growth and development (Inada and Yabumoto, 1989). Due to the characteristics of the lettuce, the higher the light intensity, the higher the growth obtained (Pavlou et al., 2007). The increase in light intensity increased the nitrate reductase in lettuce and it should affect the photosynthesis (Gaudreau et al., 1995). In order to increase light utilization efficiency and improve crop productivity, light sources installed in plant factories should be designed in a form suitable for photosynthesis (Massa et al., 2008).
Some studies have developed the photosynthetic rate models and used the models to predict crop productivity (Kim and Lieth, 2012). In addition, the enrichment of CO2 concentration promotes the growth of lettuce (Caporn, 1989; Campbell et al., 1990). However, plant cultivation at saturation points of light intensity and CO2 concentration is economically inefficient. When the photosynthetic rate model of the crop has been established, the economic CO2 fertilization level can be determined. The modeling of photosynthetic rates using light intensity and CO2 concentration at each growth stage will be helpful in constructing strategic plant production systems. It is expected that the developed model will contribute to the determination of adequate CO2 concentration and light intensity conditions with growth stage in plant factories.
