

Introduction
Materials and Methods
1. Plant material and growth conditions
2. Potassium salts stress and tolerance tests
3. Measurements
4. Statistical analysis
Results
Discussion
Introduction
Plug seedling production has shown an increasing proportion of the horticulture industry, due to its efficiency and economy of scale (Choi et al., 1997). In particular, since nursery techniques of container seedlings have been applied to agricultural production, specialized vegetable seedlings production has become a highly competitive business (Herrera et al., 2008).
Control of stretching is a high priority for the Korean nursery industry, because the high stem density at which the seedlings are grown, together with either low natural radiation levels during the monsoon season and winter, or hot summer, often result in the production of batches of badly stretched seedlings (Kim et al., 2008). Hence, the importance of growth control, referring to numerous production practices in which overgrowth is one of the most frequently stated problems affecting seedling quality, especially in high-temperature season has been emphasized. Vegetable seedlings can rapidly outgrow the optimal size of transport and transplantation. In addition, seedlings with excessive stem elongation show decreased survival in the field. Therefore, research on practicable methods to inhibit excessive growth and to improve the quality of seedlings has shown to be necessary.
A considerable amount of literature has been published on growth control to grow high-quality seedlings. It has established that manipulating the difference in day and night temperature can enhance the quality of seedlings, and help to keep seedlings at stocky size since the stem growth rates show a positive relationship with this difference (Erwin and Heins, 1995; Liu 2018). However, during the production season, it is difficult and costly to cool to the optimal temperature, considering the current production model of growing seedlings in large greenhouses, especially in warm climates. Brushing, a mechanical method, has been used, but it can easily cause physical damage (Latimer and Thomas 1991). Several attempts have been made to restrict the water supply to gain stocky and stress-resistant seedlings (Alem et al., 2015; Liptay et al., 1998; ). Determination of water quantity and irrigation timing before too much stress causes damage demand abundant experience, and overstressed seedlings resulting from serious water deficits show stunted growth, and poor stand establishment when transplanted (Alem et al., 2015; Liptay et al., 1998; ). Another typical method is to apply plant growth retardants (PGRs), which are also effective at suppressing height growth (Agehara and Leskovar, 2017). But the drawback of PGRs, as agrochemicals, should not be ignored. PGRs can cause environmental pollution; and if overdosed, may have negative effects on seedling quality. The previously mentioned methods, which essentially impose internal or external stress to stunt or slow the growth, are admittedly effective but do not fully meet the requirements of the growers, such as low cost, eco-friendliness, and practicality in the seedling nursery.
However, there has been little discussion to date about the possibility of growth control using the theory of salinity stress-induced seedling growth inhibition. Salinity in irrigation water, and in soil characterized by a high concentration of soluble salts, limits plant growth (Acosta- Motos et al., 2017). When the electrical conductivity (EC) is 4 dS·m-1 or more, equivalent to 40 mM NaCl, the irrigation water or soil is thought to be saline (Munns and Tester, 2008). Most studies in this field of salinity stress have only focused on the adverse effects caused by salinity stress, the salt resource is usually Nav+, and the studies have addressed how to mitigate the damage (Acosta-Motos et al. (2017). In this article, we attempt to discuss a method to control growth using high-salinity stress (EC > 4 dS·m-1). Potassium (K) salt is a better source of salt stress than sodium (Na) salt, with the advantages that it is abundant in nature, and plays an important role in all living organisms, related to all abiotic and biotic stresses (Zörb et al., 2014). As a source of potassium, agricultural potash fertilizer is widely used in agricultural production, with more than 30 billion kg consumed worldwide each year (FAO, 2019); in other words, it is an easily accessible source for seedling growers.
This study provides new insights into salinity stress- induced seedling growth inhibition. We supposed that a high-salinity level of potassium salt could inhibit vegetable seedling growth, and expected a balance between the inhibition and the seedling quality. Considering the widespread consumption of tomatoes, and the specialized seedling production of tomatoes has long been a commercial activity, it was used as the research species in this study.
Materials and Methods
1. Plant material and growth conditions
Tomato (Lycopersicon esculentum Mill.) seedlings from Hoban Seedling Company (Chuncheon, Korea) were used. The seedlings were grown in a cylindrical paper pot placed in 32-hole plug trays (Bumnong Co., Ltd., Jeongeup, Korea). When three true leaves had unfolded, the tomato seedlings were transported from Hoban's seedling nursery to the experimental greenhouse on the farm of Kangwon National University (Chuncheon, Korea). During the seedling experiment, the seedlings commercial fertilizer (Wonder Grow Fertilizers, Chobi Co., Ltd., Seoul, Korea) was applied twice a week, the same management as Hoban nursery. This research was conducted during the crop season of 2018 and 2019 in greenhouse conditions.
2. Potassium salts stress and tolerance tests
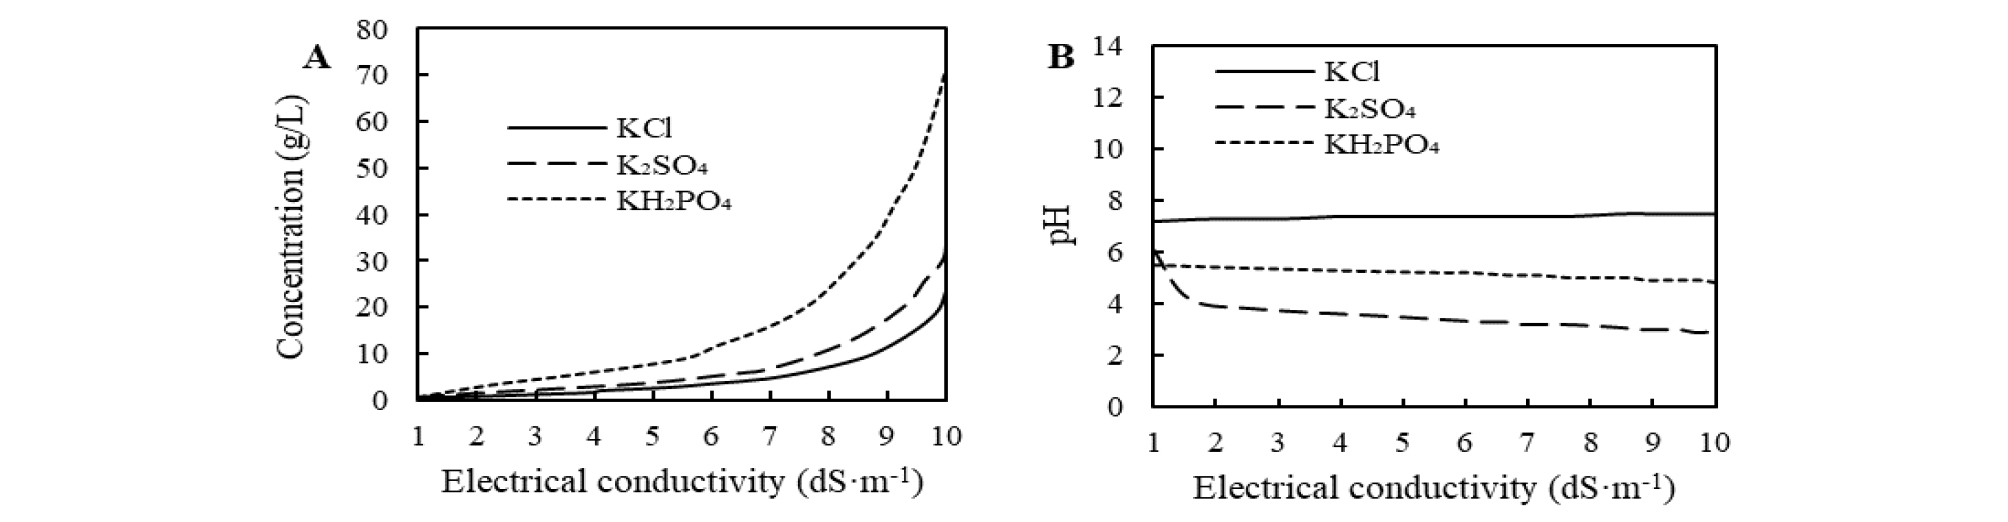
Potassium was added in the form of sulfate of potash (SOP; K2SO4), muriate of potash (MOP; KCl), and monopotassium phosphate (MKP; KH2PO4), which are commonly used as fertilizer in agricultural production. Two solutions of each potassium salt were prepared at salinity levels of (5 and 10) dS·m-1, respectively, by dissolution in tap water. A conductivity meter (HI-8633 Multi-range Conductivity Meter, USA) was used to measure the EC of the solution. The pH and concentration of all potassium sources with different salinity levels were measured at the start of the experiments, and Fig. 1 shows their relative curves.
After three true leaves had unfolded, tomato seedlings were treated with the potassium solutions. Each saline solution was used to treat the seedlings by saturating the substrate of seedlings one, two, or three times, respectively. The interval between treatment times was 5 days. The control seedlings were irrigated only by tap water (EC 0.2 dS·m-1). During the experiment, all the seedlings were grown under the same conditions.
After the above experiments, an optimal combination (the type of potash fertilizer, salinity level, and addition times) was selected to investigate the adaptability and survivability of the tomato seedling treated by excessive potassium fertilizer to harsh environmental conditions, including drought, chilling, and storage conditions. In drought and chilling tests, tomato seedlings were pretreated with potassium and then grown for a week. For drought tolerance investigation, the water provided to the treated seedlings and control was restricted; and for chilling resistance test, they were grown at low temperature (5°C). In storage experiments, pretreated and untreated seedlings were stored in low temperature (5, 9, 12, and 15)°C storage room after potassium pre-treatment. During this experiment, the seedlings were exposed to darkness and drought, referring to the transportation conditions after the sale of seedlings from the seedling nursery.
3. Measurements
Growth indices were investigated at the initial time of treatment, and at the time that the seedlings reached the sale size of tomato seedling, which is normally at the seven or eight leaves stage. Eight seedling samples from each treatment were randomly selected. The substrate was removed from the root by gently flowing water. The weight of the seedlings was measured by electronic balance. The plant height was determined by a ruler from the main stem base to the top, and the stem diameter was determined by Vernier calipers at the internode above cotyledons (Fan et al., 2013). The relative chlorophyll contents (SPAD) of leaves were determined using a SPAD analyzer (SPAD-502 Plus, Konica Minolta Sensing Inc., Osaka, Japan). All fully unfolded true leaves were separated from the shoot, and the total leaf area per plant was determined by leaf area meter (LI-300; LI-COR). Samples were dried at 60°C in the oven (Mov-212F, Sanyo Electric Co., Ltd., Osaka, Japan) for at least 72 hours, to obtain constant mass. Relative water content (RWC) in seedling leaf was assessed using the ratio of leaf fresh weight to leaf turgid weight in water restriction treatment. Relative ion leakage in leaf was estimated by leakage of electrolytes during chilling stress. The damage of the shoot was assessed on a qualitative 10-point scale for every seedling during the storage period.
Root-to-shoot ratio (R/S; Eq. (1)), net assimilates rates (NAR; Eq. (2)), compactness (Eq. (3)), the relative growth rate of plant height (RGRH; Eq. (4)), and relative growth rate of biomass (RGRB; Eq. (5)) values were calculated as follow:
| $$\mathrm R/\mathrm S(\mathrm g\cdot\mathrm g^{-1})=\frac{Shoot\;dry\;weight}{Root\;dry\;weight}$$ | (1) |
| $$\mathrm{NAR}(\mathrm g\cdot\mathrm m^{-2}\cdot day^{-1})=\frac{W_1-W_0}{t_1-t_0}\times\frac{InL_1-InL_0}{L_1-L_0}$$ | (2) |
W1and W0 : initial and final total dry weight,
t1-t0: growing period (days),
L1and L2: initial and final leaf area
| $$\mathrm{Compactness}\;(\mathrm{mg}\cdot cm^{-1})=\frac{TOP(leaf+stem)\;dry\;weight}{Plant\;height}$$ | (3) |
| $$RGR_H\;(\mathrm{cm}\cdot\mathrm{cm}^{-1}\cdot day^{-1})=\frac{InH_1-InH_0}{t_1-t_0}$$ | (4) |
H0and H1: initial and final height,
t1-t0: growing period (days)
| $$RGR_B(\mathrm g\cdot\mathrm g^{-1}\cdot day^{-1})=\frac{InB_1-InB_0}{t_1-t_0}$$ | (5) |
B0and B1: initial and final dry weight,
t1-t0: growing period (days)
4. Statistical analysis
We performed the analysis of variance (ANOVA) to evaluate growth indices, and the significant differences among all treatments were compared using Fisher’s least significant difference (LSD) test at P < 0.05. We performed the general linear model (GLM) for growth response (RGRH, RGRB, NAR, and compactness) with the univariate analysis of variance. Between-subject effects evaluated variances of potassium sources, electrical conductivity, application times, and interaction effects. We also performed the analysis of variance (ANOVA), to evaluate the growth response between control and every treatment. Correlation coefficients (r) between growth indices were also analyzed.
Results
Shoot and root growth of tomato seedlings responded strongly to repeated potassium addition with high salinity levels. At the salinity level of 10 dS·m-1, adding KCl three times reduced the shoot dry matter production, root dry matter production, and leaf area by (29.6, 30.3, and 25.3) %, respectively, while adding K2SO4 three times reduced them by (25.4, 24.2, and 30.6) %, respectively (Table 1); however, the addition of 10 dS·m-1 KH2PO4 resulted in leaf damage, so no data was recorded. At the salinity level of 5 dS·m-1, adding KCl or K2SO4 three times reduced those characteristics similarly, but their reductions were less than for the higher salinity condition. However, with 5 dS·m-1 KH2PO4 addition, except for the leaf area, there were no significant decreases in shoot and root dry matter production (Table 1). SPAD value was not significantly affected by K2SO4 addition by either the different salinity levels or application times, but the thrice application of KCl or KH2PO4 caused a reduction (Table 1). There were no significant effects of potassium salinity stress on the root-to-shoot ratio (Table 1). Stem diameter tended to be thicker when potassium salts were added, while 10 dS·m-1 KCl addition once was the most effective among all treatments, with a significant increase of 15 % (Table 1). There were highly significant direct correlations between all measured items with the one-time addition of KCl, K2SO4, or KH2PO4, the same as control. However, the lowest correlations – non-significant or negative – were recorded for two- and three-times addition (Table 2).
Table 1.
Influence of potassium salts with different salinity and application times on dry matter production, SPAD, leaf area, stem diameter, and root to shoot ratio on tomato seedlings growth.yRelative chlorophyll content.
xValues followed by different letters indicate a significant difference between the treatments according to Fisher’s Least Significant Difference
(LSD) test at the P < 0.05 level. The hyphen in the middle of letters represents the omission of the middle letter.
Table 2.
Correlation coefficients (r) between growth indices in tomato seedlings as affected by potassium salts with different salinity and application times.In the ANOVA, the results of between-subject effects showed that potassium types and application times were the most significant factors for NAR, compactness, RGRH, and RGRB, and the EC levels were significant only in RGRH (Table 3). Mean RGRH (), during the 20 day growth period, varied from ((0.066 ± 0.001) to (0.074 ± 0.001)) cm·cm-1· day-1. There were significant decreases in RGRH of (5.4, 5.6, and 7.5) % with 10 dS·m-1 KCl addition once, twice, and thrice, respectively, and of (3.7 and 8.4) % with 5 dS·m-1 KCl addition twice and thrice, respectively, compared with control (Fig. 2A, Table 3). There were also significant decreases with 10 dS·m-1 K2SO4 or 5 dS·m-1 KH2PO4 addition for only three application times (Fig. 2A, Table 3). RGRB varied from ((0.111 ± 0.002) to (0.131 ± 0.002)) g·g-1·day-1 and also tended to decrease with the repeated addition of three times of potassium salts (Fig. 2B, Table 3). The trend of NAR was similar to that of RGRB (Fig. 2C, Table 3). Repeated addition with KCl, K2SO4, or KH2PO4 also decreased seedling compactness (Fig. 2D, Table 3); however, only one-time addition with 10 dS·m-1 KCl or 5 dS·m-1 KH2PO4 increased compactness by (11 or 9.6) %, respectively.
Table 3.
Results of analysis of variance for the relative growth rate of seedling height (RGRH), and biomass (RGRB), net assimilate rates (NAR), and compactness of tomato seedlings as affected by potassium salts with different salinity and application times. Bold type indicates the statistical significance of P & 0.05.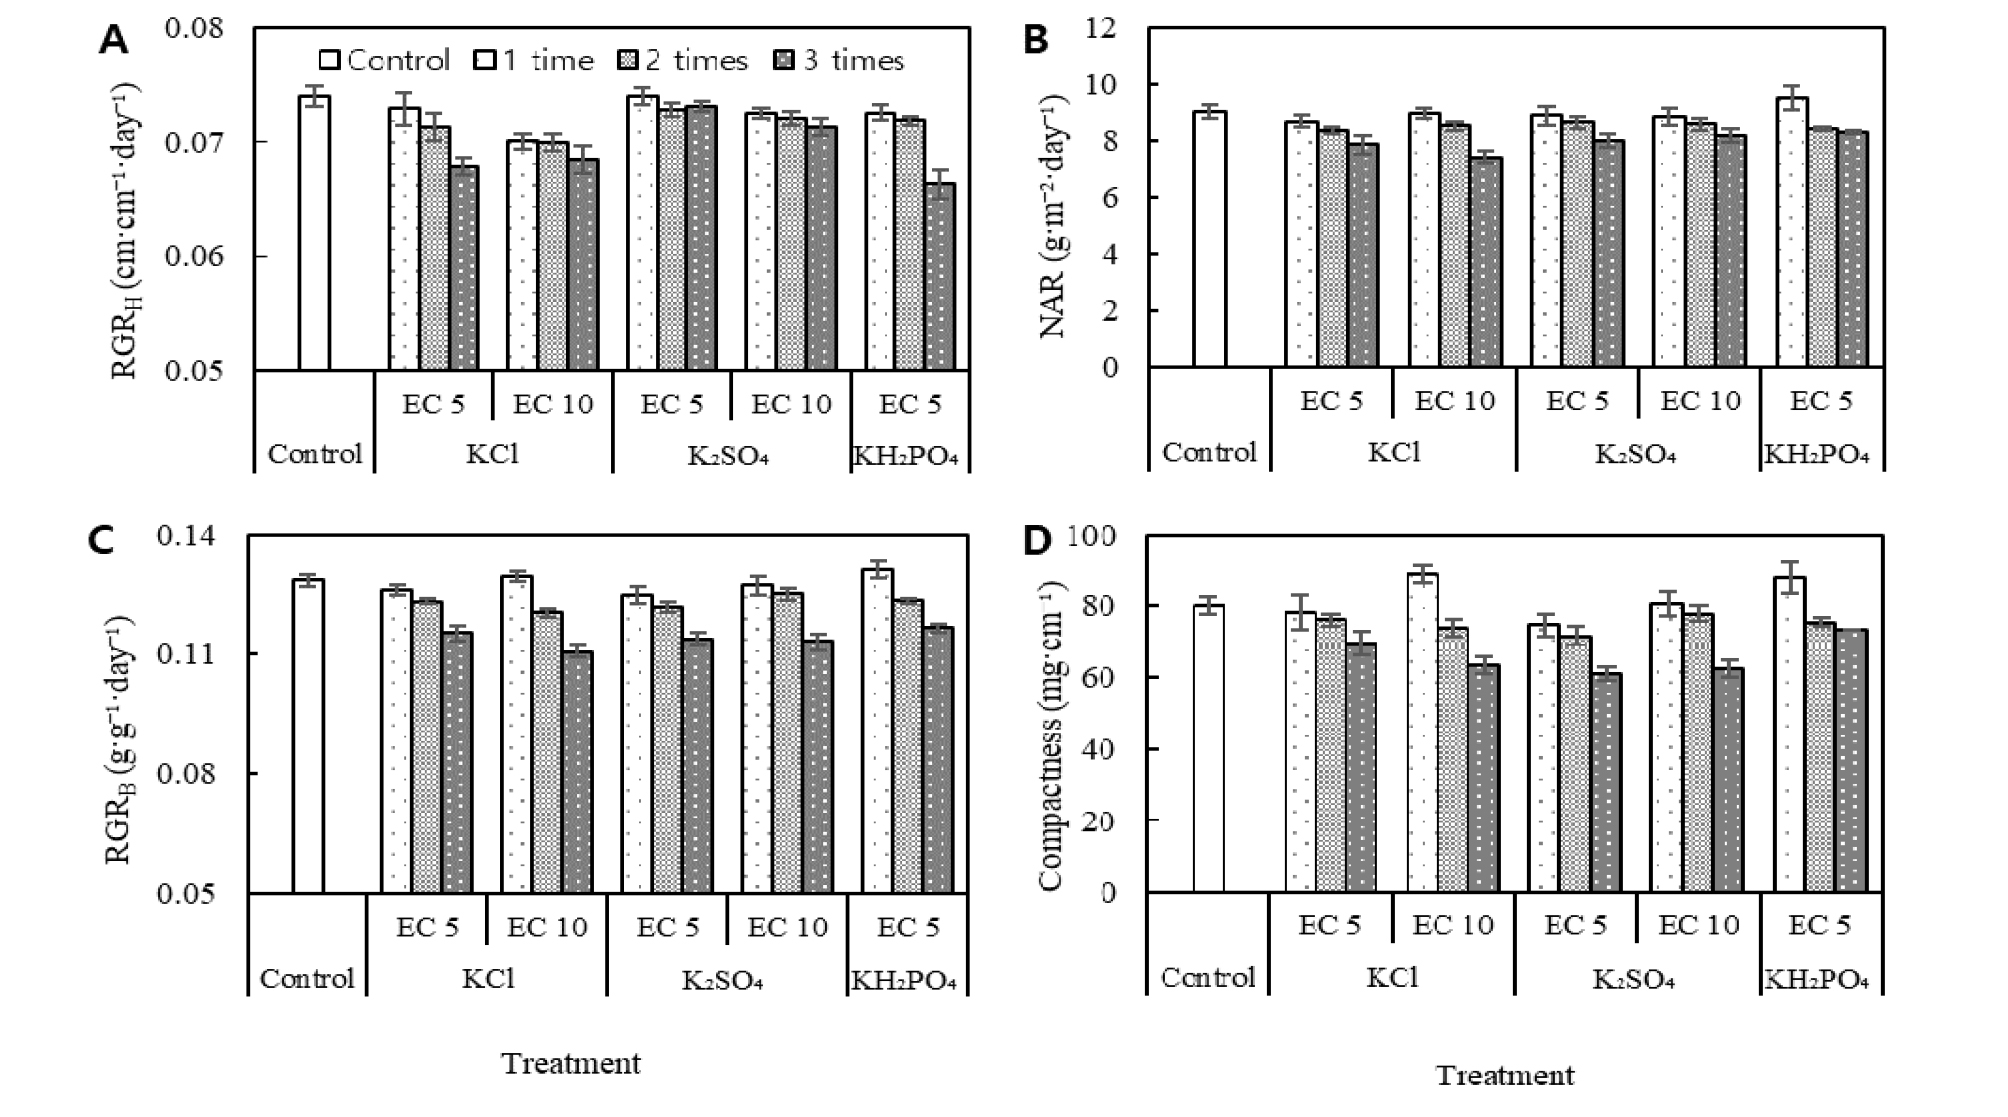
Fig. 2.
Effects of KCl, K2SO4 and KH2PO4 addition with EC levels of 5 dS·m-1 and 10 dS·m-1 and tomato seedling growth. Panel A shows relative growth rate of height (RGRH). Panel B shows relative growth rate of biomass (RGRB). Panel C shows net assimilate rates (NAR). Panel D shows compactness. Bar charts with different fillings denote the potassium addition times. Bars represent mean values (± SE). See Table 3 for complete statistical results.
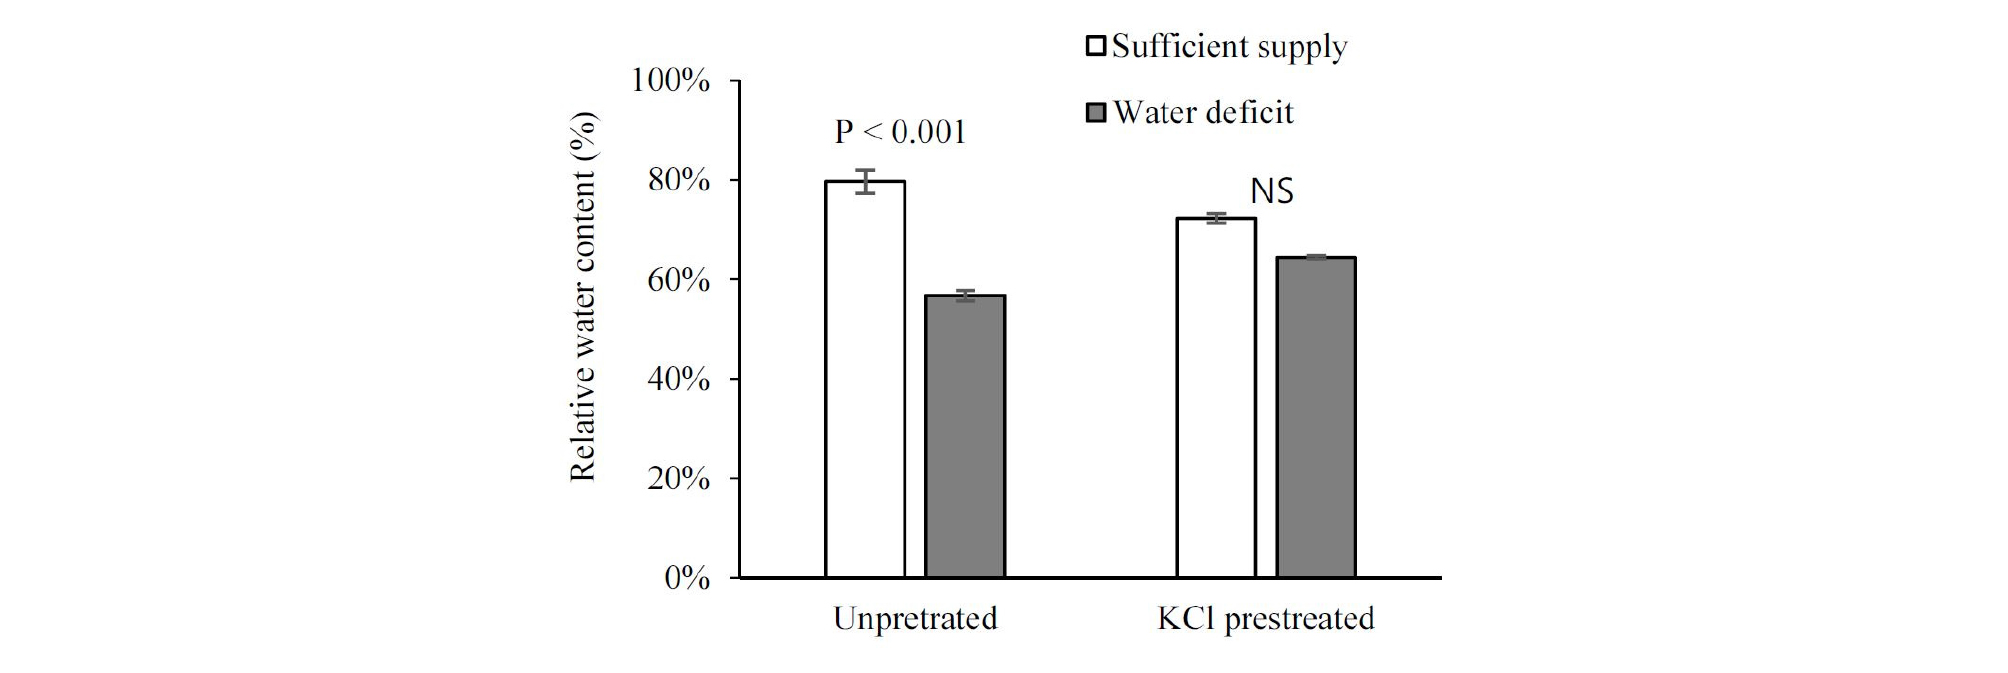
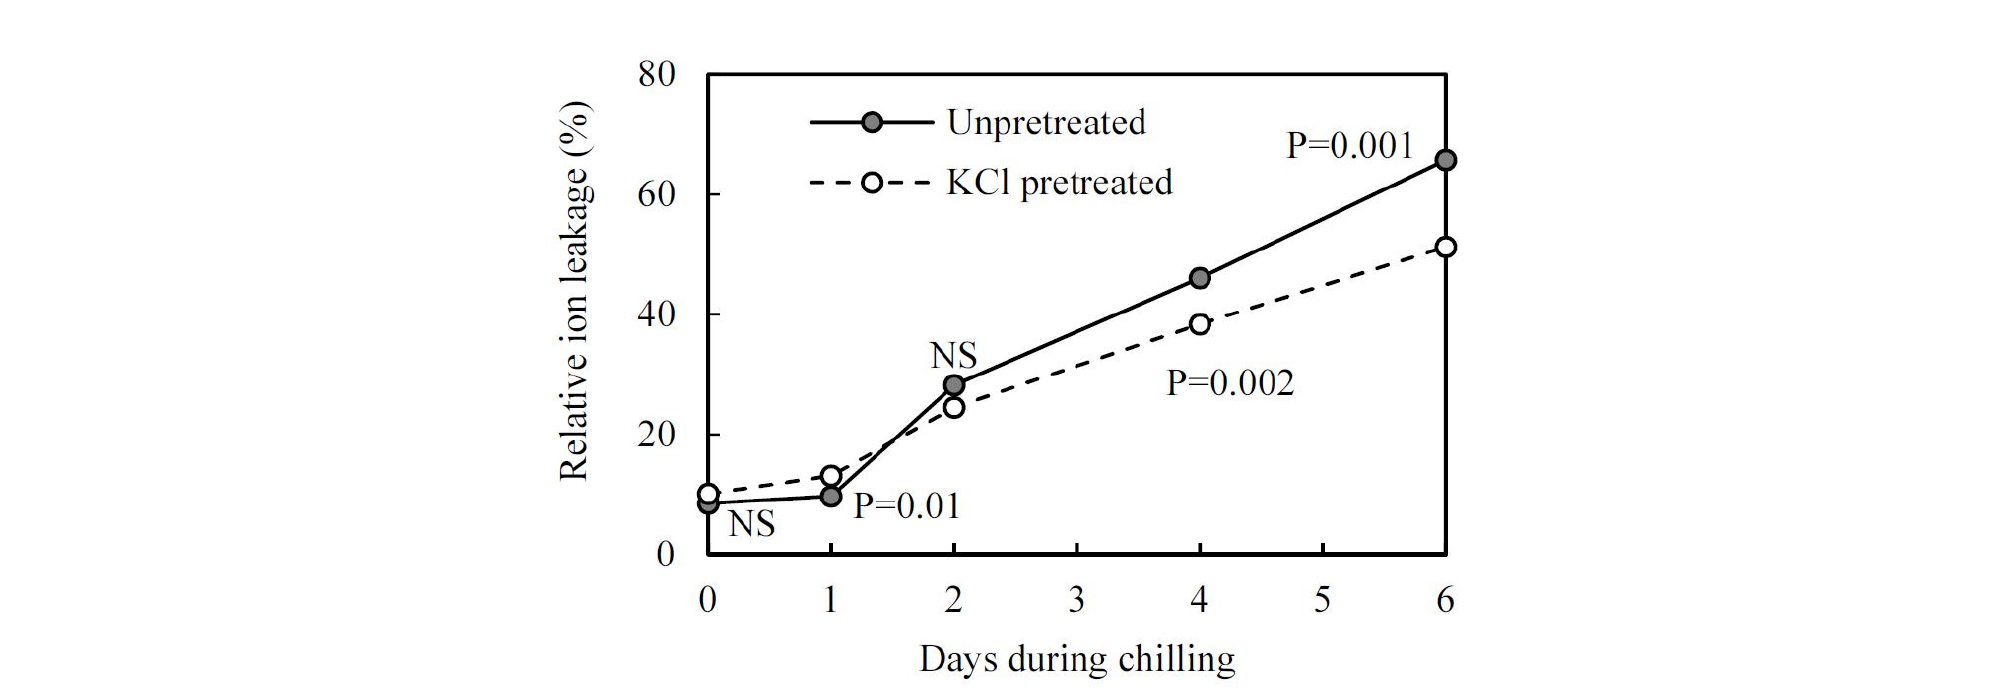
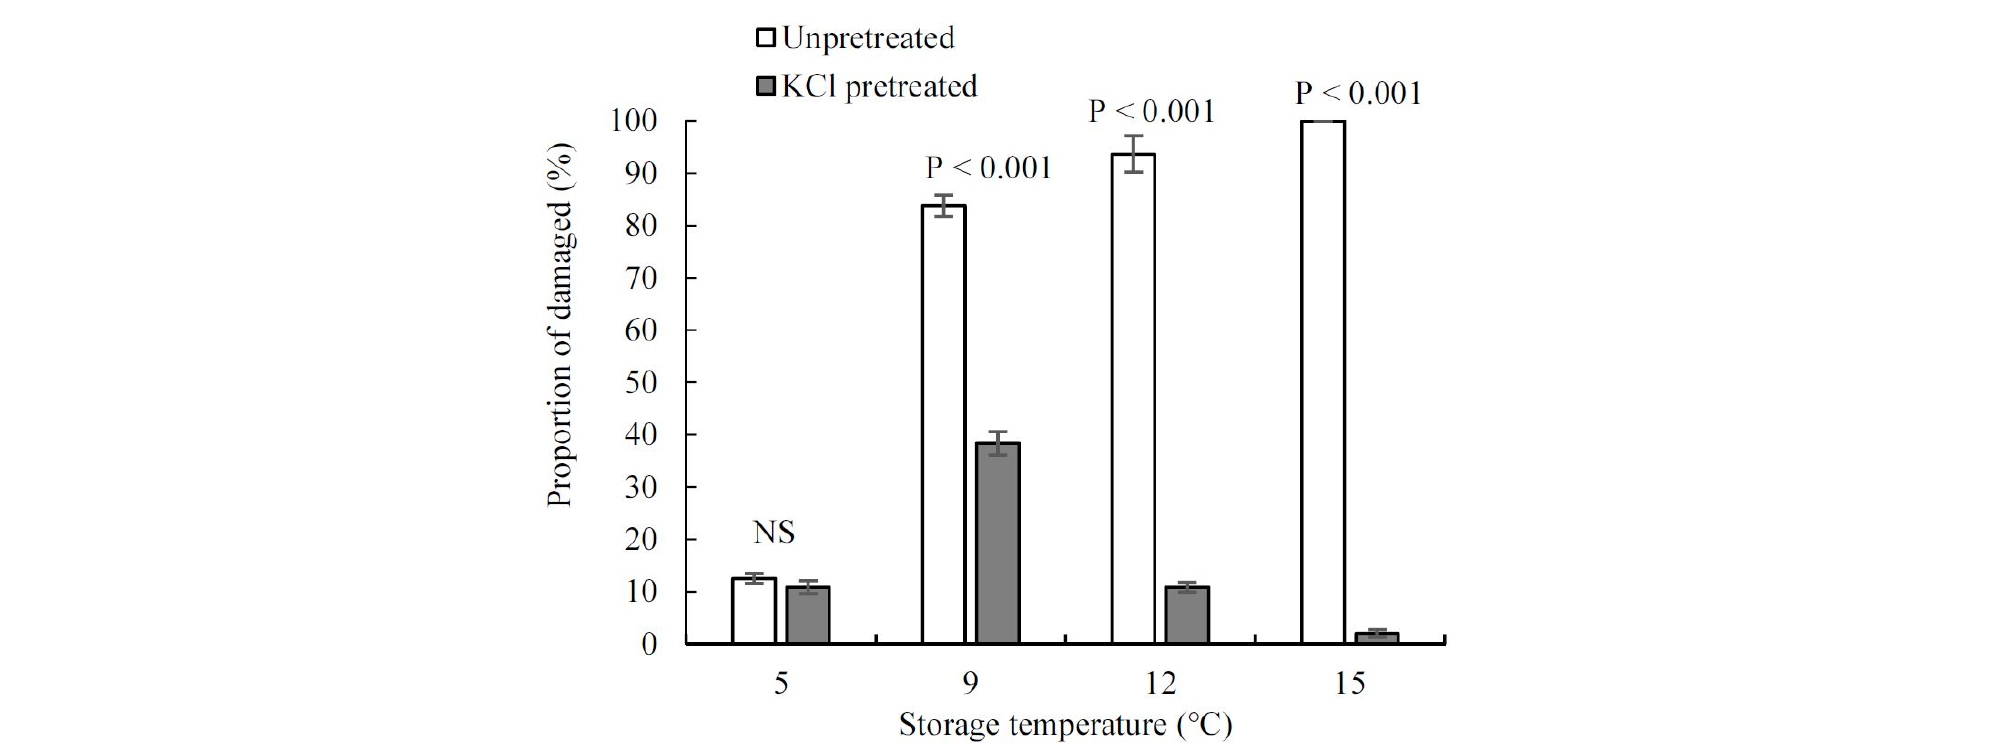
Added high-salinity KCl declined RWC by 8 % and increased ion leakage by 1.67 % on seedling leaves, compared with unpretreated seedlings (Figs. 3 and 4). After water restriction, the RWC of control seedlings declined by 23 %, but that of the KCl pretreated seedlings only declined by 8 %, while the RWC of pretreated seedlings under drought was higher than that of unpretreated seedlings (Fig. 3). Importantly, after a week of water deficit, severely wilted seedlings were observed in the control treatment, but they were not observed in the treated seedlings. At the beginning of the chilling stress, ion leakage value of the unpretreated seedlings held steady at about 8.5 %. It was not until two days’ stay in the chilling condition that a substantial increase was observed. However, the increment of the ion leakage in pretreated seedlings was more moderate than that in the unpretreated seedlings (Fig. 4). Seedling damage occurred after a long period of storage. There was a lower damage proportion of KCl pretreated seedlings at (9, 12, and 15)°C after 20 days’ storage compared with unpretreated; however, under low storage temperature (5°C), their damage degree was similar (Fig. 5).
Discussion
Our high-salinity level potassium salt stress experiment establishes that increasing the salinity levels of potassium salt induces seedling growth suppression of tomato seedlings. As mentioned in the literature review, a noticeable response of growth to salinity stress is a decrease in shoot growth (Negrão et al., 2017); consistent with this report, repeated addition of high-salinity levels of KCl, K2SO4, or KH2PO4 markedly decreased shoot dry matter production (Table 1). High-salinity stress can change the allocation of biomass between root and shoot (Negrão et al., 2017), even though in some species, it can improve the root system (Álvarez and Sánchez‐Blanco, 2014). Acosta-Motos et al. (2017) reported a 10 dS·m-1 NaCl solution significantly increased the root-to-shoot ratio. However, changes in the root-to-shoot ratio with potassium addition were not significant, due to the decrease of root dry matter production, which showed the same trend as shoot. This suggests that the growth responses induced by potassium salts stress differ from those induced by sodium stress. The growth response to added excessive potassium salts observed in the leaf area is consistent with the mechanism that salinity stress affects cell expansion in young leaves, causing a decrease in leaf area (Munns and Tester, 2008). The correlation of various growth indices was also significantly changed, which also demonstrated the large effect of potassium salts on growth (Table 2). These results are consistent with the possibility that increasing the salinity level of potassium salts is an effective means of inhibiting the rapid growth of seedlings. An increase in stem diameter was observed, regardless of the addition of any of the three potash fertilizers (Table 1). This may be associated with the physiological processes that potassium plays a particularly crucial role in controlling the process of photoassimilate loading into the phloem (Ache et al., 2001; Gajdanowicz et al., 2011), and then stimulates the thickening of the stem. A thicker diameter is helpful for transplanting, not to mention the key role of the stem in the transportation of water, and the translocation of carbohydrates (Kanai et al., 2008).
We expected to select an optimal potassium fertilizer to balance seedling quality and growth suppression, because the different accompanying anions may cause different effects. The SPAD has been shown to decrease under salinity (Negrão et al., 2017); consistent with this idea, repeated addition times of high-salinity levels of KCl or KH2PO4 also significantly reduced SPAD; however, with K2SO4 addition, the reduction of SPAD was not striking. As well, K2SO4 addition showed a minor effect on inhibiting the growth of plant height, while KCl or KH2PO4 addition showed much better (Fig. 2). These different responses may be associated with the accompanying anions in each potassium compound. On the other hand, because of the demand of the seedlings consumption market, we expected high-salinity stress would yield stocky size seedlings, and did not expect an increasing growth response to fertilizer addition, so potassium salts that contain nitrogen, like KNO3, were excluded because the nitrogen element in the nitrogen-containing fertilizer can greatly promote the vegetative growth of seedlings. Consistent with this expectation, we found that among the three sources, RGRH was most sensitive to KCl addition, while increasing the salinity levels of KCl solution declined the RGRH of seedlings (Table 3, Fig. 2a). Also, the compactness, which directly reflects the stocky growth index, increased in KCl or KH2PO4 treatments (Table 3, Fig. 2d). Despite the increment effect of compactness, the addition of 10 dS·m-1 KH2PO4 caused severe leaf damage, which may be attributed to the excessively high concentration. It is important to note that the same salinity level solution with different potassium fertilizers required different amounts. Among the three potassium solutions, to prepare 10 dS·m-1 solutions, the usage amount of KH2PO4 is far more than of KCl or K2SO4 (Fig. 1b). The plant height growth inhibitory effect of K2SO4 was not obvious, and if the salinity level was too high, KH2PO4 increased the risk of damage to seedlings, so these two kinds of potassium salts may not be satisfactory for achieving the target effect. KCl may be a desirable option for increasing salinity to inhibit seedlings growth, and to obtain stock size seedlings.
We expected the potassium treated seedlings would show better adaptability and survivability because potassium is associated with extensive adaptive responses of plants to the environment (Anschütz et al., 2014). A high accumulation of potassium, of which content exceeds the growth of plants, was considered as an “insurance policy” to enable the plant to better survive environmental stress (Kafkafi, 1990; Zörb et al., 2014), such as drought and chilling stress (Cakmak, 2005; Wang et al., 2013). Increasing potassium supply in a manner that increases the salinity level of potassium solution may enable increasing uptake, according to the idea that uptake of potassium by root is not usually limiting and it can be stored inorganically with little cost, and concentrated in the plant cell’s vacuole, depending on the supply. Initially, in the absence of environmental stress, only the addition of high-salinity KCl caused a stress effect on the seedlings, which was manifested as a decrease in RWC, and an increase in ion leakage; these results may be explained by the mechanism that plants under stress often lose some water from their tissues, which can have rapid and large effects on physiological processes, such as cell expansion, cell division, and abscisic acid accumulation. This again demonstrates the effect on growth suppression by high- salinity potassium application. However, after the intervention of environmental stress factors, the RWC and ion leakage index reversed; that is, the pretreated seedlings showed better adaptability than the seedlings without potassium addition. Not only that, KCl addition substantially increased the viability in long- term storage conditions, indicating that potassium addition is beneficial for long-distance transportation from nursery to the planting site. Additionally, low-temperature storage is generally an effective way to keep seedlings at an appropriate size for extension of the period of commercial sale.
These findings suggest that it is possible to apply the theory of salt stress-induced inhibition to growth control in seedling production. Seedling growth responded to high- salinity potassium supply, indicating that the properly increased salinity level of KCl or KH2PO4 supply can inhibit growth to overcome the problem of overgrowth, and to obtain stocky seedlings. Simultaneously, tolerance improvement in high-salinity KCl treated seedlings indicates that this environmentally friendly method can improve tomato seedling quality. This is the first attempt to document the combination of high-salinity potassium stress and seedling quality. A limitation of this research is that only one variety of one plant species was employed. Therefore, in our future research, we will test various cultivars and investigate the performance of transplanting.
