

Introduction
Materials and Methods
1. Data set
2. Orange 3 software
3. Selection of ideal model
Results and Discussion
1. Data set
2. Generating the workflow
3. Training of models
4. Selection of better performing AI model
Conclusion
Introduction
Tea, one of the most common and widely consumed beverages worldwide, is derived from the leaves of Camellia sinensis. Similar to other agricultural crops, tea leaves are susceptible to various diseases (Nanehkaran et al., 2020). Proper diagnosis of the disease is crucial to control and manage tea leaf diseases (Chakruno et al., 2022). However, distinguishing the symptoms of a particular disease is challenging as many diseases share similar characteristics and, require considerable time. As a solution, ongoing research in plant pathology and advances in disease identification techniques have provided new tools for the fast and precise detection of tea leaf diseases (Keith et al., 2006).
Deep learning, a subcategory of machine learning, is one of the most accurate and efficient methods that has revolutionized many industries, including agriculture, by providing advanced techniques for various tasks, such as disease detection and diagnosis (Hu et al., 2019). Recently, deep learning has gained considerable attention in tea cultivation for the detection of leaf diseases (Shruthi et al., 2019). Tea leaf disease recognition using deep learning generally uses a well-marked dataset of tea leaf images to train a deep learning model for tea leaf disease recognition. The model automatically distinguishes between healthy and diseased leaves, providing a precise disease identification method (Sladojevic et al., 2016).
Implementation of deep learning for tea leaf disease detection involves many challenges, including the need for large high-quality datasets, access to computational resources, and model deployment in real-world farming environments. The study of Barbedo (2016) highlights the limitations of disease identification through images, including busy backgrounds, unclear borders, and variations in capture conditions. However, data augmentation techniques can overcome these issues (Mikołajczyk and Grochowski, 2018). Furthermore, the high complexity and non-linearity of deep neural networks make it difficult to provide meaningful explanations of the predictions (Shrestha and Mahmood, 2019).
Orange 3 is an open-source data visualization and analysis software that includes a comprehensive set of machine learning algorithms designed for data mining, machine learning, and data science tasks (Demšar et al., 2013). Orange 3 provides a visual workflow that enables the users to deal with data interactively, perform data analysis, and create machine learning models without any advanced programming knowledge (Demšar and Zupan, 2012). New add-ons can be added to the orange 3 canvas as required (Mohapatra and Swarnkar, 2021). The image analytics add-on was used in this study includes import images, image viewer, image embedding, image grid, and save images widgets for image analysis.
However, it is crucial to identify the suitability of Orange 3 for scientific research and papers. Ratra and Gulia (2020), has evaluated the open-source data mining tools and suggested that Orange 3 is one of the effective software for data mining. Furthermore, they have suggested that results can be different depending on datasets or algorithms. Vaishnav and Rao (2018) utilized Orange 3 for fruit classification, highlighting its versatility in combining model training, testing, data preprocessing, and visualization in a single software package for scientific research. Furthermore, Ishak et al. (2020) have used orange 3 for their scientific studies.
In this study, the five AI models were taken, namely, Inception v3, SqueezeNet (local), VGG-16, Painters, and DeepLoc. Google’s Inception v3 model was trained using ImageNet. Information in the Inception-v3 [4] model can recognize 1000 classes in the ImageNet (Tiwari et al., 2022). Squeeznet model is a quick and small image recognition model built with ImageNet. It takes less bandwidth for this model to export new models to the cloud, and its tiny architecture makes it simpler to use on FPGA devices and other systems with memory constraints (Hidayatuloh et al., 2018). Two deep neural networks, VGG16 and VGG19, were developed by the Visual Geometry Group at the University of Oxford to help with image identification that was trained using the ImageNet dataset. Another embedder in Image Embedding is Painters, the winner of Kaggle’s Painter by Numbers competition. It was trained using 1,584 artists’ works from 79,433 pictures. A neural network called DeepLoc was trained with 21,882 single-cell images, each of which was uniquely labeled as belonging to one of 15 localization compartments (Tiwari et al., 2022). However, neural network models may not have the same accuracy level. Therefore, the performance metrics; F1, precision, recall, and confusion matrix can be used to evaluate models, determining accuracy and efficiency (Vaishnav and Rao, 2018).
In this study, we aimed to identify the most accurate deep learning model among the aforementioned AI models for the diagnosis of tea leaf diseases using Orange 3. For that, F1, precision, and recall values are taken. Further, the confusion matrix of the most ideal model is selected for further interpretation of images where the correctly classified and misclassified incidences.
Materials and Methods
1. Data set
In this study, we used tea (Camellia sinensis) leaf disease images. Kaggle website (Kaggle Data Science Company, 2017) was used to obtain the dataset and from there “tea sickness dataset” (Kimutai and Förster, 2022) was obtained for this study. Information on the number of images in each category of tea leaf disease is presented in Table 1. With a total of 885 images, the dataset included eight categories of tea leaf diseases: healthy, algal leaf spot, anthracnose, bird’s eye spot, brown blight, gray blight, red leaf spot, and white spot. The classes with the highest number of images were the red leaf spot and white spot, with 143 and 141 images, respectively. The class with the lowest number of images was healthy, containing only 74 images. To assess the implementation of the machine learning model, the dataset was split into two parts, with 700 images used for training and 180 images used for validation. Images of the input dataset are shown in Fig. 1.

Table 1.
Number of images in each category of the input dataset.
| Disease | Number of Images |
| Algal leaf spot | 110 |
| Anthracnose | 100 |
| Bird’s eye spot | 100 |
| Brown blight | 112 |
| Gray blight | 100 |
| Healthy | 74 |
| Red leaf spot | 143 |
| White spot | 141 |
2. Orange 3 software
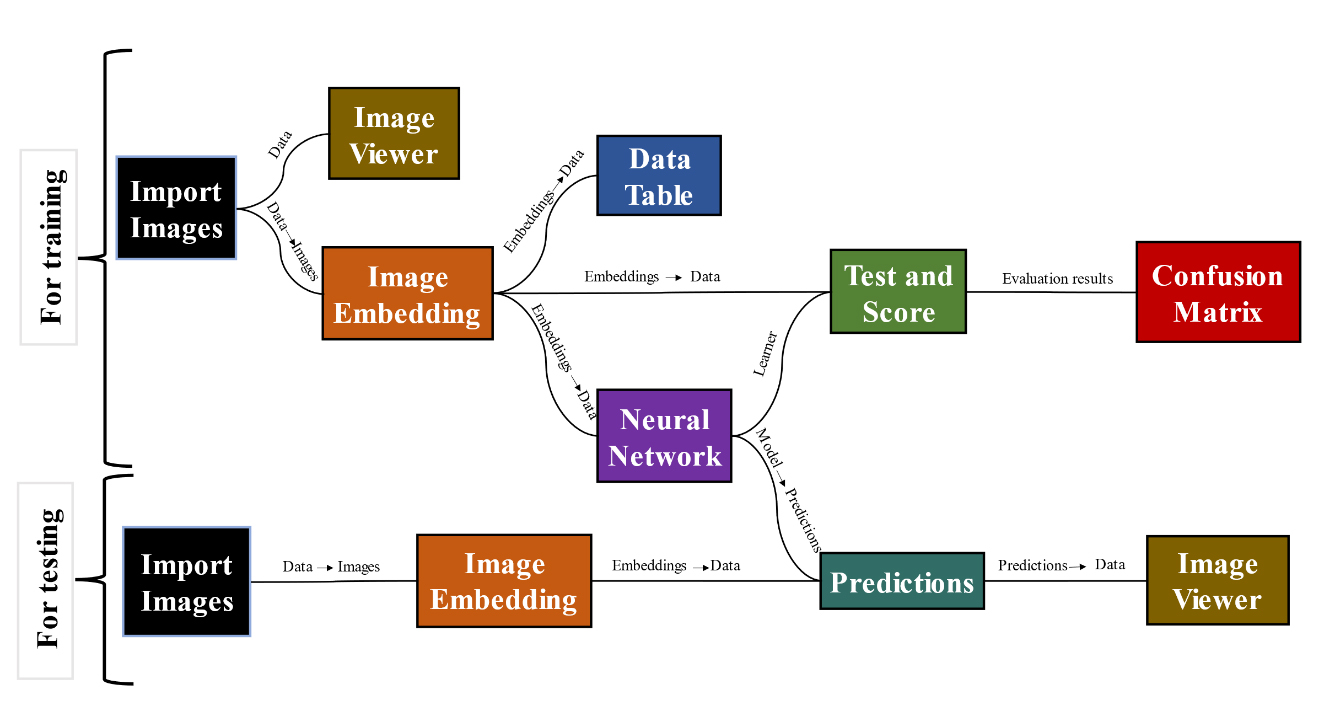
The basic settings of the orange 3 program were adjusted according to the requirements of this experiment before image analysis. All models were trained using the Adam solver, rectified linear unit (ReLU) activation function, 100 neurons in hidden layers, 200 maximum iterations, in the neural network, and 0.0001 regularizations. 700 total number of images were used to train the models. An image analytics add-on was also used in this study. For the training model, the import image, image embedding, neural network, test and score, and confusion matrix widgets were used, whereas for the predictions, the import images, image embedding, predictions, and image viewer widgets were used (Fig. 2). The precision, F1, and recall of the five deep learning models (Inception v3, SqueezeNet [local], VGG-16, Painters, and DeepLoc) were calculated to evaluate their accuracy of detection.
3. Selection of ideal model
To select the ideal model and estimate its performance, three performance evaluation metrics (precision, recall, and F1 score) were recorded (Table 2). The formulas of these metrics are provided in (1), (2), and (3), respectively, as previously reported (Tripathi, 2021).
(TP: True Positive, FP: False Positive, FN: False Negative)
Table 2.
Performance matrix (F1, precision, and recall) of each model in Orange 3.
| Model | F1 | Precision | Recall |
| Inception v3 | 0.806 | 0.807 | 0.807 |
| SqueezeNet (local) | 0.901 | 0.901 | 0.901 |
| VGG-16 | 0.779 | 0.780 | 0.780 |
| Painters | 0.799 | 0.800 | 0.799 |
| DeepLoc | 0.770 | 0.771 | 0.771 |
The number of true positive labels when positive labels are offered is referred to as precision. Recall refers to the number of instances that are accurately classified as positive. The overall performance of the model was assessed using the F1 score, which is an evaluation metric that considers both precision and recall. A false positive refers to a situation in which a false response is msitaken to be true, whereas a true positive refers to a situation in which a false answer is mistaken as true. Conversely, a true negative reflects situations in which a false response is predicted to be true. A false negative represents a situation in which the correct answer is predicted as false.
In this experiment most ideal model was selected based on the model’s F1, precision, and recall values which have a value closer to one and also the highest value compared to all other models. Further, the ideal AI model which has the best performance matrix was selected based on the TP, TN, FP, and FN number of images.
Results and Discussion
1. Data set
In this study five different AI models, namely, Inception v3, SqueezeNet (local), VGG-16, Painters, and DeepLoc were used to detect different types of tea leaves diseases from the dataset as these models are provided from the orange 3 software. In the dataset, there were eight categories of tea leaf diseases which are characterized by different types of symptoms as shown in Fig. 1. Different numbers of images in each class were used for this study as shown in Table 1. However, it is crucial to provide similar conditions for each AI model to avoid biased results. Therefore, before implementing image classification, data augmentation is a technique for addressing issues like insufficient training data or unequal class distribution within datasets (Mikołajczyk and Grochowski, 2018). Also, it is a commonly used method in machine learning and computer vision research for creating new iterations of an existing dataset and is especially helpful when the model needs to learn various iterations of the same object or when the initial dataset is small (Singh et al., 2020). By making numerous changes to the original photos, data augmentation can assist in improving the model’s robustness and generalization and produce better results. Moreover, it can aid in balancing the dataset (Shi et al., 2022). In this study, we followed a procedure that is mostly similar to the study conducted by Singh et al. (2023), and they also used different numbers of tea leaf images in each class and data augmentation was performed to their dataset to balance the dataset which is consistent with our study.
2. Generating the workflow
The workflow of Orange 3 can be generated by using widgets as required. In this study, the image analytics add-on was installed for image classification, as previously described (Demšar et al., 2013). As shown in Fig. 2, the workflow consists of two sections for dataset training and testing. The import images widget was used to upload the images, and the image viewer was used to display the uploaded images. The image embedding widget was used for extraction by uploading the images from the dataset to the server using a particular model to detect the features of each image and provide the feature vectors as a confusion matrix, which extracts features from the given dataset along with size, height, and width as key features. Moreover, these main features are used by the algorithms to learn other specific features in each image (Ishak et al., 2020). Furthermore, Adam solver, ReLU activation function, 100 neurons in hidden layers, 200 maximum iterations in the neural network, and 0.0001 regularizations were adjusted before implementing the training of models in this study.
3. Training of models
All models were trained using a training dataset which consists of well-marked images. To train each model, the number of neurons in hidden layers in the neural network model is one of the important factors for better functioning of AI models. In this study, under the ‘neural network’ widget, the number of neurons was adjusted to 100 in the hidden layers. Generally, a simple neural network comprises an input layer, an output layer, and one or more hidden layers. Each node in the input layer is connected to a node in the hidden layer, and each node is connected to a node in the output layer (Guo et al., 2017). The convolutional neural network (CNN) model, which consists of one input layer, four convolution layers, and two fully connected layers has been proposed by Latha et al. (2021). The input layer receives the image, and the output layer divides it into different classes. Convolution layers primarily extract features from the input images in the dataset. The performance of the model can be further enhanced by varying the number of layers, learning rate parameters, and optimizers used. Datta and Gupta (2023) proposed the use of multiple hidden layers in the CNN model for the accurate identification of disease classes. The deep learning models performed exceedingly well mainly because the hidden layers have a profound understanding of the immense amount of data (Kansara and Sawant, 2020). However, the accuracy of the model can differ with the number of hidden layers in the neural network. Raut and Dani (2020) have found that the number of hidden layers in the neural network has a significant effect on the model’s accuracy. They show that the accuracy of the model rises gradually for a particular number of layers and then decreases sharply once saturation is reached. Therefore, it is crucial to determine the proper number of neurons for the initial hidden layer, as it negates the need for additional hidden layers. Similarly, increasing the number of neurons or hidden layers results in making the network more complex (Shafi et al., 2006). In this study, we used the maximum available number of neurons (100) which is consistent with Uzair and Jamil (2020) study to avoid inaccuracies in complex situations due to improperly trained neural networks. However, it is needed to evaluate the optimum number of neurons for the neural network model to detect tea leaf diseases in future studies. Moreover, it is currently uncertain how to calculate the number of hidden layers and the number of neurons in each hidden layer to achieve high accuracy (Raut and Dani, 2020).
The complexity or smoothness of the model is penalized by regularization, allowing good generalization to unobserved data, even when training on a limited training set or with insufficient iterations. Therefore, regularization is a technique intended to enhance the generalization ability of a model by reducing overfitting (Tian and Zhang, 2022). Better performance on the training dataset and better predictions on new data indicate good generalization ability of the model (Neyshabur et al., 2017). In this study, regularization was adjusted to 0.0001 for better functioning of AI models. Though the regularization techniques might effectively address overfitting and underfitting issues; nonetheless, neural network models continued to experience issues during training despite the application of certain regularization values. Therefore, the problems are difficult to overcome, and more future research work is needed to overcome these issues (Nusrat and Jang, 2018).
An activation function is required for the hidden layer of a neural network to introduce non-linearity. Without an activation function, the neural network will be similar to plain perception, and the effect will not be powerful with linear functions. Linear, threshold, and sigmoid functions can be used as activation functions. Because it combines nearly linear, curvilinear, and nearly constant behaviors depending on the input value, the sigmoid activation function is frequently used for hidden layers (Mirza, 2018). SUM is a collection of hidden layer output nodes that have been multiplied by connection weights, summed to produce a single value, and passed through the activation function (Fig. 3). The output of a sigmoid function can only be a number between 0 and 1, whereas the input can be any value between negative and positive infinity (Sharma et al., 2020). Since the activation range is limited, blowing up during the activations is easy to avoid. Therefore, this is the most commonly used activation function. However, according to some research studies, the sigmoid function is not ideal because approaching either end of the function’s range, Y values have a tendency to respond slightly to changes in X values (Szandała, 2021). Compared with equivalents with saturating non-linearity, deep neural networks using ReLU train substantially more quickly. Large models trained on large datasets perform significantly better with quick learning. ReLU simply retains the positive component while eliminating all negative values and replacing them with 0. As the derivative of the positive part of this non-linear function is constant, it is superior to saturating non-linearity. Therefore, ReLU is not affected by vanishing gradients (Jiang et al., 2018). In this study, the ReLU activation function was used. However, Sibi et al., 2013 have shown that the performances of different activation functions are not significantly different and have approximately the same effect on a successfully trained network.
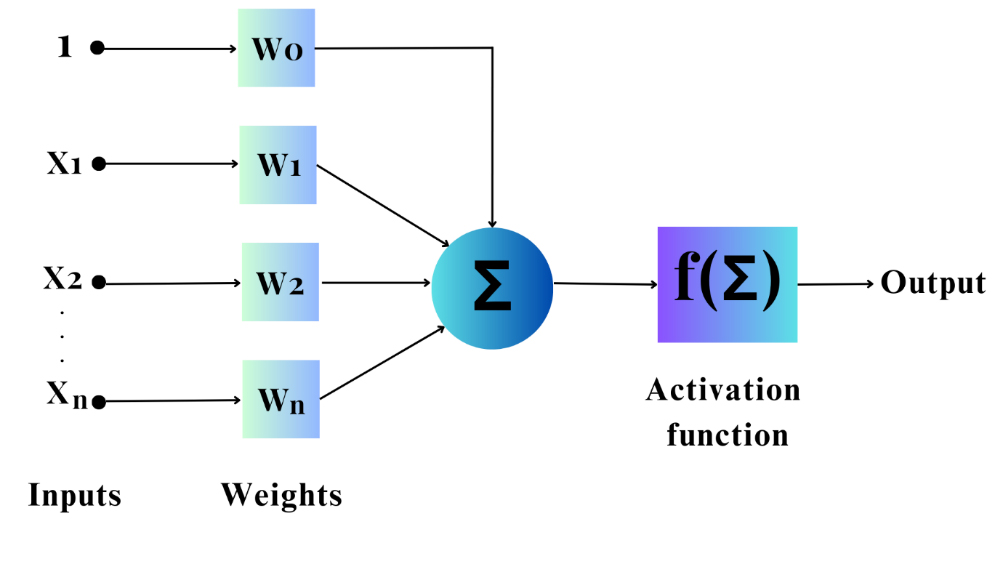
Fig. 3.
The Flow of signal through activation function created based on the study of Sibi et al., 2013.
In order to calculate the Precision score and identify the type of tea leaf disease, we employed cross-validation for the predictive performance evaluation of the six AI models. When utilizing supervised learning for categorization, the cross-validation approach is recommended (Vaishnav and Rao, 2018). Supervised learning is used if fewer data points with well-marked training data are available. It deals with the training of models utilizing previously collected, prior known data (Mahesh, 2020). In this study well-marked training data set and test data set were used to determine the most accurate model to detect tea leaf diseases. Unsupervised learning often yields superior outcomes for large datasets (Mahesh, 2020).
4. Selection of better performing AI model
To select the best model, different values obtained were considered. For instance, precision, recall, F1 value, and the confusion matrix’s performance were evaluated in this study. From of five AI models, the precisions of the neural networks of Inception v3, SqueezeNet (local), VGG-16, Painters, and DeepLoc were 0.807, 0.901, 0.780, 0.800, and 0.771, respectively. F1 score and recall values are listed in Table 2. F1, precision, and recall values are taken based on the number of true positive, true negative, false positive, and false negative images taken from the confusion matrix. The number of true positive labels when positive labels are offered is referred to as precision whereas recall refers to the number of instances that are accurately classified as positive. The overall performance of the model was assessed using the F1 score, which is an evaluation metric that considers both precision and recall. Therefore it is important to select a model that shows the highest F1, recall, and precision value (Tiwari et al., 2022). From the overall results, the SqueezeNet (local) model was selected as the optimal AI model for tea disease detection using tea leaf images owing to its high precision, F1, and recall values.
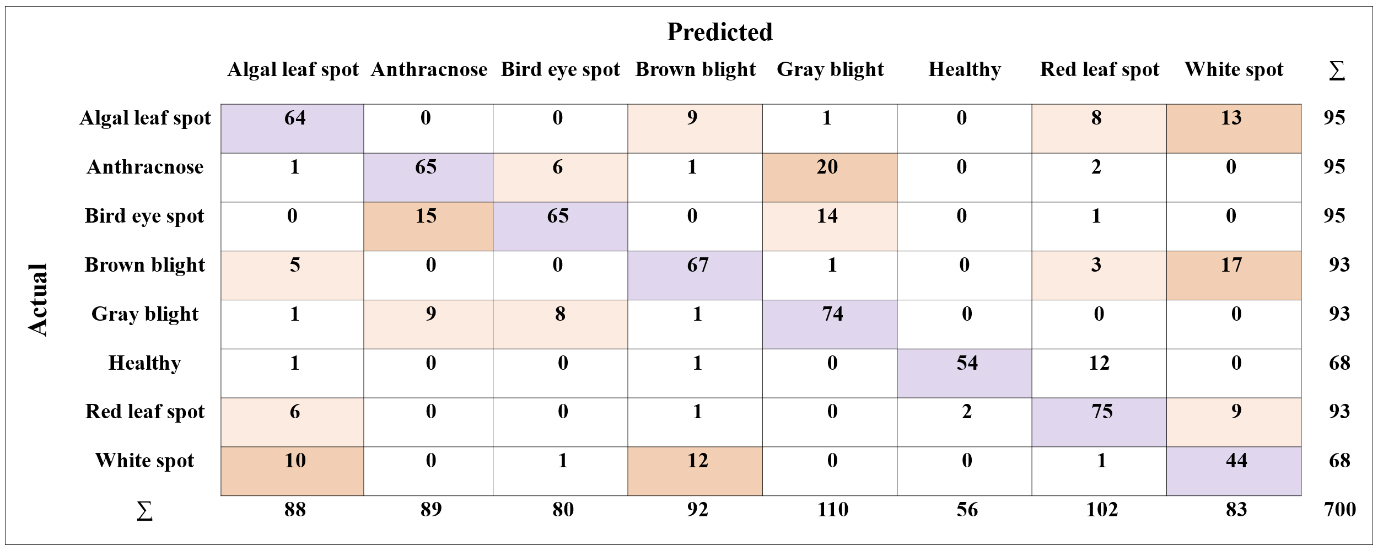
A confusion matrix was obtained in this study to determine the ideal model for tea leaf disease classification. The number/proportion of instances between the predicted and actual classes is shown in the confusion matrix which provides information on the functioning of AI models. Fig. 4 is the confusion matrix of the SqueezeNet model after performing cross-validation for clear understanding. Moreover, the confusion matrix can be used to calculate the prediction errors of the model. Off-diagonal matrix elements define the prediction error, whereas diagonal elements determine the accuracy of the prediction (Demšar et al., 2013). The confusion matrix of an effective model with better performance typically has high diagonal values. In this study, the predictions of the SqueezeNet model were successful, as indicated by the high diagonal values. In cases where the model made incorrect predictions, algal leaf spots were frequently misclassified as white spots, anthracnose as gray blight, bird’s eye spots as anthracnose, brown blight as white spots, gray blight as anthracnose, healthy leaves as red leaf spots, red leaf spots as white spots, and white spots as brown blights. Moreover, misclassified predictions were observed in off-diagonal cells. For instance, in this confusion matrix, of the 95 actual algal leaf spot images, the system predicted that 9 were brown blight disease, 1 image was Gray blight disease, 8 were red leaf spot disease, 13 were white spot disease, and of the 95 anthracnose images, it predicted that one was algal leaf spot. Further, 5 images of brown blight, 1 image of Gray blight, 1 image of healthy leaves, 6 images of red leaf spot, and 10 images of white spot disease were incorrectly predicted as algal leaf spot. However, these misclassifications were considerably low in the SqueezeNet model compared to other AI models. Therefore, the SqueezeNet model was selected as an ideal model for the classification of tea leaf diseases as it has good performance throughout the confusion matrix in this study (Fig. 4).
The number of True Positive (TP), True Negative (TN), False Positive (FP), and False Negative (FN) images can be calculated from the confusion matrix for further interpretation (Fig. 5). Also, using those values, the classification accuracy of each image category can be calculated by a formula i.e. (TP + TN) / (P + N) where the “P” represents the actual positive (TP + FN) and N represents the actual negative (FP + TN) (Patro and Patra, 2014). However, in this study, accuracy was not calculated as the results were taken only from the software-analyzed data which is precision, F1, recall, and confusion matrix data. In future studies, it is more appropriate to calculate the accuracy of each model as well. In this study, the number of TP, TN, FP, and FN images was calculated only for the algal leaf spot images from the data obtained from the most ideal model, the SqueezeNet model’s confusion matrix, and shown in Fig. 6 for more clarification.
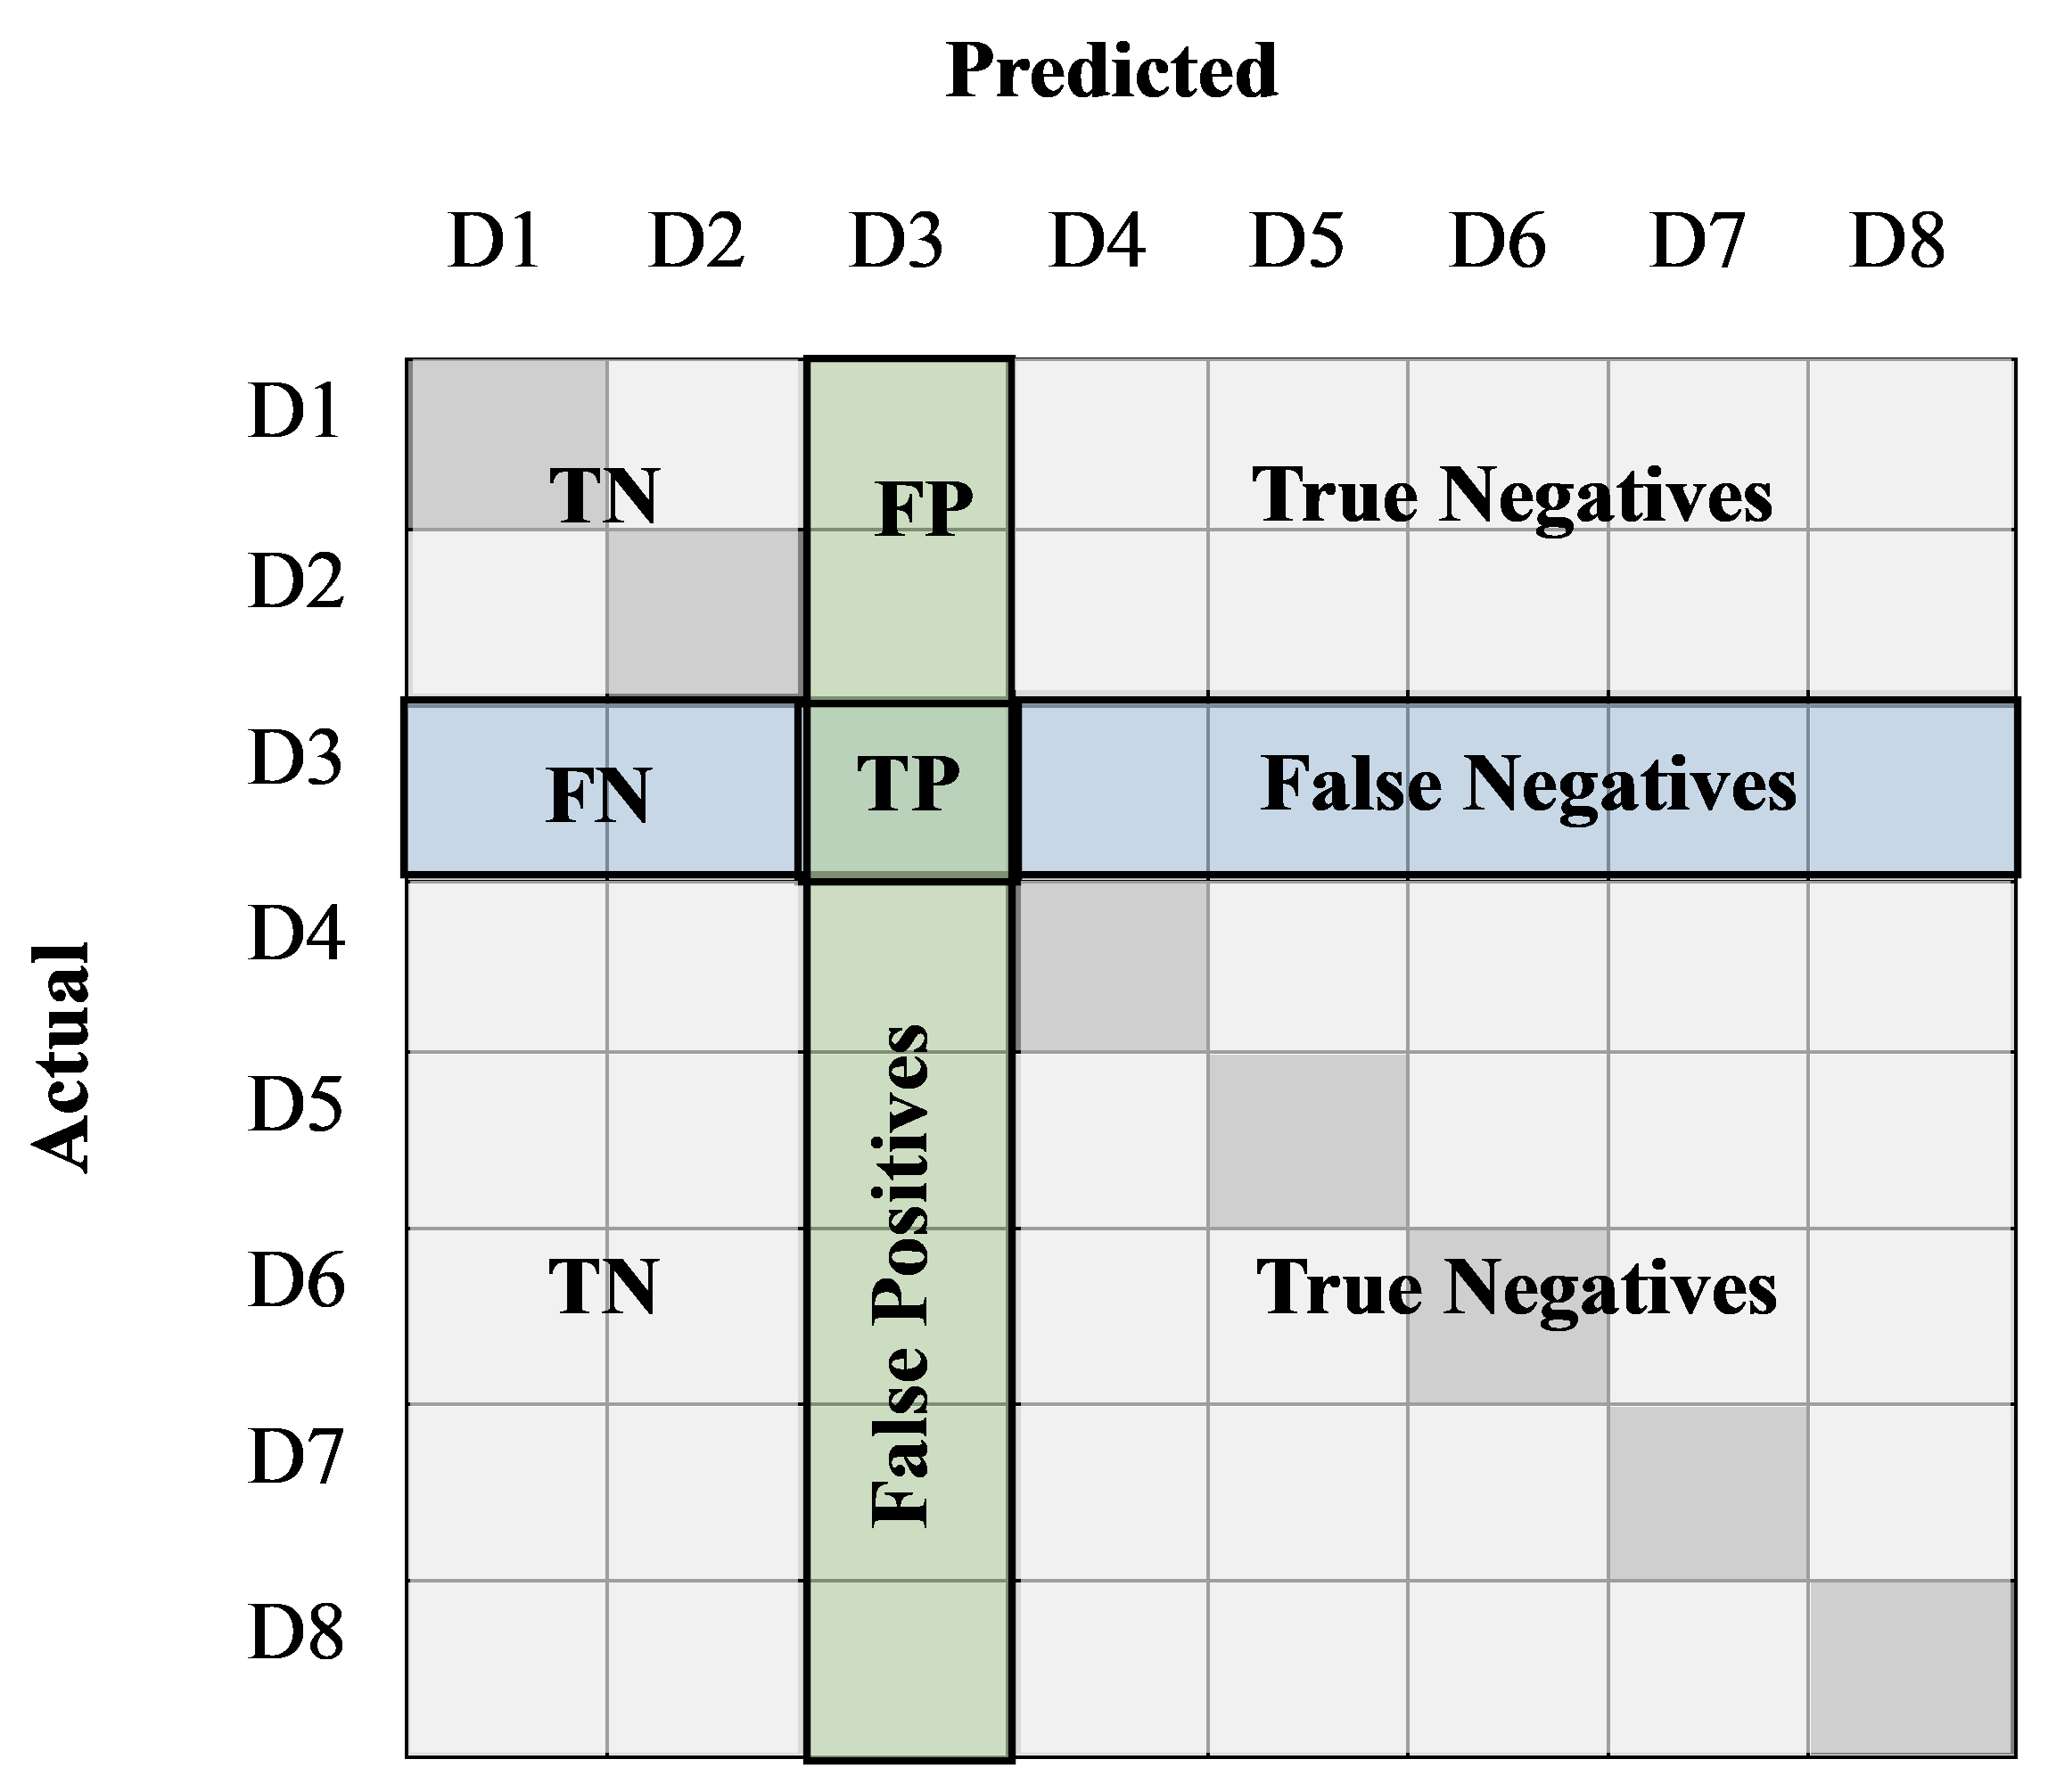
Fig. 5.
The way of obtaining images relevant to True Positive (TP), True Negative (TN), False Positive (FP), and False Negative (FN) for a particular selected disease category (in this Figure, D3 has selected) from a confusion matrix. D1 to D8 represents each image category taken for this study (D1 - algal leaf spot, D2 - anthracnose, D3 - bird’s eye spot, D4 - brown blight, D5 - Gray blight, D6 - Healthy, D7 - red leaf spot, and D8 - white spot). This Figure was designed based on the study of Patro and Patra, 2014.

However, some researchers have suggested that Inception V3 is an effective model for image classification. For example, Chugh et al. (2020)’s potato plant diseases categorization and, Xia et al. (2017)’s flower classification results have shown the highest accuracy of Inception V3 in image classification. However, in this study, Inception V3 has shown considerable precision compared to other models but lower precision reported than the SqueezeNet (local) model. Khan et al. (2021) suggested using SqueezeNet, a deep learning-based method, to classify six distinct diseases that significantly affect the quality and yield of citrus fruits. Moreover, among the two different deep learning models they have used, SqueezeNet and MobileNetV2, the SqueezeNet model performed more satisfactorily than MobileNetV2, with an accuracy of 96% which is consistent with our results. Similarly, Tiwari et al. (2022) have performed image embedding and classification using pre-trained deep learning architectures, namely, Inception V3, VGG16, VGG19, Painter, SqueezeNet, and DeepLoc. Results have shown that the SqueeseNet model performed well resulting in the highest accuracy of 95.14%. This fact was also proven by high precision, recall, and F1 score values of the SqueeseNet model which is mostly similar to our study results. Moreover, from the results of our study, SqueezeNet, Inception V3, Painters, VGG-16, and DeepLoc are the ascending order of AI models aligned according to the precision value obtained from each model, which the mostly similar pattern was obtained from the study conducted by Tiwari et al. (2022).
Conclusion
In conclusion, the precisions of the neural networks of the five AI models, namely, Inception v3, SqueezeNet [local], VGG-16, Painters, and DeepLoc were 0.807, 0.901, 0.780, 0.800, and 0.771, respectively. Performance metrics of each model were taken. From the results, the SqueezeNet (local) model was selected as the optimal AI model for tea disease detection using tea leaf images owing to its high level of precision, F1, recall values, and good performance throughout the confusion matrix. Our results suggest that the Orange 3 visual programming software is a feasible and convenient software package for deep learning-based disease detection and is beneficial for agricultural development. Further, the SqueezeNet model is suggested as the most ideal AI model for tea leaf disease detection through images. In future studies, it is more appropriate to use the same AI models to examine the accuracy of the models for various diseases of different plants, and it is more crucial to investigate how different image types affect the functioning of AI models.
